BTCUSD Weekly Outlook: Calm Around $68,774 as Traders Await Clearer Signals
BTCUSD consolidates near $68,774. Technicals show a strong downtrend on shorter timeframes, but daily indicators suggest a neutral stance. What's next?
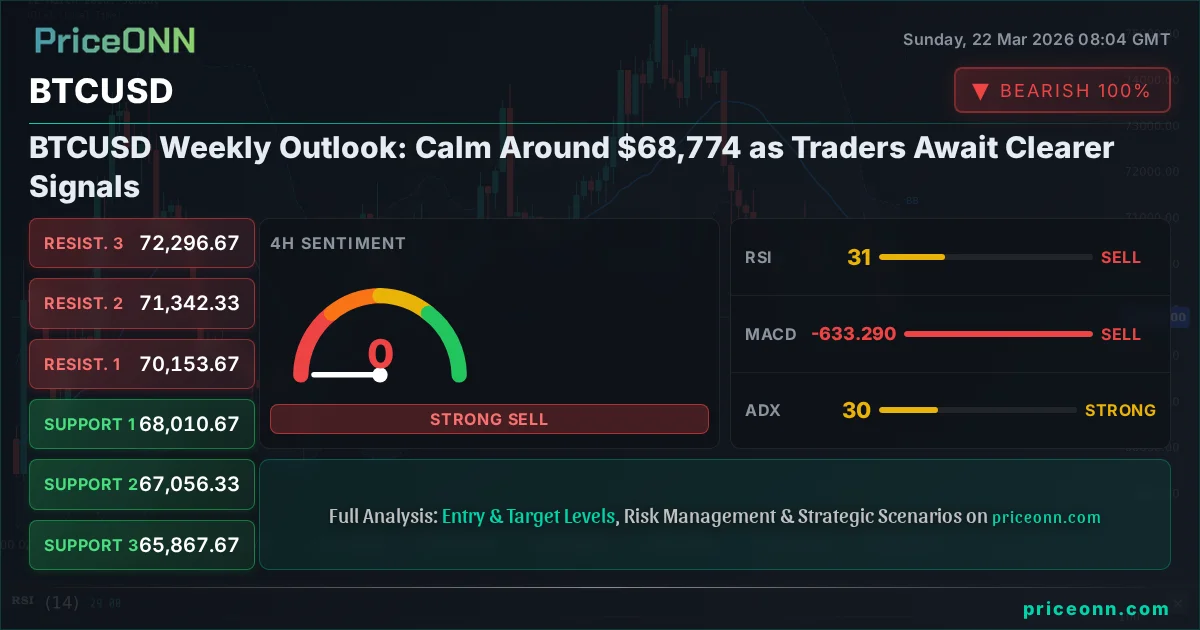
The cryptocurrency market, after a period of considerable volatility, has settled into a state of relative calm for Bitcoin (BTCUSD) this past week, with the digital asset consolidating around the $68,774 mark. This period of sideways movement, while seemingly uneventful on the surface, is crucial for understanding the underlying market sentiment and the potential trajectories ahead. Having tracked BTCUSD through significant market cycles, this consolidation phase around such a key psychological and technical level offers a unique vantage point. It's precisely during these 'flat weeks' that the market digests recent moves, recalibrates, and often sets the stage for the next significant price action. The current technical indicators, particularly on the shorter timeframes, paint a picture of prevailing bearish momentum, yet the daily charts hint at a market on the cusp of a decision, awaiting clearer fundamental or technical catalysts. This analysis delves into the intricate dance of indicators, levels, and broader market influences that are shaping Bitcoin's current posture, offering insights for traders and investors navigating this critical juncture.
- Bitcoin (BTCUSD) has consolidated around $68,774 this week, showing a lack of strong directional conviction.
- Shorter-term technicals (1H, 4H) indicate a strong downtrend, with RSI readings in oversold territory (e.g., 28.92 on 1H) and ADX showing strong trend strength (26.4 on 1H).
- However, the daily chart presents a more neutral picture, with RSI at 45.11 and ADX at 23.12, suggesting a lack of a dominant trend.
- Key support for BTCUSD is identified at $68,010.67, while resistance looms around $70,153.67.
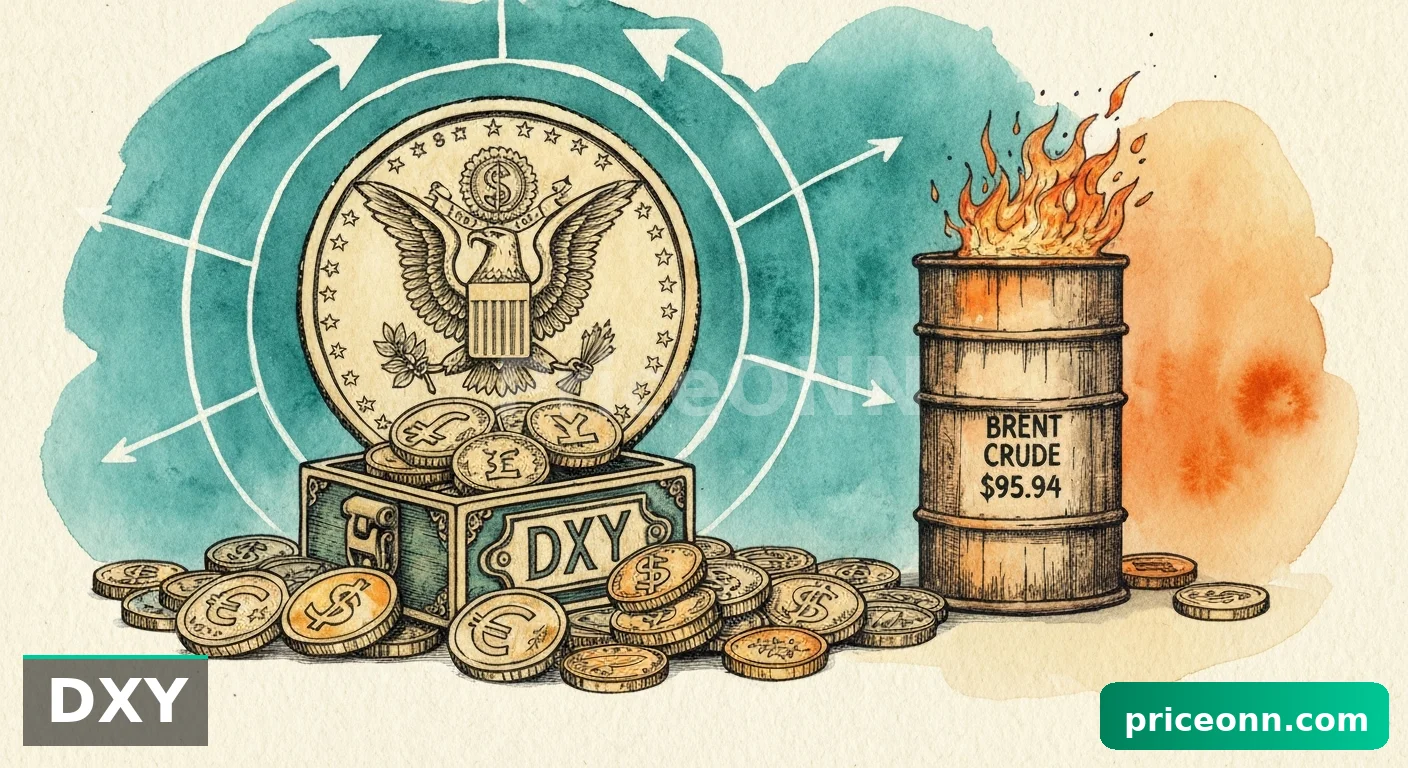
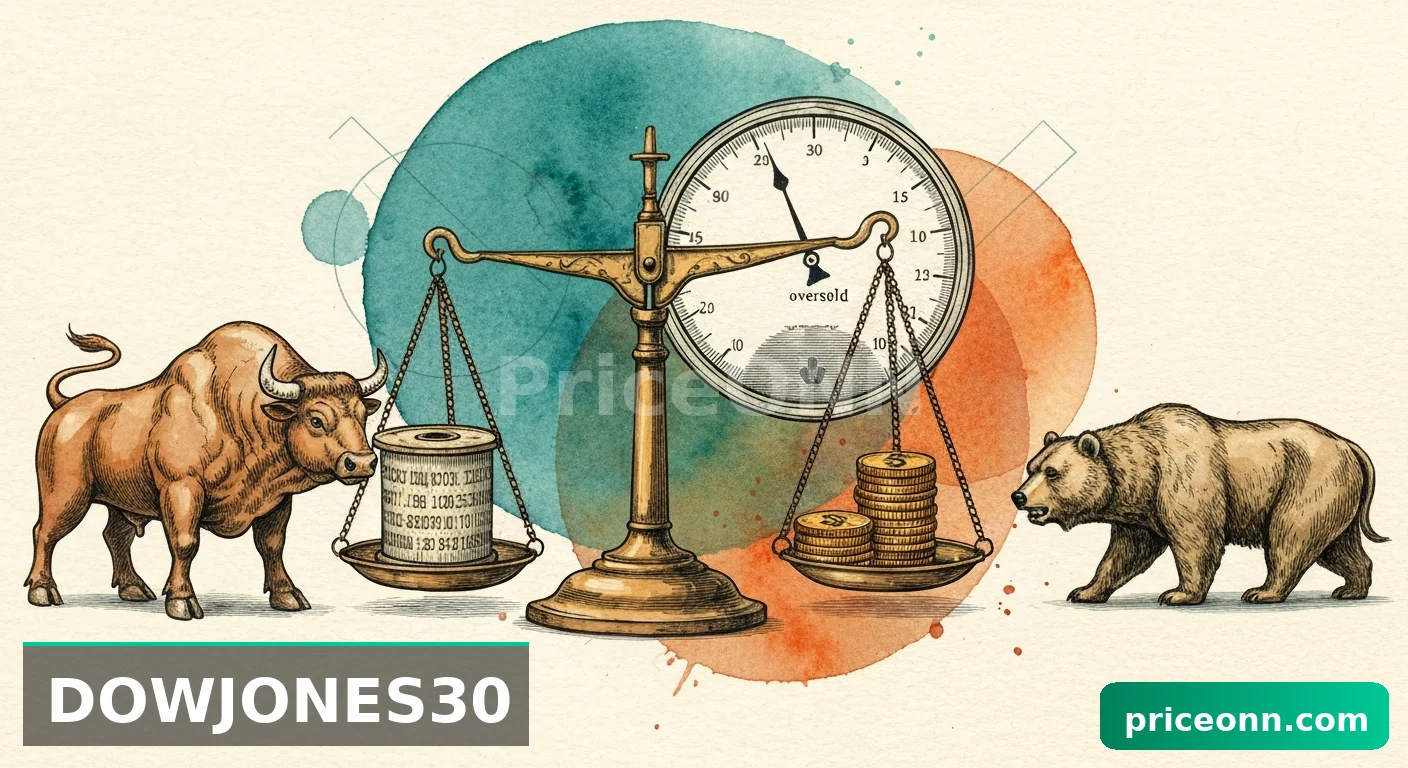
- The broader market sentiment, influenced by DXY's upward movement to 99.25 and risk-off appetite in equities (SP500 down 1.2%), suggests headwinds for risk assets like Bitcoin.
The past week has been characterized by a noticeable lack of decisive price movement for Bitcoin (BTCUSD), which has largely traded within a tight range, hovering around the significant $68,774 level. This period of consolidation follows a more volatile preceding week, suggesting that the market is in a phase of observation and digestion. From a macro perspective, several factors are contributing to this cautious sentiment. The US Dollar Index (DXY) has shown resilience, climbing to 99.25, which typically exerts downward pressure on risk assets like Bitcoin. Furthermore, major equity indices, including the S&P 500 and Nasdaq, have experienced notable pullbacks, reflecting a broader decline in risk appetite. The S&P 500, for instance, fell 1.2% to 6536.67, and the Nasdaq saw a 1.67% drop to 23986.8. This correlation between equities and cryptocurrencies remains a critical factor, and the current risk-off environment in traditional markets is undoubtedly casting a shadow over Bitcoin's potential for upward momentum. Investors are keenly watching these broader market dynamics, waiting for a clearer signal from either macroeconomic data or a significant shift in risk sentiment before committing to new positions.
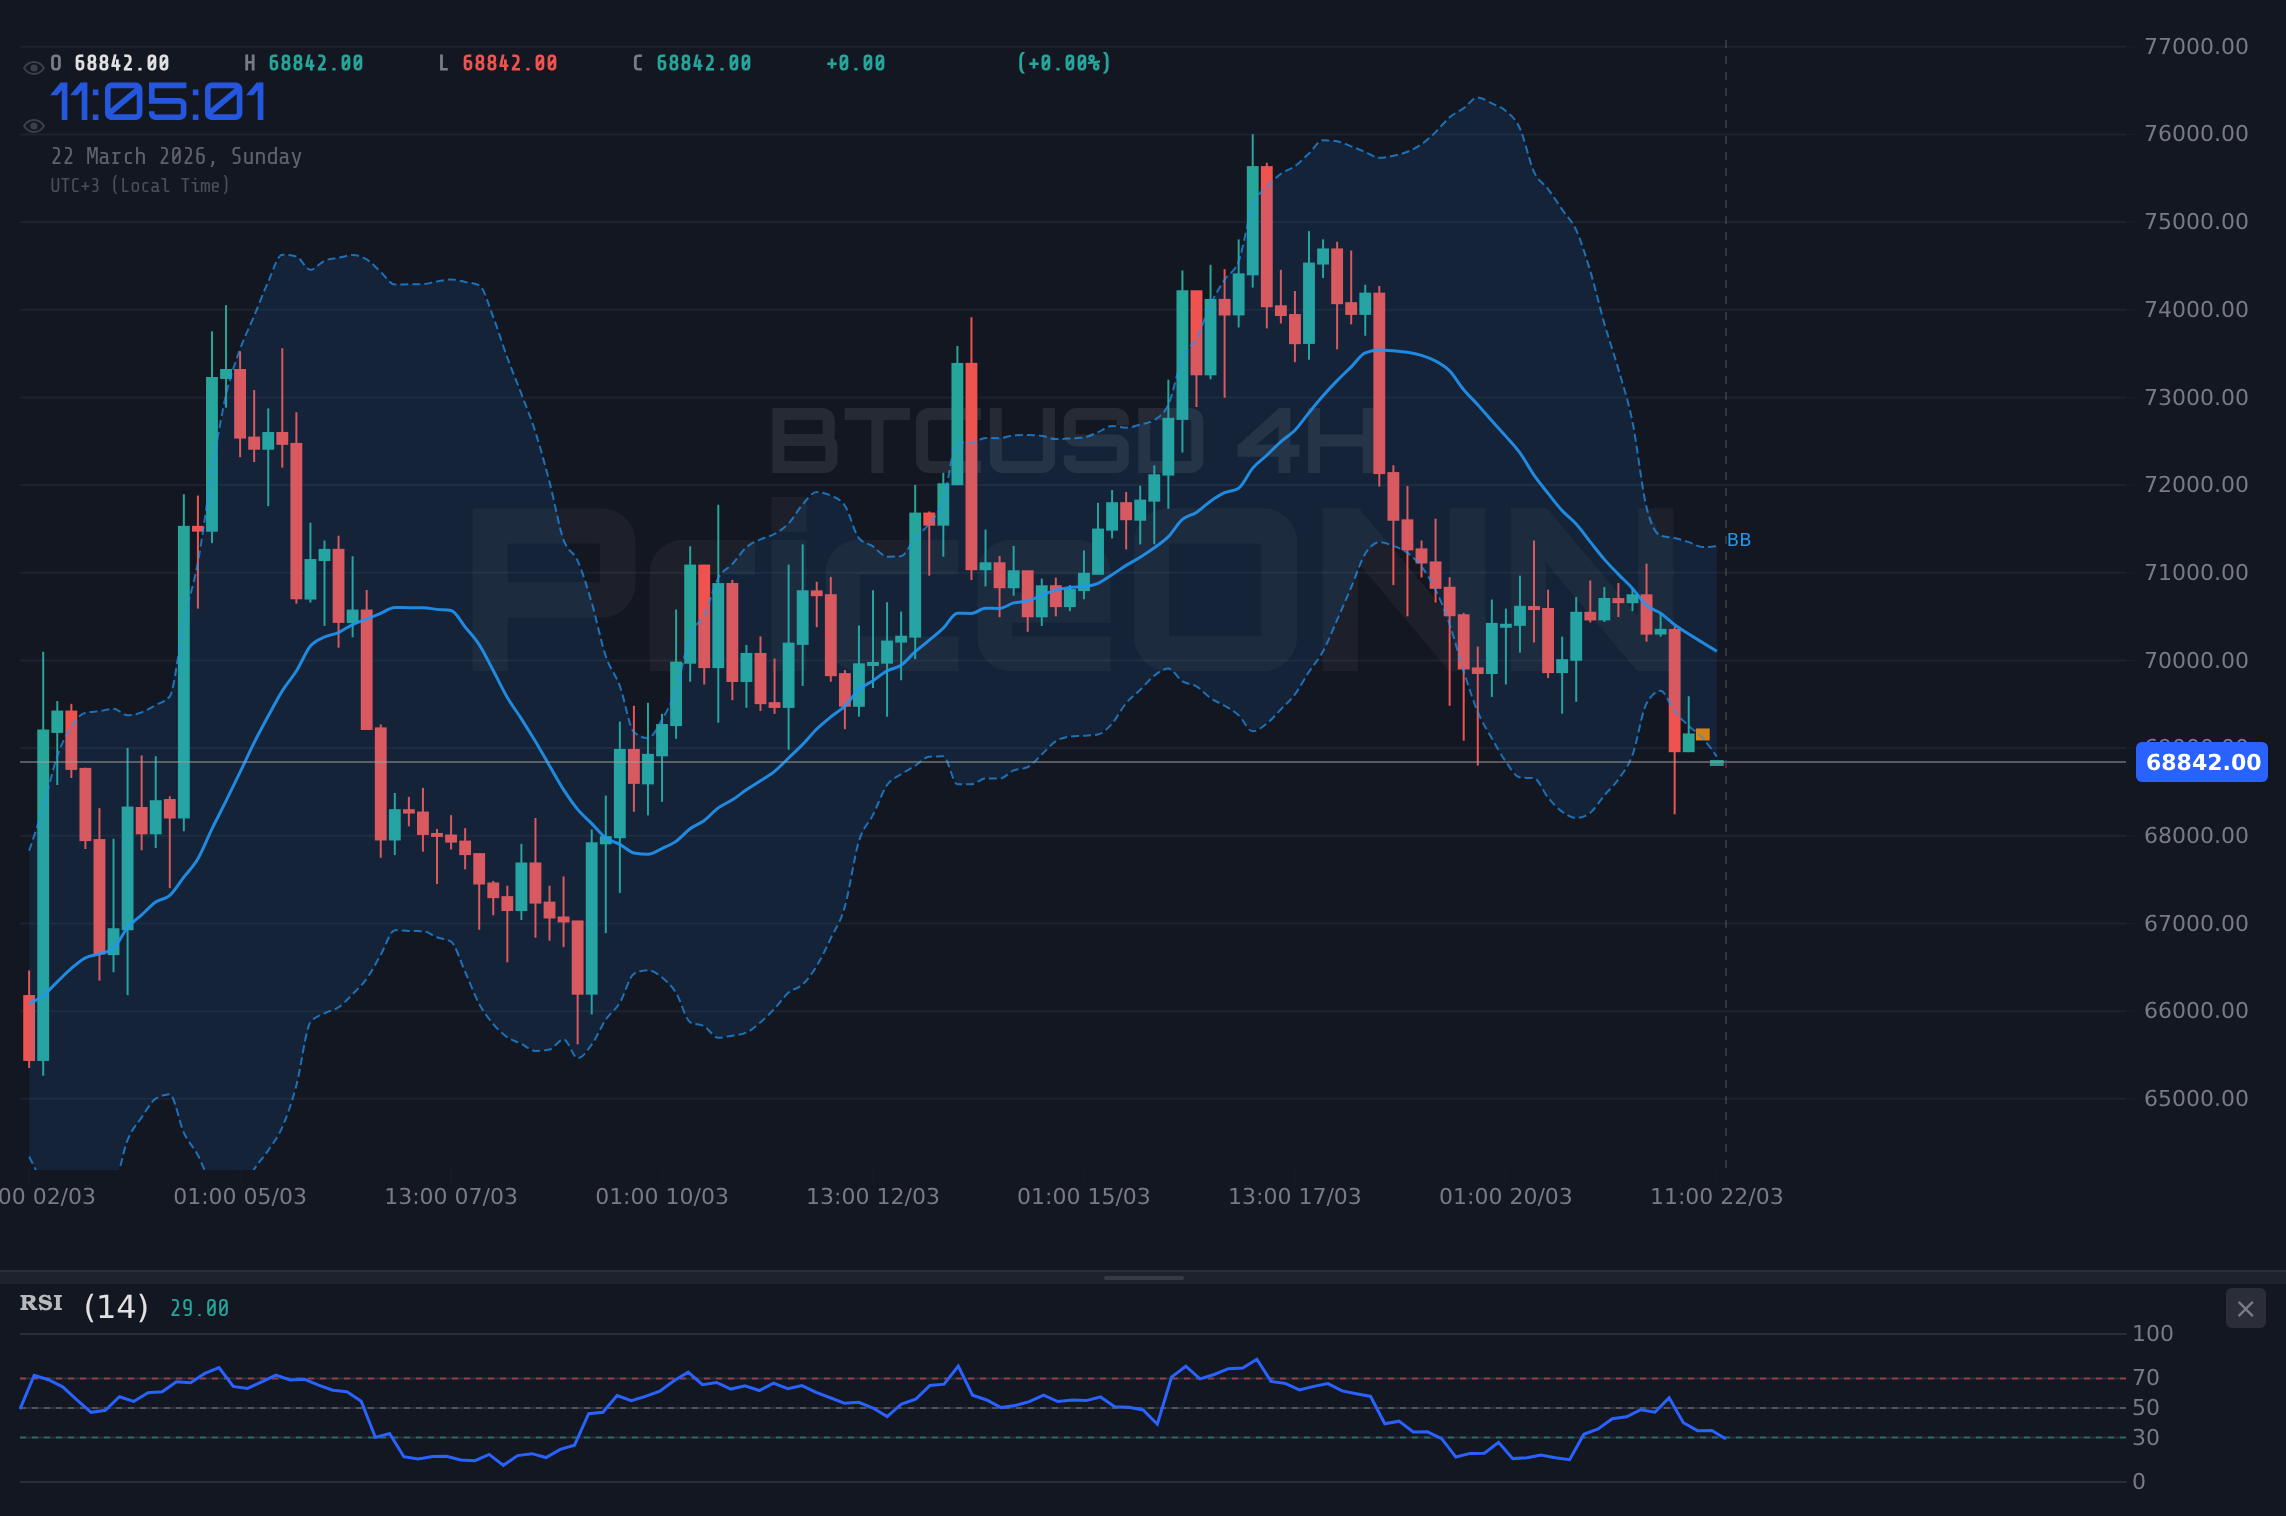
From a technical standpoint, the multi-timeframe analysis of BTCUSD reveals a divergence in signals, adding to the current market ambiguity. On the shorter timeframes, such as the 1-hour and 4-hour charts, the trend is predominantly bearish. The 1-hour chart shows a strong downtrend with an ADX of 26.4, indicating a firm directional move, albeit not exceptionally strong. The RSI(14) at 28.92 on the 1-hour chart is firmly in oversold territory, suggesting that while the downward momentum is present, the asset is becoming technically oversold, which could precede a bounce. Similarly, the 4-hour chart depicts a strong downtrend (ADX: 29.79), with RSI at 30.55, also pointing towards oversold conditions. The MACD histogram on both these shorter timeframes is negative, reinforcing the bearish sentiment. However, when we shift to the daily timeframe, the picture becomes significantly more neutral. The ADX stands at 23.12, signifying a weaker trend, and the RSI(14) is at 45.11, sitting squarely in the middle of its range and offering no clear indication of overbought or oversold conditions. This dichotomy between the shorter-term bearish pressure and the daily chart's neutrality is precisely why Bitcoin has been trading flat; the market is undecided, caught between the immediate selling pressure and the absence of a clear daily trend confirmation.
Why the Flat Week Matters for BTCUSD
This period of consolidation around $68,774 is more than just a pause; it’s a critical phase where the market is essentially testing the conviction of both buyers and sellers. On the 1-hour chart, the support level at $68,010.67 is a key area to watch. A decisive break below this level, especially on increased volume, would signal further downside pressure, potentially triggering stop-loss orders and accelerating a move towards the next support at $67,056.33. The ADX at 26.4 on this timeframe suggests that if a break occurs, the trend could quickly strengthen. Conversely, the resistance at $70,153.67 on the 4-hour chart represents the immediate hurdle for any bullish recovery. A sustained move above this level, confirmed by strong buying volume and a shift in daily indicators, would be necessary to invalidate the current short-term bearish bias. The fact that BTCUSD has been unable to decisively break either support or resistance in the past few days indicates a market in equilibrium, but one that is likely building pressure for a future move. This 'calm before the storm' scenario is typical in markets where significant news or data is anticipated.
Correlation Analysis: DXY and Equities' Shadow
The interplay between Bitcoin and the broader financial markets continues to be a dominant theme. As mentioned, the US Dollar Index (DXY) has been a significant factor, currently trading at 99.25. Its upward trajectory has historically correlated with weakness in risk assets, including cryptocurrencies. When the dollar strengthens, it often means that capital is flowing into perceived safe-haven assets, pulling away from more speculative investments like Bitcoin. This is particularly evident when looking at the performance of major equity indices. The S&P 500's decline to 6536.67 and the Nasdaq's fall to 23986.8 are not isolated events; they reflect a broader risk-off sentiment. This sentiment directly impacts Bitcoin. While some argue for Bitcoin's potential as a digital gold or an inflation hedge, its price action in recent times has more closely mirrored that of high-growth tech stocks. Therefore, any significant downturn in the equity markets or sustained strength in the dollar acts as a headwind for BTCUSD, limiting its upside potential and increasing the likelihood of downside continuation if key support levels are breached. The ADX on the daily DXY chart at 34.64 indicates a strong upward trend for the dollar, reinforcing the caution advised for Bitcoin longs.
The energy markets also warrant a mention, not as a direct driver of BTCUSD in the short term, but as an indicator of global inflationary pressures and geopolitical risk. Brent crude oil is trading at $112.54, up significantly, and WTI at $98.39, also showing strong gains. Such rises in energy prices can reignite inflation concerns, potentially influencing central bank policy. If inflation remains persistently high, it could lead to more hawkish stances from central banks, which would generally be bearish for risk assets like Bitcoin. Conversely, if these energy price surges are seen as temporary supply-driven shocks, central banks might maintain their current policies, which could offer some stability. The current uptrend in oil prices, with WTI showing a very strong daily ADX of 59.27, suggests that inflationary pressures are a persistent concern, adding another layer of complexity to the macroeconomic backdrop that BTCUSD is currently navigating.
On-Chain Activity and Market Sentiment Insights
While this analysis primarily focuses on technicals and macro correlations, it's crucial to briefly touch upon on-chain activity and market sentiment. Recent news highlights developments in Bitcoin's DeFi landscape, with protocols like OP_NET exploring 'SlowFi' directly on-chain without wrapped assets. While these innovations are crucial for the long-term adoption and utility of Bitcoin, their immediate impact on price action during this consolidation phase is likely minimal. More relevant are the movements of large holders, often referred to as 'whales'. Reports indicate significant whale movements, with over $100 million in BTC being shifted recently, sometimes coinciding with geopolitical tensions and oil price spikes. Such large movements can sometimes precede significant price shifts, either by accumulating during dips or distributing during rallies. The RSI at 45.11 on the daily chart suggests neither strong buying nor selling pressure is dominant, but these whale activities are a sentiment indicator that traders watch closely. If these movements signal accumulation, it could provide underlying support, while distribution would confirm the bearish leanings suggested by shorter-term technicals.
Navigating the Neutrality: What Do the Indicators Say?
Let's dive deeper into the technical indicators that are painting this mixed picture for BTCUSD. On the 1-hour chart, the Stochastic Oscillator readings (K=36.28, D=41.77) are approaching oversold territory but still show a bearish cross (%K < %D), reinforcing the immediate selling pressure. The MACD histogram is deeply negative, indicating strong bearish momentum on this short timeframe. However, the daily Stochastic (K=17.5, D=46.38) is also in oversold territory, but with a bullish cross (%K > %D), suggesting that a potential bounce could be on the cards from these levels. This conflict between short-term bearish momentum and longer-term oversold conditions with a bullish cross is a classic sign of a market in transition or consolidation. The ADX on the daily chart at 23.12 is the key takeaway here; it signifies a weak trend. This means that the current price action is more likely to be range-bound or consolidating rather than indicative of a strong, sustained move in either direction. For traders, this implies that breakouts from the current range will be significant, as they will likely be accompanied by a surge in ADX, confirming the initiation of a new trend.
The Bollinger Bands also offer insights. On the 1-hour and 4-hour charts, BTCUSD is trading below the middle band, aligning with the bearish trend. On the daily chart, however, price action is below the middle band but not yet testing the lower band significantly, suggesting room for further downside within the current range if selling pressure intensifies. The fact that the 1-hour RSI is at 28.92 and the 4-hour RSI is at 30.55 suggests that short-term oversold conditions are present. This could lead to a short-term bounce, perhaps targeting the middle Bollinger Band on the 1-hour chart, which aligns with the resistance level around $69,345.67. However, for this bounce to gain traction and invalidate the broader bearish outlook, it would need to be sustained and accompanied by improved daily indicators, particularly a rising ADX and a move away from the oversold daily RSI.
Scenario Analysis: Where Could BTCUSD Go Next?
Given the current technical setup and macro environment, we can outline three primary scenarios for BTCUSD's price action in the coming week. The prevailing sentiment leans bearish on shorter timeframes due to dollar strength and equity weakness, but the daily chart's neutrality and oversold conditions offer a glimmer of hope for a bounce.
Bearish Scenario: Downside Breakout
65% ProbabilityNeutral Scenario: Range-Bound Consolidation
25% ProbabilityBullish Scenario: Bounce from Oversold Levels
10% ProbabilityThe bearish scenario carries the highest probability at 65% due to the confluence of dollar strength, equity market weakness, and the prevailing short-term downtrend on BTCUSD. The oversold conditions on the 1-hour and 4-hour charts suggest that a bounce is possible, hence the 25% probability for a neutral, range-bound scenario. The bullish scenario, while technically possible from oversold daily conditions, currently has the lowest probability (10%) given the overwhelming macro headwinds and the lack of a clear daily trend reversal signal. Any bullish outlook would require a significant shift in market sentiment, a dovish surprise from central banks, or a clear breakout above key resistance levels, which currently seem unlikely without a catalyst.
What to Watch Next Week
Looking ahead to the next week, several factors will be crucial for determining Bitcoin's direction. Firstly, the ongoing performance of the US Dollar Index (DXY) and major equity indices will remain paramount. Any signs of dollar weakness or a recovery in risk appetite in the stock market could provide a much-needed tailwind for BTCUSD. Secondly, key economic data releases, particularly any information related to inflation or central bank policy expectations, will be closely scrutinized. While no major high-impact events are immediately listed in the provided context for the upcoming week, market participants will be hyper-aware of any commentary from Fed officials or shifts in interest rate expectations. Technically, the levels highlighted in the scenario analysis will be the key focus. A break below $68,010.67 would be a strong bearish signal, while a sustained move above $70,153.67 would be the first indication of a potential bullish reversal. The ADX on the daily chart remaining below 25 would confirm the neutral, range-bound expectation, while a move above 30 in either direction would signal the start of a new, stronger trend.
The current price action around $68,774 is a testament to the market's indecision. The strong bearish signals on shorter timeframes are being countered by the neutral daily indicators and the lack of a definitive macro catalyst. This creates an environment ripe for volatility once a breakout occurs. Traders should remain vigilant, manage their risk exposure carefully, and wait for clear confirmation before entering significant positions. The market is building pressure, and while the immediate bias leans bearish, the potential for a bounce from oversold levels cannot be entirely dismissed. Patience and disciplined execution will be key in navigating these choppy waters.
Frequently Asked Questions: BTCUSD Analysis
What happens if BTCUSD breaks below the $68,010.67 support level?
A break below $68,010.67 on BTCUSD, especially with increasing volume and a rising ADX on shorter timeframes, would invalidate the neutral outlook and likely trigger further downside. This could lead to a test of the $67,056.33 support, with the potential for a move towards $65,867.67 if the bearish trend gains significant momentum.
Should I consider buying BTCUSD at current levels around $68,774 given the oversold RSI?
While the daily RSI is in oversold territory (45.11), the shorter-term bearish trend and macro headwinds suggest caution. A buy decision would be more prudent on a confirmed bounce above $69,345.67 or a clear daily trend reversal signal. Entering now carries a higher risk due to the prevailing downward pressure.
Is the daily ADX at 23.12 a sell signal for BTCUSD?
An ADX reading of 23.12 on the daily chart does not represent a sell signal itself; rather, it indicates a weak trend. This supports the current consolidation phase. A sell signal would be confirmed by a break of key support levels like $68,010.67, coupled with a rising ADX above 25, confirming a strong downtrend.
How will DXY strength around 99.25 affect BTCUSD's outlook this week?
The current strength of the US Dollar Index (DXY) at 99.25 generally acts as a headwind for Bitcoin. Persistent dollar strength, especially if accompanied by weakness in equity markets, increases the probability of further downside for BTCUSD, making a bullish breakout less likely without a significant shift in currency or risk sentiment.
Technical Outlook Summary
| Indicator | Value | Signal | Interpretation |
|---|---|---|---|
| RSI (14) | 45.11 | Neutral | No clear overbought or oversold conditions on daily chart. |
| MACD Histogram | -0.41 | Bearish | Negative momentum persists, indicating selling pressure. |
| Stochastic | 17.50 / 46.38 | Bullish Cross | Daily Stochastic shows a bullish cross in oversold territory, hinting at a potential bounce. |
| ADX | 23.12 | Weak Trend | Confirms the current consolidation phase, lacking strong directional conviction. |
| Bollinger Bands | Price below Middle Band | Bearish Bias | Suggests downward pressure, but room for bounce within range. |
Key Levels
Track markets in real-time
AI-powered analysis, technical indicators and real-time price data.
Join Our Telegram Channel
Breaking market news, AI analysis and trading signals instantly.
Join Channel