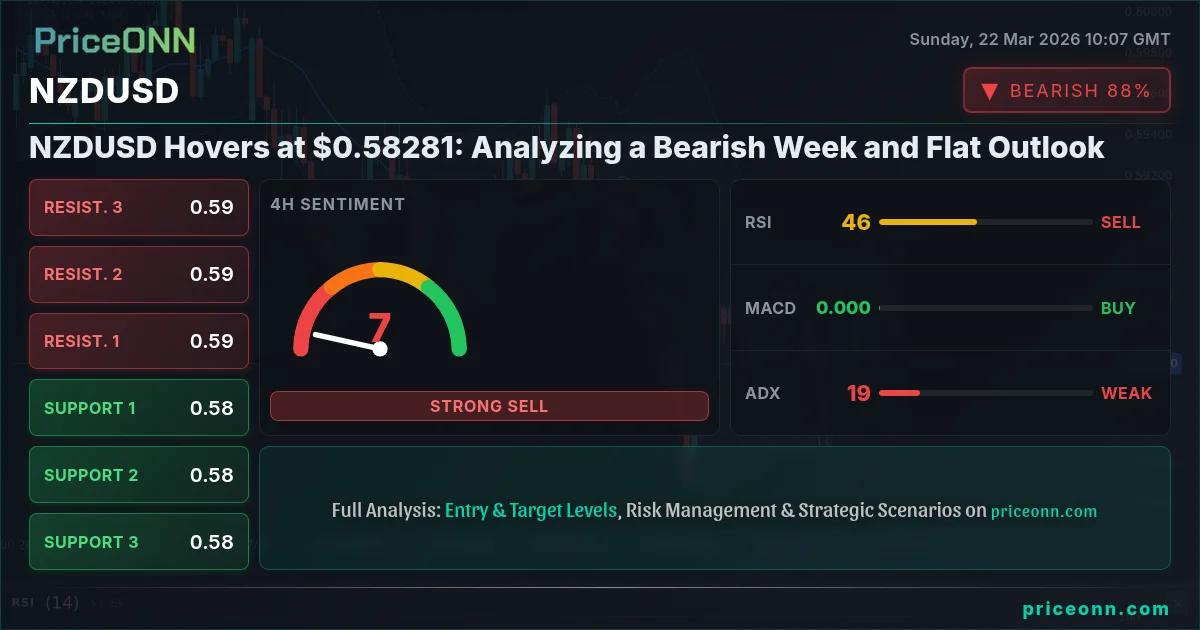
NZDUSD Hovers at $0.58281: Analyzing a Bearish Week and Flat Outlook
NZDUSD struggles near $0.58281 after a bearish week. Analysis of key levels, indicators, and upcoming events for a flat outlook.
The New Zealand Dollar (NZDUSD) finds itself at a critical juncture, currently trading at $0.58281 following a decidedly bearish week. This price point, hovering precariously near multi-month lows, encapsulates the indecision and conflicting signals plaguing the pair. Last Friday's close saw NZDUSD finish on a weak note, and the early sentiment heading into this new trading period suggests a continuation of this cautious, range-bound environment. The pair has been caught in a tug-of-war between a strengthening US Dollar, underpinned by robust economic data and hawkish Federal Reserve undertones, and the Kiwi's own domestic economic picture, which remains mixed. Understanding the interplay of these forces is paramount for navigating the potential price action in the coming days. We've seen significant volatility in the broader currency markets, with major indices like the S&P 500 and Nasdaq experiencing notable pullbacks, signaling a potential shift towards risk aversion. This global risk sentiment often dictates the fate of commodity-linked currencies like the NZD, making its correlation with risk assets and safe havens a key focus for traders.
- NZDUSD is trading at $0.58281, reflecting a bearish trend on the daily chart with an ADX of 18.55 indicating a choppy market.
- Critical support at $0.58055 has been tested, while resistance around $0.58640 capped recent upside attempts.
- The RSI(14) at 42.76 suggests a bearish bias on the 4H timeframe, with momentum indicators showing weakness.
- Geopolitical tensions and differing central bank policies (Fed vs. RBNZ) are key drivers influencing the NZDUSD's correlation with the DXY.
The Week That Was: Kiwi Under Pressure
Last week was undeniably challenging for the New Zealand Dollar. The pair experienced a notable decline, largely driven by a resurgent US Dollar and concerns over the global economic outlook. The DXY, or Dollar Index, continued its upward trajectory, reflecting a 'risk-off' sentiment in global markets. As the DXY climbed towards 99.25, it exerted downward pressure on most major currency pairs, including NZDUSD. This inverse correlation is a well-established pattern; when the dollar strengthens, assets priced in dollars, like commodities and other currencies, tend to become relatively cheaper and thus face selling pressure. Furthermore, the Federal Reserve's signals, even if hinting at a potential pause in aggressive rate hikes, maintained a hawkish undertone, supporting the dollar's strength. On the domestic front, while New Zealand's trade deficit narrowed to a more favorable level - a point that did provide some temporary respite for the Kiwi - it wasn't enough to counteract the broader USD strength and global risk aversion. Traders closely watched the figures, with the narrower deficit (a positive sign for the trade balance) momentarily pushing NZDUSD above 0.5850, as reported by PriceONN market news on March 20th. However, this upward momentum proved short-lived as the overarching bearish sentiment and the relentless march of the DXY reasserted control, pushing the pair back below key psychological levels.
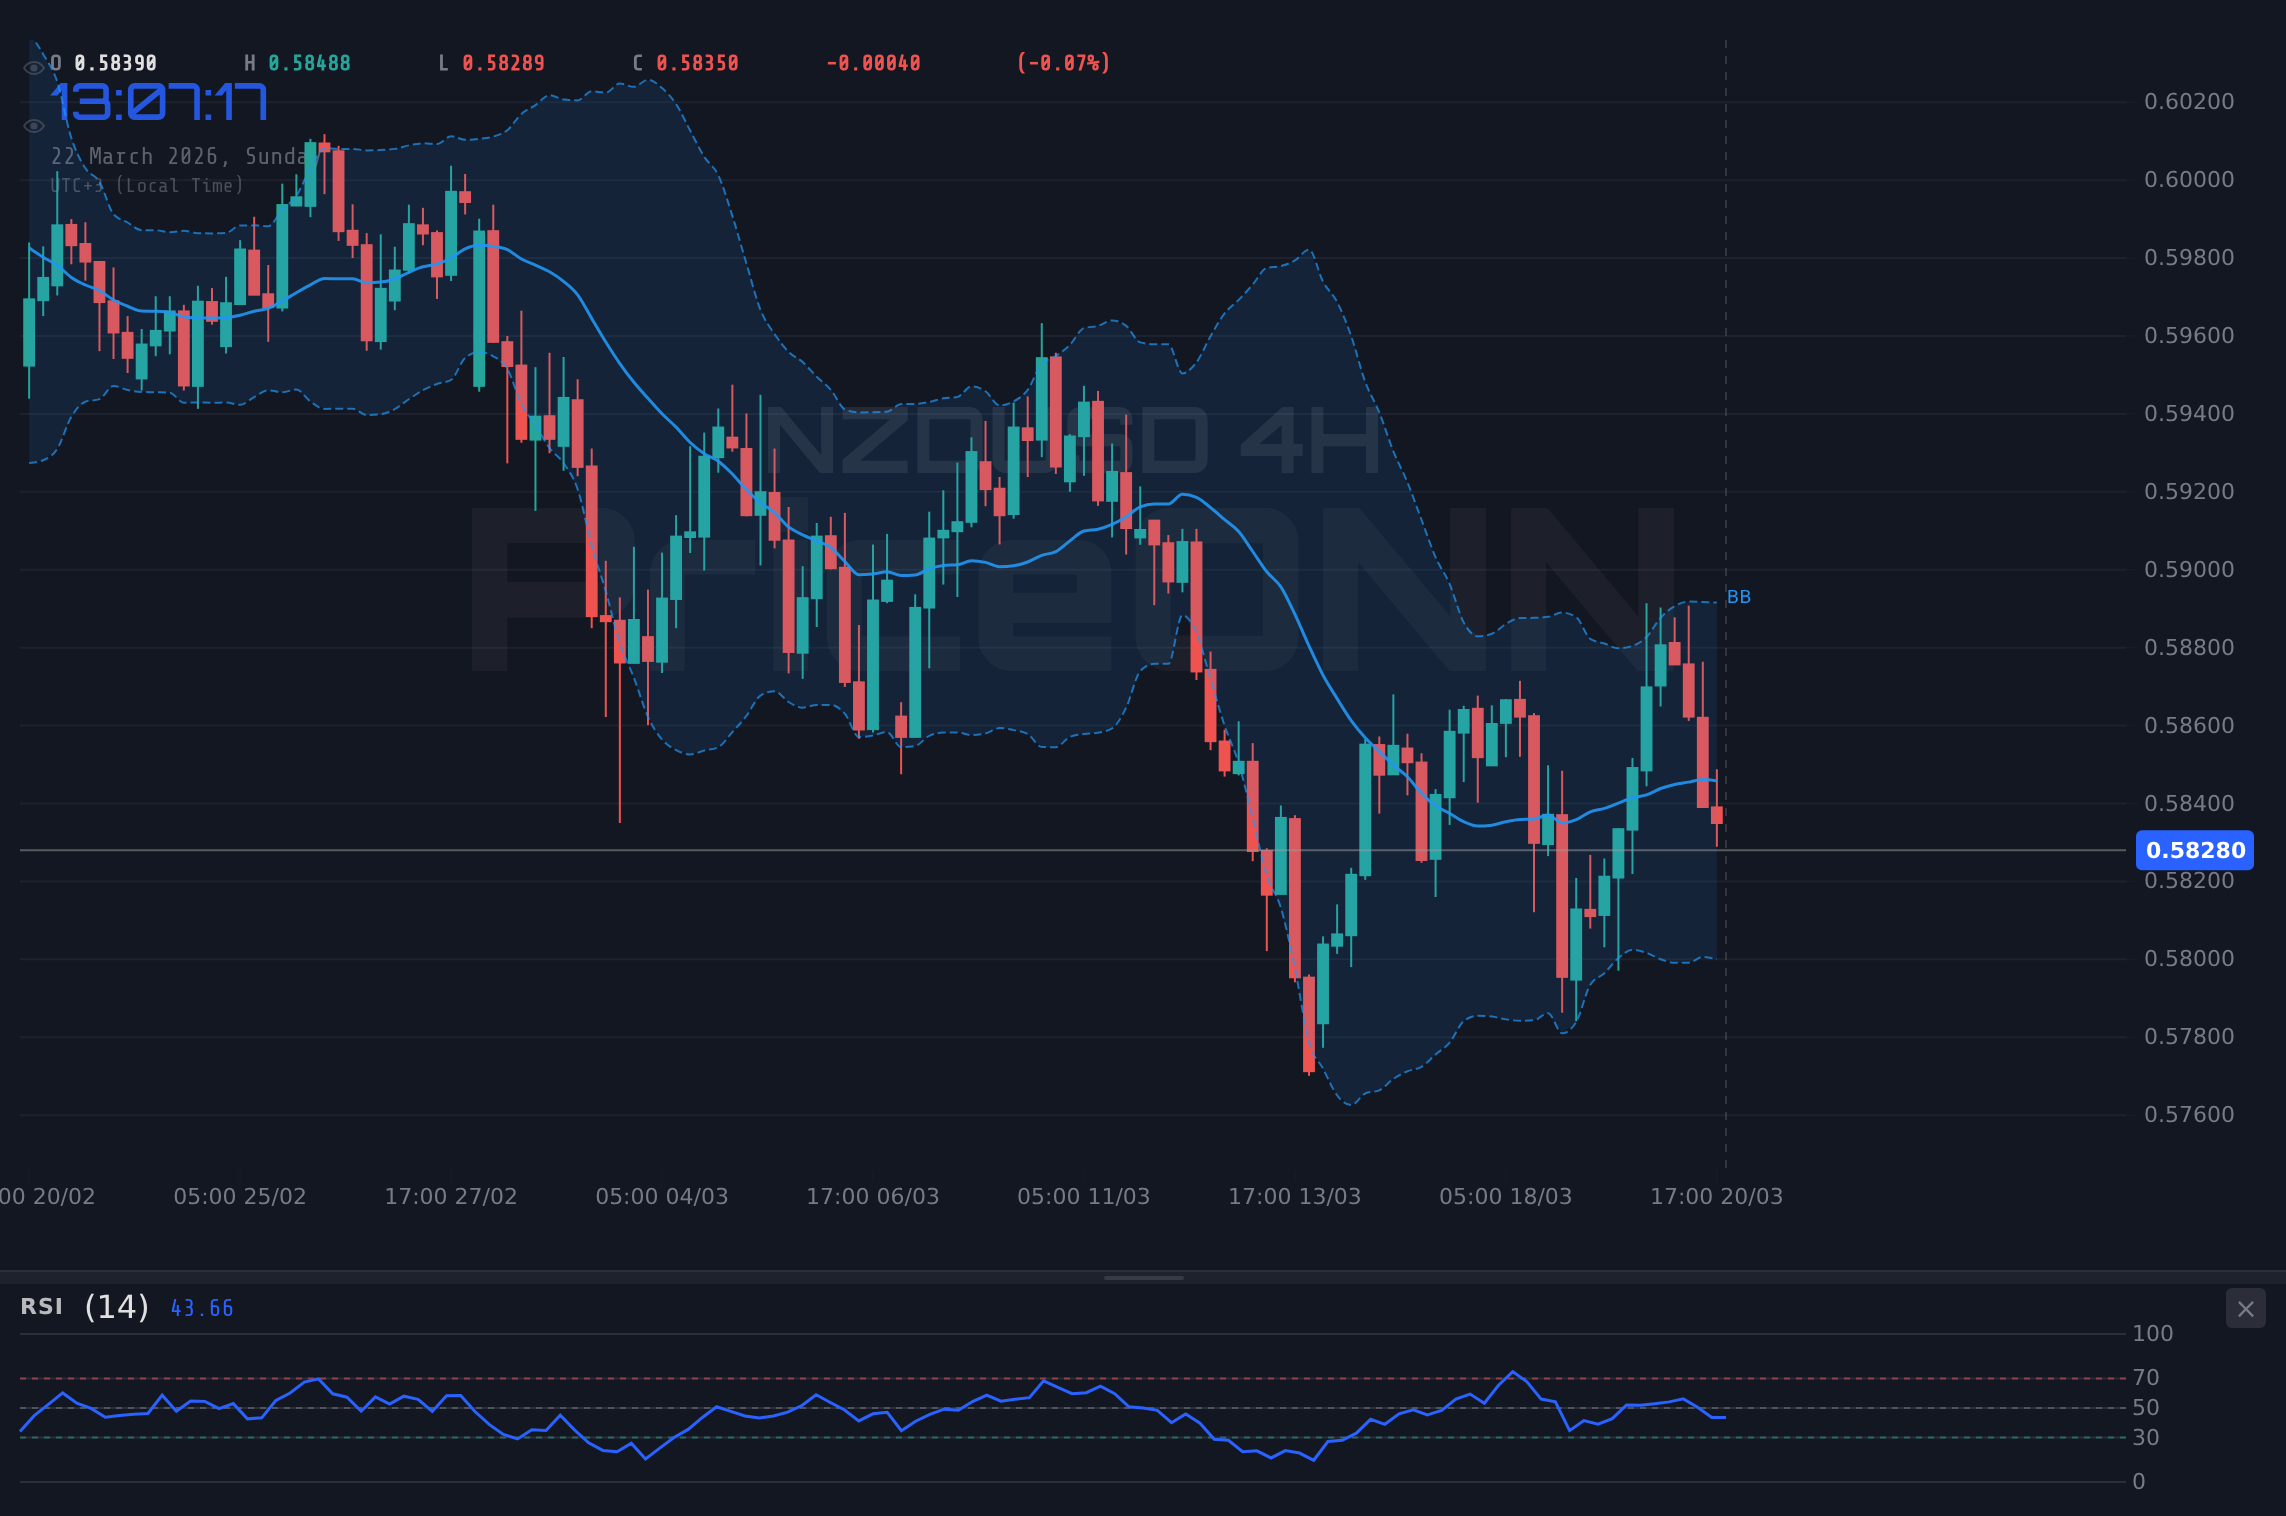
The technical picture painted a grim, albeit consolidating, scenario. On the 4-hour chart, the price action struggled to break above the middle Bollinger Band, which often acts as a dynamic resistance in downtrends. The ADX reading of 18.55 on this timeframe clearly signals a lack of strong directional momentum, suggesting that while the overall trend might be bearish, the market is currently in a choppy, range-bound state. This is the kind of environment where scalpers might find opportunities in short-term fluctuations, but swing and long-term traders need to exercise extreme caution. The Stochastic Oscillator was also flashing mixed signals, with %K dipping below %D, yet both remained in overbought territory, hinting at a potential reversal but lacking conviction. This technical indecision, coupled with the fundamental headwinds, created a complex trading landscape. The PriceONN news on March 17th highlighted this vulnerability, noting NZDUSD seemed weak around the mid-0.5800s and was trading below its 200-day SMA, a significant long-term technical indicator. This reinforces the narrative that while short-term bounces might occur, the larger trend remains under pressure.
The USD's Dominance: A Tale of Two Central Banks
The persistent strength of the US Dollar is not merely a function of global risk aversion; it's also deeply rooted in the divergence of monetary policy expectations between the Federal Reserve and the Reserve Bank of New Zealand (RBNZ). While the Fed, despite any recent dovish whispers, maintains a relatively firm stance, fueled by an economy that, while showing signs of cooling, is still resilient, the RBNZ faces a different set of challenges. The latest market data shows the DXY at 99.25, a level that signifies significant dollar strength against a basket of major currencies. This strength is particularly potent against currencies like the NZD, which are more sensitive to global risk sentiment and commodity prices. For NZDUSD, this means that any upside momentum is likely to face stiff resistance as long as the dollar maintains its upward bias. The 1H chart for DXY shows a bullish trend with 91% strength, with resistance at 99.31, 99.38, and 99.46. A break above these levels would further embolden dollar bulls and likely push NZDUSD lower. Conversely, the 4H DXY chart shows a more neutral, yet still upward-leaning, trend, with support at 99.08. Traders are keenly watching Fed speakers and economic data releases for any hint of a policy shift, but for now, the Fed's implicit higher-for-longer interest rate narrative provides a solid floor for the dollar.
In contrast, the RBNZ has been navigating a more complex domestic landscape. While inflation has shown signs of moderating, it remains a concern, and the central bank has been cautious about signaling any imminent pivot towards rate cuts. This ambiguity leaves the Kiwi vulnerable. The daily chart for NZDUSD shows a bearish trend with 90% strength, with support at $0.58055 and resistance at $0.58647. The RSI(14) at 44.34 on the daily chart suggests a bearish bias, indicating that sellers have more control than buyers. The MACD also remains in negative territory, below its signal line, reinforcing the bearish sentiment. This divergence in central bank outlooks creates a fundamental imbalance that favors the US Dollar. Even minor positive news for the New Zealand economy, such as the aforementioned narrower trade deficit, struggles to gain significant traction against the dominant USD narrative. The ADX on the daily chart, at 37.37, confirms a strong downtrend is in place, making any bullish attempts likely to be met with significant selling pressure as traders position themselves for a potentially stronger dollar in the near to medium term.
Technical Breakdown: Navigating the $0.58281 Level
The current price of $0.58281 for NZDUSD is more than just a number; it's a battleground where the bulls and bears are fighting for control. On the 1-hour chart, the trend is technically classified as neutral with 50% strength, but the immediate signals lean towards caution. The RSI(14) is at 42.76, indicating a slight bearish bias, and the MACD is firmly in negative territory, below its signal line. This suggests short-term momentum is lacking, and any upward moves might be met with profit-taking. The Stochastic Oscillator, with %K at 34.27 and %D at 42.76, also points to a bearish lean, with %K below %D, reinforcing the idea that immediate upside is limited. The ADX at 22.47 signifies a moderately trending market, but not one with overwhelming conviction. Support on this timeframe is identified at $0.58148, $0.58086, and $0.57971, while resistance lies at $0.58325, $0.58440, and $0.58502. A sustained break above the immediate resistance at $0.58325 could signal a short-term bullish reversal, but the higher timeframes suggest this would be against the prevailing trend.
Stepping back to the 4-hour timeframe, the picture becomes clearer and more concerning for Kiwi bulls. Here, the trend is also neutral, but the strength is leaning bearish (50%), with the ADX at 19.14 suggesting a range-bound environment rather than a strong trend. However, the indicators are leaning towards the downside. The RSI(14) is at 42.76, firmly in bearish territory, and the MACD is below its signal line, indicating bearish momentum. The Stochastic Oscillator, with %K at 43.72 and %D at 61.32, shows a clear bearish signal as %K is below %D and both are trending downwards. The immediate support levels to watch are $0.58268, $0.58116, and $0.57821, while resistance is capped around $0.58715, $0.59010, and $0.59162. A failure to hold the current price zone around $0.58281 could see a swift move towards the lower support levels. This is where swing traders will be looking for potential downside targets, while long-term investors might see this as an opportunity to enter at more attractive prices if fundamental conditions shift.
The daily chart provides the broadest perspective and confirms the overall bearish bias. The trend is considered bearish with 90% strength, and the ADX at 20.09 indicates a moderate trend, not yet a strong one, but certainly not a flat, directionless market. The RSI(14) is at 33.63, firmly in oversold territory, which, while indicating potential for a bounce, also reflects the significant selling pressure that has been in play. Historically, when RSI dips this low on the daily chart for NZDUSD, there has often been a period of consolidation or a sharp reversal. However, the current macroeconomic backdrop, with the DXY showing strength and the Fed's hawkish stance, suggests that this oversold condition might persist longer than usual. The MACD is deeply negative, below its signal line, and the histogram shows increasing bearish momentum. The key daily support levels are $0.58055, $0.57411, and $0.56982. Resistance is found at $0.58647, $0.59102, and $0.59545. A break below $0.58055 would be a significant bearish signal, potentially opening the door for a much larger move lower.
Correlations and Macro Drivers: What's Moving the Kiwi?
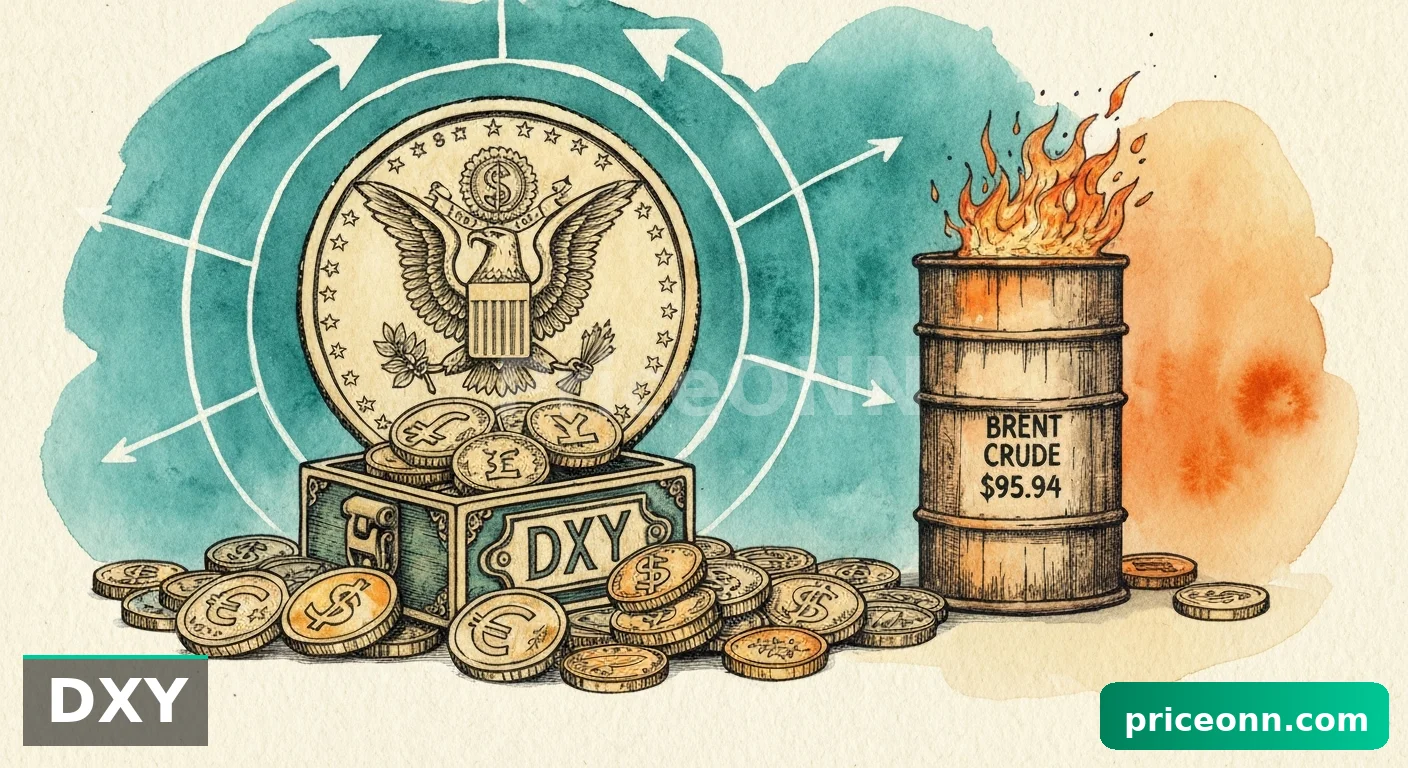
The NZDUSD's price action cannot be understood in isolation. Its movements are intricately linked to a web of global financial factors, most notably the US Dollar Index (DXY), equity market performance, and the price of oil. Currently, the DXY is trading at 99.25, showing a daily increase of 0.35%. This strengthening dollar acts as a significant headwind for NZDUSD. As mentioned, the 1D DXY chart shows a bullish trend (92% strength) with resistance at 99.72 and 100.54. If the dollar continues to appreciate, it will naturally exert more downward pressure on the Kiwi. This correlation is critical for short-term traders, as shifts in the DXY can often precede or confirm moves in NZDUSD. For instance, a sharp rise in the DXY towards its daily resistance levels would likely signal further downside for NZDUSD, potentially testing its support at $0.58055.
Equity markets also play a crucial role, acting as a barometer for global risk appetite. The S&P 500 is currently trading at 6536.67, down 1.2% for the day, and the Nasdaq is at 23986.8, down 1.67%. This broad-based decline in major US indices suggests a shift towards risk aversion. In such an environment, investors often flee riskier assets and seek the safety of traditional safe havens, which can include the US dollar, but sometimes also gold and other perceived stable assets, though the correlation isn't always straightforward. A sustained sell-off in equities would typically weigh on commodity-linked currencies like the NZD. The 1H chart for the S&P 500 shows a bearish trend (94% strength) with resistance at 6531.7 and 6557.2. A break below the S&P 500's 1H support at 6491.3 could further confirm the risk-off sentiment and add to the bearish pressure on NZDUSD. This interconnectedness means that traders must monitor not just currency pairs but also the broader market sentiment reflected in stock indices.
Energy prices, particularly oil, serve as another important barometer, influencing inflation expectations and geopolitical risk sentiment. Brent crude is trading at $112.54, up 4.58% for the day, and WTI is at $98.39, up 3.76%. This sharp rise in oil prices, potentially linked to geopolitical events like the reported attack on Qatar's Ras Laffan energy hub (mentioned in the news feed), adds another layer of complexity. Higher oil prices can fuel inflation concerns, which might prompt central banks like the Fed to maintain a tighter monetary policy, further supporting the dollar. However, for commodity-linked currencies like the NZD, rising oil prices can sometimes be supportive if they signal strong global demand. The current situation, where oil is rising amid risk aversion and a strong dollar, suggests that the inflation channel might be dominant, indirectly benefiting the USD at the expense of NZDUSD. The daily chart for Brent shows a strong bullish trend (100% strength) with RSI at 82.44, indicating extreme overbought conditions that could signal a potential pullback in oil prices, which might, in turn, ease some inflationary pressure and offer slight relief to riskier assets.
Market Scenarios: Navigating the Uncertainty
Given the current technical and fundamental backdrop, several scenarios are plausible for NZDUSD. The prevailing sentiment points towards a bearish bias, but the lack of strong directional momentum on shorter timeframes suggests a period of consolidation or choppy trading is also likely. The key is to identify the triggers and invalidation levels for each scenario.
Bearish Continuation: The Path of Least Resistance
65% ProbabilityConsolidation: The Waiting Game
25% ProbabilityShort-Term Rebound: A Glimmer of Hope?
10% ProbabilityThe most probable scenario, given the current data, is a bearish continuation. The strong daily trend, negative indicator readings across multiple timeframes, and the overarching strength of the US Dollar all point towards further downside potential. The ADX readings, particularly the strong 37.37 on the daily and 36.09 on the 1H, suggest that the downward momentum, while perhaps choppy, is significant. The fact that the RSI is oversold on the daily chart adds a caveat; a bounce is possible, but it's unlikely to be sustained without a fundamental shift or a significant change in risk sentiment. The consolidation scenario is also highly plausible, especially in the short term, as the market digests recent moves and waits for clearer direction from upcoming economic data and central bank commentary. The bullish scenario remains the least likely, requiring a substantial catalyst, such as a dovish surprise from the Fed or a significant geopolitical de-escalation, which does not appear imminent.
What to Watch This Week: Key Triggers for NZDUSD
As we move into the new trading week, several factors will be critical in determining the direction of NZDUSD. Firstly, the continued strength of the DXY remains paramount. Any signs of weakness in the dollar index, such as a break below its 1H support at 99.15, could offer temporary relief to NZDUSD. However, given the Fed's hawkish undertones, sustained dollar weakness seems unlikely in the immediate term. Secondly, traders will be closely monitoring any new developments in geopolitical tensions, particularly those impacting energy prices. A significant escalation could further boost the dollar as a safe haven, while de-escalation might reduce risk aversion and potentially benefit the Kiwi. The PriceONN news feed highlighted the impact of events like the Ras Laffan attack on energy markets; similar geopolitical events could ripple through currency markets.
On the domestic front, attention will be on any forward guidance from the Reserve Bank of New Zealand (RBNZ). While no major policy meetings are scheduled imminently, any speeches or statements from RBNZ officials could influence Kiwi sentiment. Traders will be looking for clues about future monetary policy, particularly regarding inflation and interest rates. Any hint of a more dovish stance could weigh on the NZD, while a more hawkish tone might provide some support, although it would need to be substantial to overcome the USD strength. Finally, the technical levels themselves will act as triggers. A decisive break below the $0.58055 support level on the daily chart would likely confirm the bearish scenario and open the door for further declines towards $0.57411 and $0.56982. Conversely, a strong break above the $0.58647 resistance, coupled with positive news flow, could signal the start of a short-term correction, targeting $0.59010.
Frequently Asked Questions: NZDUSD Analysis
What happens if NZDUSD breaks below the $0.58055 support level this week?
A break and sustained hold below the $0.58055 support level on the daily chart would likely confirm the bearish scenario. This would signal further downside potential, with the next key targets being $0.57411 and potentially $0.56982. This move would be driven by continued USD strength and risk-off sentiment.
Should traders consider buying NZDUSD at the current $0.58281 level, given the oversold RSI on the daily chart?
Buying NZDUSD solely based on the daily RSI being oversold at 33.63 would be risky. While it indicates potential for a bounce, the bearish trend on higher timeframes and strong DXY suggest any rally might be short-lived. A more prudent approach would be to wait for confirmation, such as a break above $0.58647 resistance, or a clear shift in fundamental drivers.
Is the ADX reading of 18.55 on the 4H chart a sign of a potential trend reversal for NZDUSD?
An ADX reading of 18.55 typically indicates a weak or ranging market, rather than an imminent trend reversal. While it suggests momentum is lacking for a strong directional move, it doesn't negate the existing bearish bias seen in other indicators like RSI and MACD on higher timeframes. This level often precedes periods of consolidation or choppy price action.
How will upcoming US Non-Farm Payrolls (NFP) data potentially affect NZDUSD next week?
Stronger-than-expected NFP data would likely reinforce the Fed's hawkish stance, boosting the DXY and putting further downward pressure on NZDUSD. Conversely, weaker NFP figures could lead to a dollar pullback and a potential short-covering rally in NZDUSD, though its extent would depend on the broader market sentiment and RBNZ outlook.
Technical Outlook Summary
| Indicator | Value | Signal | Interpretation |
|---|---|---|---|
| RSI (14) | 42.76 | Bearish | Suggests downward momentum on 4H, neutral on 1D. |
| MACD | Negative | Bearish | Below signal line on multiple timeframes, indicating bearish momentum. |
| Stochastic | %K: 34.27, %D: 42.76 | Bearish | %K below %D on 1H, pointing to further downside. |
| ADX | 19.14 | Weak Trend | Suggests a ranging or choppy market on 4H, not strong trending. |
| Bollinger Bands | Middle Band Break | Bearish | Price is below the middle band on 4H, indicating bearish pressure. |
Track markets in real-time
AI-powered analysis, technical indicators and real-time price data.
Join Our Telegram Channel
Breaking market news, AI analysis and trading signals instantly.
Join Channel