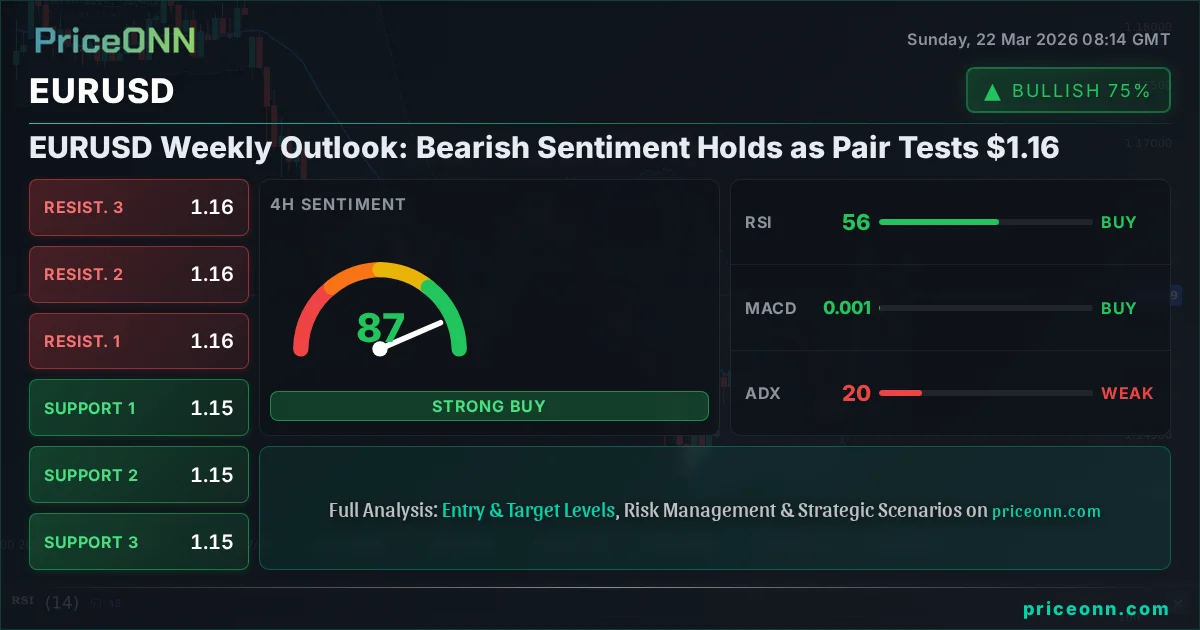
EURUSD Weekly Outlook: Bearish Sentiment Holds as Pair Tests $1.16
EURUSD faces a bearish outlook as the pair hovers around $1.16. Key technical levels and macro factors suggest continued pressure, with traders watching for potential breakdowns.
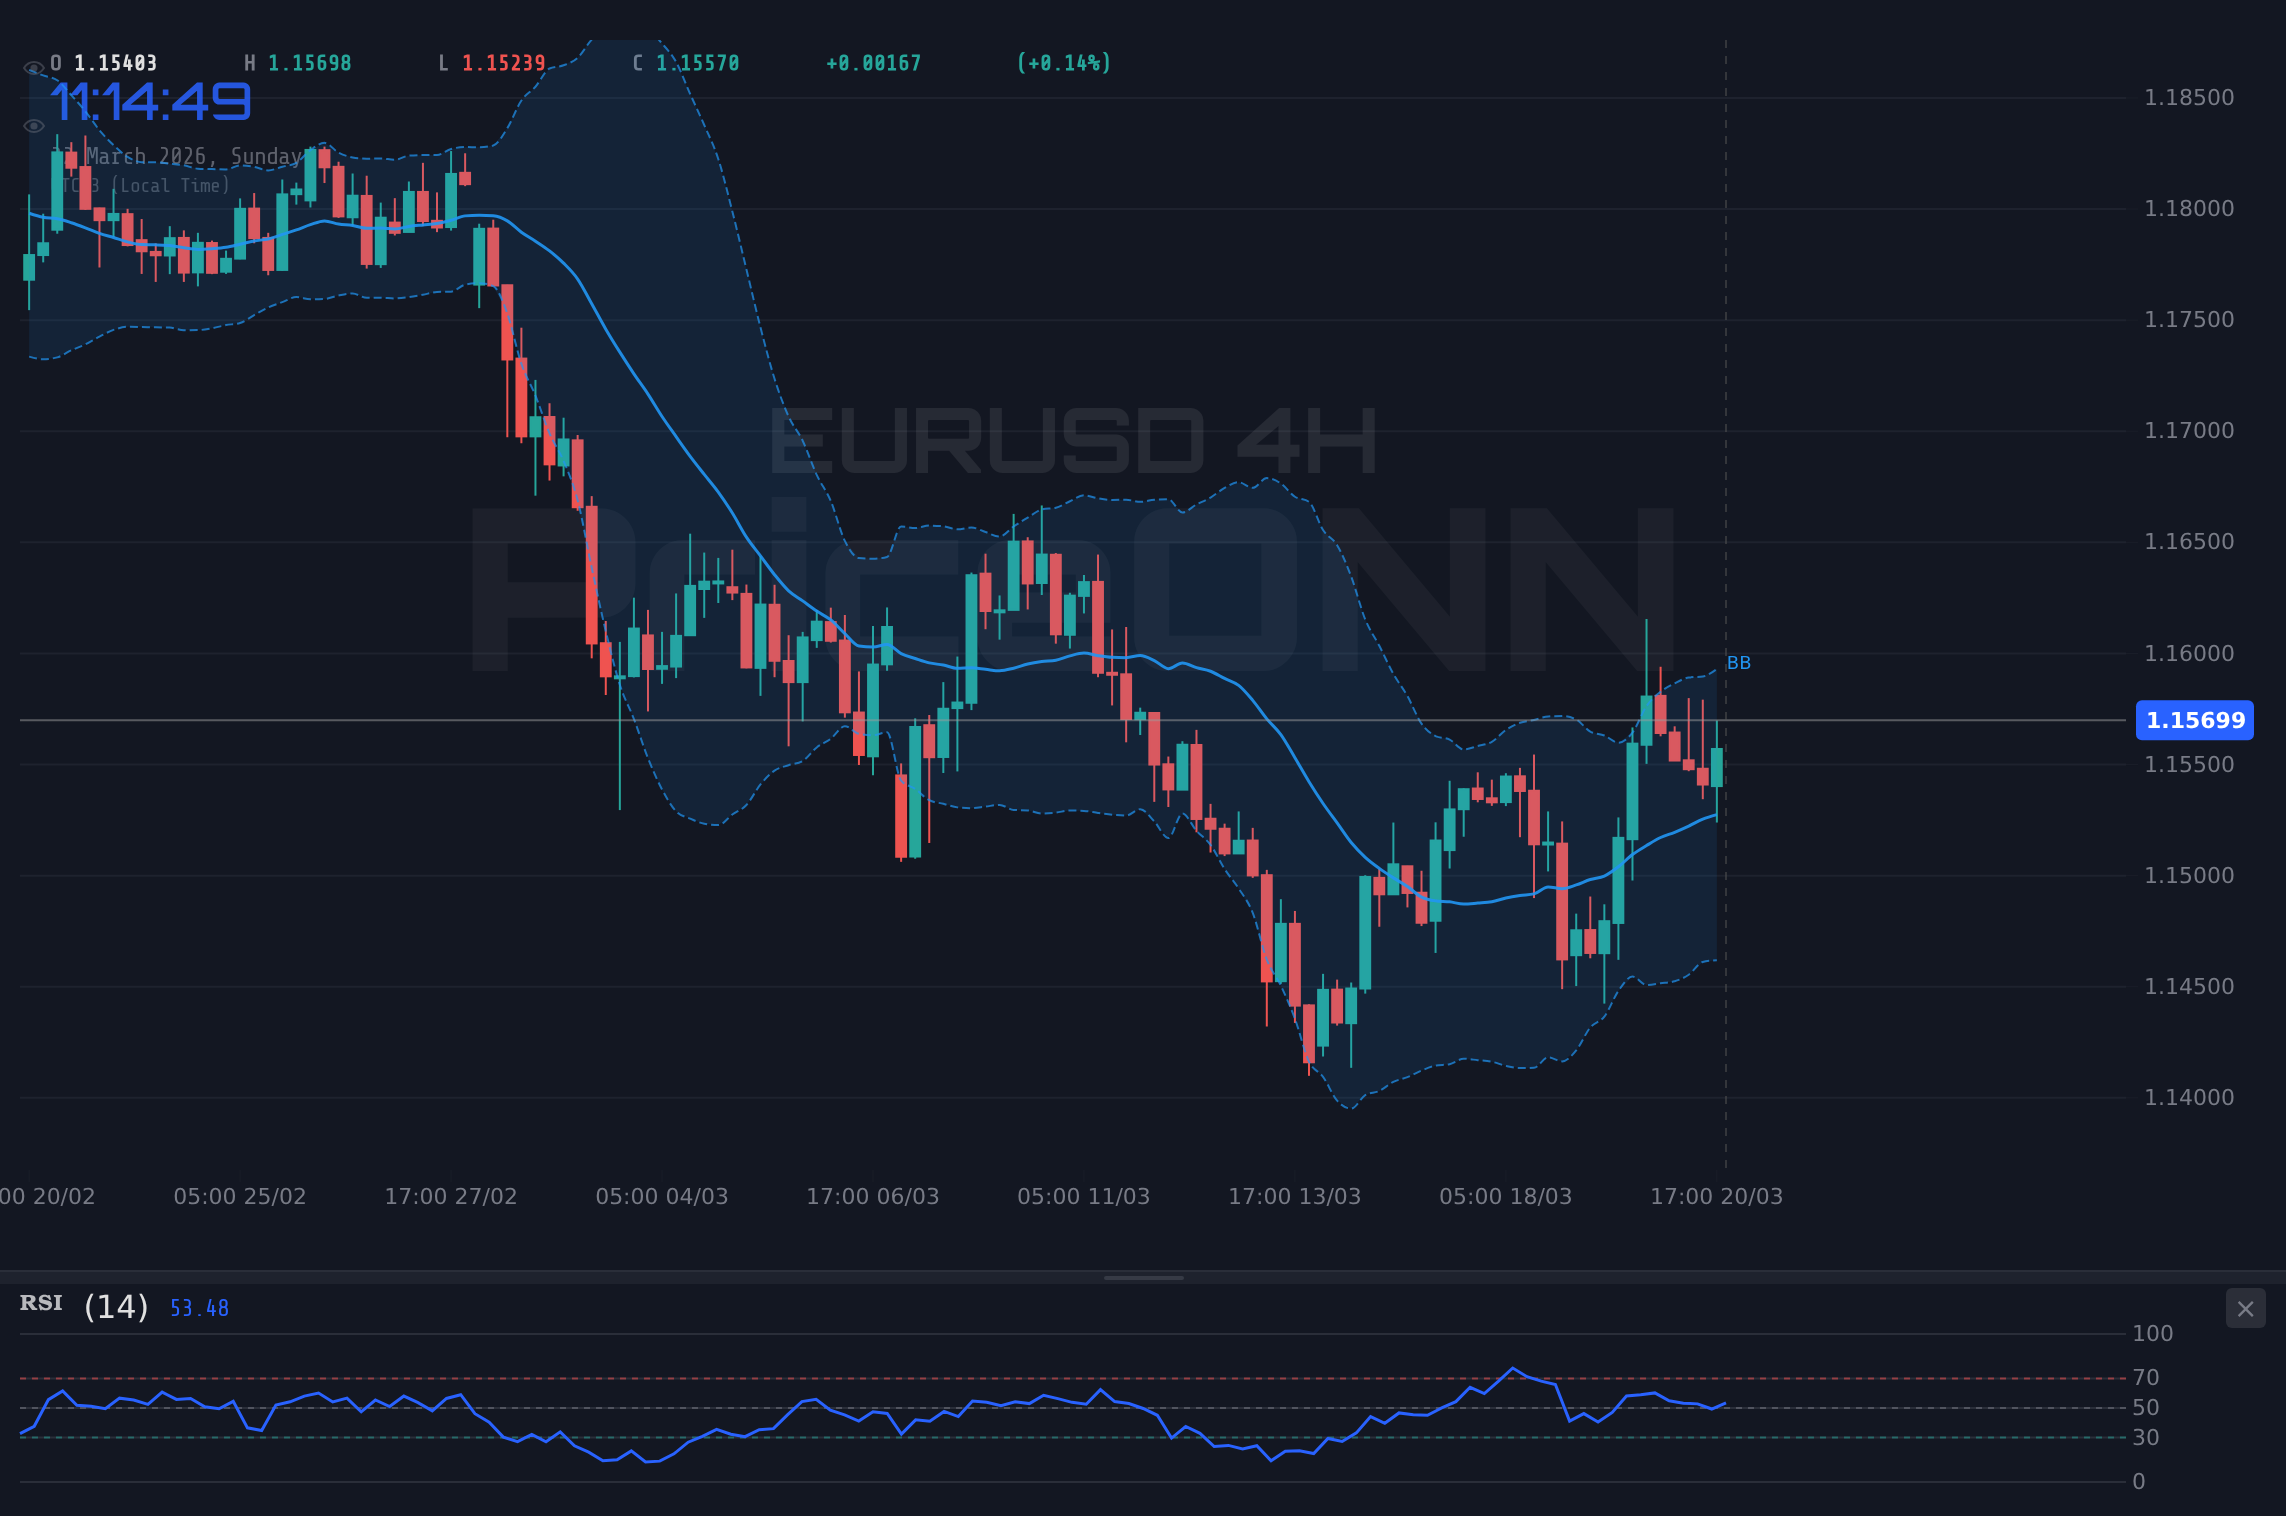
The EURUSD pair concluded last week trading near the critical $1.16 mark, a level that has become a focal point for market participants. Following a predominantly bearish week, the outlook remains cautious, with technical indicators and macroeconomic undercurrents suggesting further consolidation or potential downside. Last Friday, the pair closed the week around $1.157, reflecting a week characterized by muted volatility but a clear downward bias. This movement occurred amidst a backdrop of shifting central bank expectations and ongoing geopolitical tensions, both of which continue to influence currency markets. Traders are now keenly observing whether the $1.16 psychological level can hold as support or if the prevailing bearish sentiment will force a decisive break below it. The interplay between the US Dollar's strength, driven by Federal Reserve policy signals, and the Eurozone's economic trajectory will be crucial in dictating the pair's next significant move. This analysis delves into the technical landscape, fundamental drivers, and potential scenarios shaping the EURUSD's path forward.
- EURUSD closed last week near $1.157, with the $1.16 level acting as a key psychological pivot.
- The 1-Day RSI stands at 44.34, indicating a bearish trend with room for further downside before oversold conditions appear.
- Critical support for EURUSD is identified at $1.15239, while resistance looms around $1.15687 on the 4-hour chart.
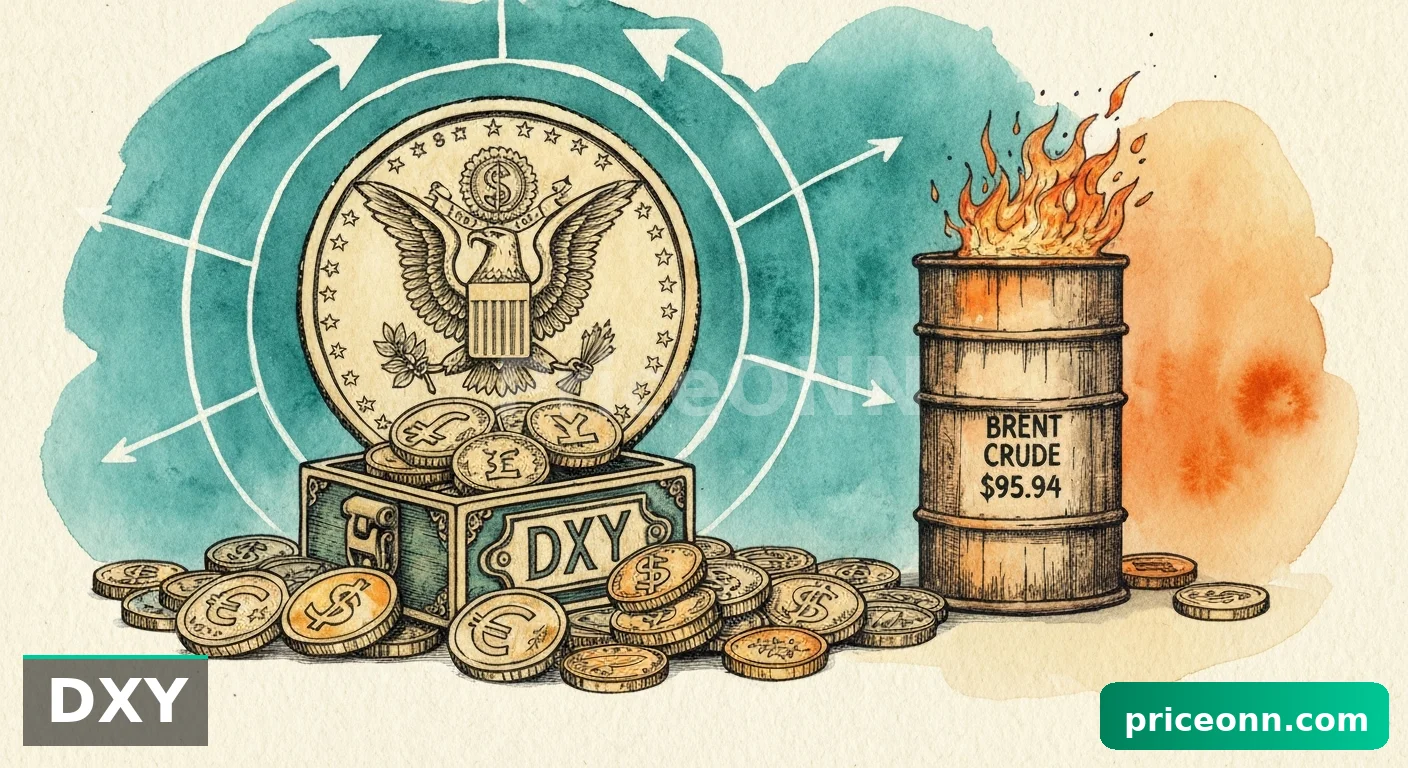
- The strengthening US Dollar Index (DXY), currently at 99.25, is exerting pressure on the Euro, correlating with risk-off sentiment.
The Bear's Grip: Analyzing Last Week's Price Action
Last week was a testament to the prevailing bearish undertones for the EURUSD. The pair experienced a net decline, closing slightly lower than where it started, despite some intraday fluctuations. This downward trajectory was largely influenced by a combination of factors, including the persistent strength of the US dollar and a cautious approach from European policymakers regarding economic growth prospects. The $1.15239 support level on the 4-hour chart was tested, but not decisively broken, indicating a degree of resilience, albeit fragile. However, the daily chart paints a more concerning picture, with the trend firmly established in the bearish camp and the RSI(14) at 44.34 suggesting ample room for further depreciation before oversold conditions are met. This technical setup implies that any rallies are likely to be met with selling pressure, especially as the pair approaches the $1.15687 resistance level.
The ADX indicator on the daily timeframe, reading 37.37, confirms a strong bearish trend is in play. This suggests that momentum is firmly with the sellers, and any attempts by the bulls to reverse the trend will require significant conviction and volume. The MACD also remains below its signal line, reinforcing the bearish momentum. While the Stochastic Oscillator on the daily chart shows %K (49.67) above %D (30.17), suggesting a potential short-term bounce, this signal is weak against the backdrop of the overwhelming bearish trend indicators. The 1-hour chart, however, shows a stronger bullish trend (87% strength) with RSI at 53.72, hinting at short-term counter-trend moves or pullbacks that could offer tactical trading opportunities for nimble traders, but these are unlikely to alter the broader bearish thesis without a decisive break of key resistance levels.
The interplay between these different timeframes creates a complex picture. While the short-term charts might offer fleeting bullish signals, the longer-term daily trend remains undeniably bearish. This divergence highlights the importance of a multi-timeframe approach. For instance, a trader looking for a short opportunity might wait for the 1-hour chart to align with the daily trend, perhaps after a failed rally towards the $1.15647 resistance. Conversely, a scalper might try to capture small gains on intraday bounces from support levels like $1.15409, always with a tight stop-loss in place, aware that the larger trend is against them. The overall market sentiment, heavily influenced by the DXY's trajectory, will likely dictate which timeframe's signals ultimately prevail.
The strengthening US Dollar Index (DXY), currently at 99.25, is a significant headwind for EURUSD. This dollar strength, driven by expectations around Federal Reserve policy and global risk sentiment, directly correlates with the downward pressure on the Euro.
The Dollar's Dominance: Fed Signals and DXY Strength
The US Dollar Index (DXY) has been a dominant force in the currency markets, and its recent performance around 99.25 underscores its strength. This upward momentum is intrinsically linked to expectations surrounding the Federal Reserve's monetary policy path. While inflation remains a concern, the Fed's current stance, as interpreted by market participants, suggests a measured approach to rate cuts, if any, in the near term. This divergence in policy expectations compared to other major central banks, particularly the European Central Bank (ECB), provides a fundamental tailwind for the dollar.
The DXY's climb is putting significant pressure on currency pairs like EURUSD. When the dollar strengthens, it naturally makes the Euro more expensive for holders of other currencies, thus driving down the EURUSD exchange rate. This inverse correlation is a well-established market dynamic. The current reading of the DXY at 99.25, with a daily trend strength of 92% on the 1-day chart, indicates strong underlying upward momentum. The resistance levels for the DXY at 99.43, 99.55, and 99.79 are key targets that, if breached, could further exacerbate the weakness in EURUSD. Conversely, a pullback in the DXY towards its support levels around 99.08 or 98.84 could offer temporary respite for the Euro.
Furthermore, global risk appetite plays a crucial role. During periods of heightened uncertainty or 'risk-off' sentiment, investors often flock to the perceived safety of the US dollar. This dynamic was evident last week, as geopolitical tensions and concerns about global economic growth contributed to a stronger dollar. The S&P 500's decline to 6536.67 and the Nasdaq 100's fall to 23986.8 reflect this risk-averse mood. As long as this sentiment persists, the dollar is likely to find support, acting as a drag on the EURUSD pair. The Federal Reserve's upcoming statements and economic data releases will be critical in shaping both the dollar's trajectory and the broader market's risk sentiment, directly impacting the EURUSD pair's outlook.
The market is pricing in a more hawkish stance from the Federal Reserve compared to the ECB. This policy divergence is a primary driver of the US dollar's strength and, consequently, the bearish pressure on EURUSD.
The Eurozone's Economic Tightrope Walk
While the US dollar benefits from Fed policy expectations, the Eurozone's economic landscape presents a more complex and, at times, challenging picture. Recent data from the region has been mixed, creating uncertainty about the pace of economic recovery. Inflationary pressures, while easing in some areas, remain a concern for the European Central Bank (ECB), balancing the need to control prices against the risk of stifling growth with overly restrictive monetary policy.
The ECB's current stance appears more dovish than the Fed's, which is a significant factor contributing to the EURUSD's bearish trend. If the ECB signals a greater willingness to cut interest rates or adopts a more accommodative tone, it could further widen the interest rate differential with the US, putting additional downward pressure on the Euro. This is particularly relevant for carry trade strategies, where the yield differential is a key component. The current interest rate environment, coupled with mixed economic data, creates a scenario where investors might be hesitant to commit heavily to Euro-denominated assets, favouring the higher yields and perceived stability offered by the US dollar.
Geopolitical events, particularly those affecting energy supplies and trade routes, also cast a long shadow over the Eurozone's economic outlook. For instance, recent energy market disruptions, such as the attack on Qatar's Ras Laffan energy hub, highlight the fragility of global energy supplies. While this might indirectly support commodity prices and inflation globally, its impact on the energy-dependent European economy could be more pronounced, potentially leading to renewed inflationary concerns or supply chain disruptions. The market is closely watching how the ECB interprets these evolving risks and how they factor into its future monetary policy decisions. The absence of clear hawkish signals from the ECB, contrasted with the Fed's cautious but firm stance, remains a key bearish fundamental for the EURUSD pair.
Key upcoming economic data from the Eurozone, such as inflation figures and PMI surveys, will be crucial in determining the ECB's next policy moves and will likely influence EURUSD direction.
Navigating the Levels: Key Support and Resistance for EURUSD
From a technical perspective, the EURUSD pair is currently navigating a crucial juncture, with specific price levels dictating the short-to-medium term outlook. On the 4-hour chart, the immediate support lies at $1.15239. A decisive break and sustained move below this level would confirm the bearish bias and potentially open the door for a move towards the next support at $1.15067. This area has acted as a floor multiple times, and its breach would signal a significant shift in market sentiment. Conversely, immediate resistance is observed at $1.15687. A strong push above this level, supported by robust volume and positive market news, could trigger a short-covering rally. However, the daily chart presents a much wider range, with significant support identified at $1.14768 and a more substantial barrier at $1.13731. Resistance on the daily scale is formidable, with the first key level at $1.16499, followed by $1.17193. Breaking through these upper levels would require a substantial change in fundamental drivers, such as a significant dovish pivot from the Fed or a sharp deterioration in US economic data.
The 1-hour chart offers a more granular view, with support at $1.15409 and resistance at $1.15647. These levels are more relevant for intraday traders looking to capitalize on short-term volatility. A move towards $1.15647 could see some profit-taking, while a dip to $1.15409 might attract tactical buyers looking for quick gains. However, the overarching trend indicated by the daily and 4-hour ADX values (37.37 and 19.77 respectively) suggests that these shorter-term fluctuations are unlikely to alter the broader bearish narrative without confirmation from higher timeframes.
Understanding these levels is paramount for risk management. Traders should define their strategies based on whether these levels are expected to hold or break. For instance, a bearish strategy might involve waiting for a confirmed break below $1.15239, with a target set towards $1.14768. A bullish strategy, which currently appears less probable given the data, would require a strong daily close above $1.16499, invalidating the bearish setup and opening potential for a move towards higher resistance levels. The confluence of technical indicators across different timeframes, particularly the bearish signals on the daily chart, suggests that the path of least resistance remains to the downside, making breaks of support more probable than sustained rallies above key resistance.
The Trade Plan: Navigating EURUSD's Path Forward
Given the current technical and fundamental landscape, the most probable scenario for EURUSD involves continued bearish pressure, though short-term fluctuations and potential range-bound trading cannot be discounted. The prevailing trend on the daily chart, supported by indicators like RSI at 44.34 and ADX at 37.37, strongly suggests that downside risks are elevated. The key level to watch remains $1.15239 on the downside and $1.15687 on the upside for the 4-hour timeframe. A decisive break below $1.15239 would likely trigger a move towards $1.14768, aligning with the bearish thesis. Conversely, a sustained push above $1.15687, particularly a daily close above it, would signal a potential invalidation of the bearish setup and could lead to a retest of higher resistance levels, though this appears less likely in the immediate term without a significant shift in macro drivers.
The 1-hour chart, with its stronger bullish trend signals (RSI 53.72, ADX 23.85), might offer opportunities for tactical entries on pullbacks towards support, but these should be treated as counter-trend trades with tight risk management. The Stochastic Oscillator on the 1-hour chart, showing %K above %D, supports this short-term bullish bias, but it needs to be viewed within the context of the dominant daily bearish trend. The ADX at 19.77 on the 4-hour chart indicates a weak trend, suggesting that the market might be consolidating before the next major move. This reinforces the idea that while a break below support seems more probable, a period of ranging could precede it.
For traders, the strategy should revolve around risk management and waiting for clear signals. A confirmed break below $1.15239 on the 4-hour chart would be a strong bearish signal, potentially initiating a short position with targets around $1.14768. The invalidation for this trade would be a close back above $1.15687. On the other hand, a bullish scenario would require a daily close above $1.16499, which would significantly alter the outlook and suggest a potential move towards $1.17193. However, given the current data, this scenario carries a lower probability. A neutral scenario could play out if the pair remains range-bound between $1.15239 and $1.15687, characterized by choppy price action and conflicting indicator signals, especially on the shorter timeframes. Patience will be key this week, allowing the market to provide clearer direction.
Bearish Scenario: Downside Pressure Mounts
65% ProbabilityNeutral Scenario: Range-Bound Consolidation
25% ProbabilityBullish Scenario: Rebound Potential Limited
10% ProbabilityWhat I'm Watching This Week
This week, the focus for EURUSD will be on several key triggers that could dictate its short-to-medium term direction. Firstly, the 4-hour close relative to the $1.15239 support level is paramount. A decisive break below this level would confirm the bearish scenario and likely accelerate downward momentum. Secondly, I'll be watching for any sustained move above the $1.15687 resistance, particularly on the daily chart. While a significant rally seems unlikely without a fundamental catalyst, a strong close above this level would signal a potential shift in sentiment and invalidate the immediate bearish outlook. Lastly, market sentiment towards the US dollar, as indicated by the DXY's trajectory and the Fed's communication, will remain a critical overarching factor. Any hints of a more dovish Fed policy or a significant drop in the DXY could provide a much-needed boost for the Euro.
The interplay of these technical levels and macroeconomic drivers will shape the narrative. Traders should remain vigilant, employing strict risk management protocols, especially given the current choppy conditions indicated by the ADX readings on shorter timeframes. The underlying bearish trend on the daily chart suggests that opportunities may lie on the short side, provided the right triggers emerge. However, the possibility of a consolidation phase between the key support and resistance levels cannot be ruled out, making a patient approach essential.
Focus on the daily close for confirmation. Short-term fluctuations on the 1-hour chart can be misleading; wait for higher timeframe confirmation, especially a break of $1.15239 or a sustained push above $1.15687.
EURUSD Today Analysis: Key Levels and Macro Influences
The EURUSD pair's current trading range around $1.16 is a critical juncture, shaped by a confluence of technical patterns and macroeconomic factors. The prevailing bearish sentiment, supported by a daily RSI of 44.34 and a strong ADX of 37.37, suggests that downside risks remain elevated. The US Dollar Index (DXY) at 99.25 continues to exert pressure, reflecting expectations of a more hawkish Federal Reserve compared to the European Central Bank. This policy divergence is a key driver of the current trend.
Technically, the pair is consolidating near the $1.157 level. The immediate support to watch is $1.15239 on the 4-hour chart. A break below this level would likely trigger further selling pressure, targeting $1.14768. Resistance is capped around $1.15687. A daily close above this level would be required to challenge the bearish outlook. The market sentiment remains cautious, with major indices like the S&P 500 trading lower, reinforcing the demand for safe-haven assets like the US dollar. Upcoming economic data from both the US and the Eurozone will be crucial in providing fresh impetus and potentially breaking the current stalemate.
The EURUSD price forecast for the coming week hinges on whether the bearish trend can resume or if consolidation continues. Given the strong technical signals favouring the downside and the fundamental support for the dollar, the path of least resistance appears to be lower. Traders are advised to look for shorting opportunities on rallies towards resistance levels, with clear stop-losses placed above key technical barriers. Patience and discipline are essential in navigating this environment, waiting for clear confirmation signals before committing to positions.
| Indicator | Value | Signal | Interpretation |
|---|---|---|---|
| RSI (14) | 44.34 | Bearish | Further downside possible, not yet oversold |
| MACD Histogram | -0.00106 | Bearish | Negative momentum persists |
| Stochastic (%K) | 49.67 | Neutral | Near mid-range, awaiting direction |
| ADX | 37.37 | Strong Trend | Confirms a strong bearish trend on daily |
| Bollinger Bands | Below Middle Band | Bearish | Price below middle band indicates bearish bias |
Frequently Asked Questions: EURUSD Analysis
What happens if EURUSD breaks below $1.15239 support?
A confirmed break below the $1.15239 support level on the 4-hour chart would likely trigger further selling pressure, confirming the bearish trend. This could lead to a move towards the next significant support at $1.14768, aligning with the prevailing market sentiment.
Should I consider buying EURUSD at current levels near $1.157 given the RSI is 44.34?
Buying at current levels near $1.157 is not recommended given the RSI of 44.34, which indicates room for further downside on the daily chart. A more prudent approach would be to wait for a clear bullish signal, such as a daily close above $1.15687, or a confirmed bounce from a more significant support level like $1.14768, though this is a lower probability scenario.
Is the MACD histogram reading of -0.00106 a strong sell signal for EURUSD?
The MACD histogram reading of -0.00106, being negative and below the signal line, reinforces the bearish momentum on the daily chart. While it indicates selling pressure, it should be considered alongside other indicators like RSI and ADX for confirmation before making a trading decision.
How will upcoming Fed statements affect EURUSD this week, given the DXY is at 99.25?
Upcoming Fed statements will be critical. If the Fed signals a more hawkish stance or fewer rate cuts than anticipated, it would likely strengthen the DXY further from its current 99.25 level, exerting more downward pressure on EURUSD. Conversely, any dovish hints could lead to a DXY pullback and a potential Euro rebound.
The path ahead for EURUSD remains complex, with clear technical levels and macroeconomic forces guiding the narrative. While the bearish trend is evident on longer timeframes, the potential for short-term volatility and consolidation remains. Traders should prioritize risk management and wait for clear confirmation signals before committing to positions. The market is cyclical, and while current conditions favour the downside, opportunities often emerge from volatility for those who are patient and disciplined.
Technical Outlook Summary
| Indicator | Value | Signal | Interpretation |
|---|---|---|---|
| RSI (14) | 44.34 | Bearish | Further downside possible, not yet oversold |
| MACD Histogram | -0.00106 | Bearish | Negative momentum persists |
| Stochastic (%K) | 49.67 | Neutral | Near mid-range, awaiting direction |
| ADX | 37.37 | Strong Trend | Confirms a strong bearish trend on daily |
| Bollinger Bands | Below Middle Band | Bearish | Price below middle band indicates bearish bias |
Key Levels
Support Levels
Resistance Levels
Track markets in real-time
AI-powered analysis, technical indicators and real-time price data.
Join Our Telegram Channel
Breaking market news, AI analysis and trading signals instantly.
Join Channel