AUDUSD Tests $0.70122: Bull vs. Bear Battle at Critical Juncture
AUDUSD holds near $0.70122, caught between diverging technical signals and key support/resistance levels. Is a breakout imminent?
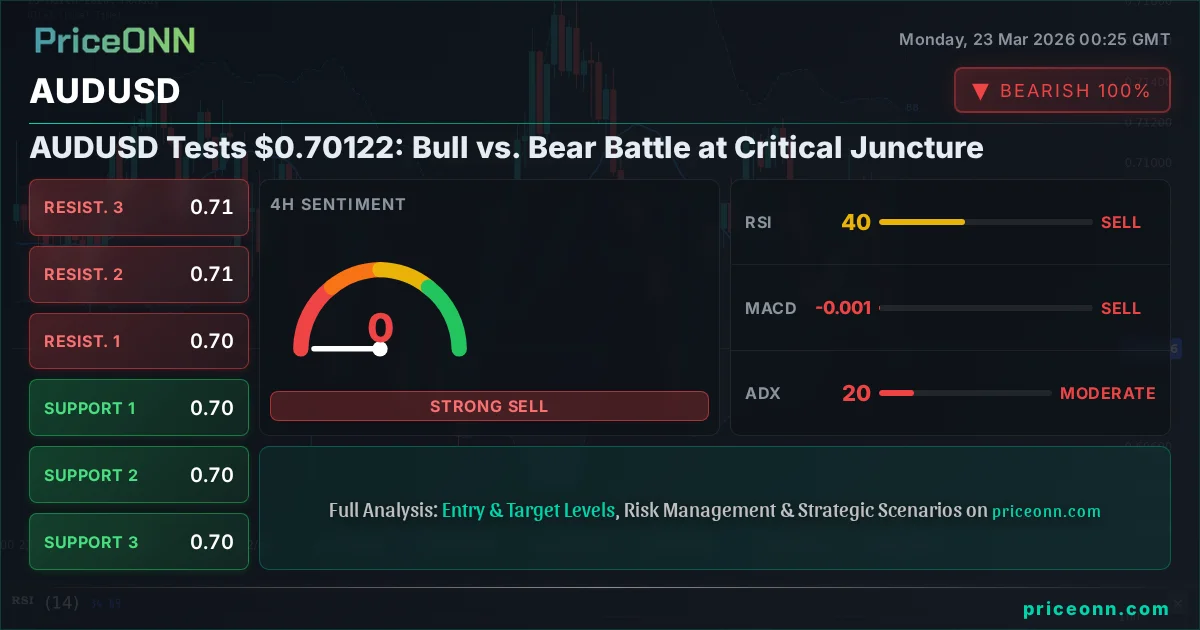
The AUDUSD currency pair finds itself at a pivotal crossroads, currently hovering around the $0.70122 mark. This level is more than just a number; it represents a battleground where bullish aspirations clash with bearish pressures. With the 1-hour chart showing a strong downtrend, the 4-hour hinting at further weakness, and the daily timeframe exhibiting a neutral yet cautious stance, the Aussie dollar's immediate future is shrouded in uncertainty. This divergence across timeframes paints a complex picture, demanding a deep dive into the technical indicators and market sentiment to decipher the next likely move.
- AUDUSD RSI at 33.49 signals bearish momentum, but Stochastic shows a potential oversold bounce.
- Critical support sits at $0.69770, tested multiple times this week. A break below could trigger a sharp decline.
- The ADX at 26.13 on the 1-hour chart indicates a strong downtrend, suggesting bears are in control in the short term.
- With the DXY strengthening to 99.34, it continues to exert pressure on risk-sensitive currencies like the AUD.
The Battle for $0.70: Bulls vs. Bears
The AUDUSD currency pair is currently locked in a fierce tug-of-war, with the price action oscillating around the $0.70122 level. This psychological threshold, coupled with significant technical indicators flashing mixed signals, has created a tense environment for traders. On one hand, the relentless downward pressure seen in the 1-hour and 4-hour charts suggests that bears are firmly in the driver's seat, pushing the pair towards lower ground. The strength of the downtrend, as indicated by the ADX readings, is undeniable in these shorter timeframes. However, the daily chart presents a more nuanced view, reflecting a market that is neither fully committed to a direction nor entirely stagnant. This ambiguity is precisely what makes the current price action so critical, as a decisive break in either direction could trigger substantial price movements.
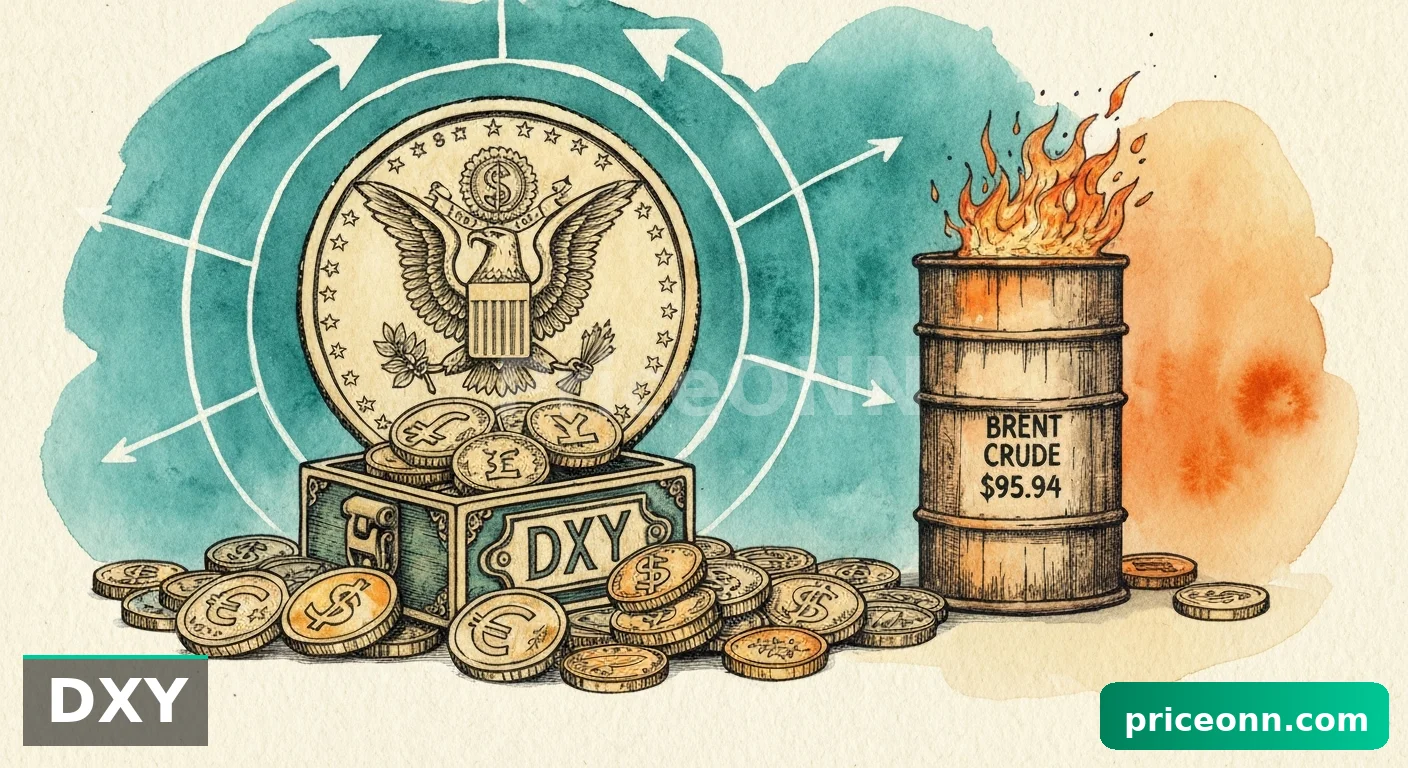
The interplay between the US Dollar Index (DXY) and AUDUSD cannot be overstated. With the DXY currently trading at 99.34 and showing a strong upward trend on the daily timeframe, it's creating a headwind for the Australian dollar. A stronger dollar generally makes commodities and riskier assets, including the AUD, less attractive to global investors. This correlation is a fundamental piece of the puzzle, suggesting that any significant shifts in the DXY's trajectory will likely be mirrored, albeit with its own unique technical nuances, in the AUDUSD pair. Understanding this dynamic is crucial for anyone attempting to navigate the choppy waters surrounding the $0.70122 handle.
The Bull Case: A Bounce from Oversold Territory?
Despite the prevailing bearish sentiment on shorter timeframes, there are glimmers of hope for the bulls. The Stochastic Oscillator on the 1-hour chart is currently flashing an oversold signal, with the %K line (19.53) above the %D line (13.25). This technical reading suggests that the recent selling pressure might be overextended, opening the door for a potential short-term rebound. While not a definitive buy signal on its own, it indicates that the momentum behind the downtrend is weakening. Furthermore, the RSI(14) on the 1-hour chart, though still in bearish territory at 33.49, is not at extreme levels that would typically signal a strong reversal on its own. Traders looking for a bullish setup will be closely watching for a confirmation of strength above key resistance levels. The 4-hour chart, while showing a strong downtrend, also has its own Stochastic Oscillator in a corrective phase, hinting that a brief reprieve from the selling might be on the cards before the larger trend potentially reasserts itself.
The daily chart's RSI at 47.97, while leaning bearish, is far from indicating panic selling. This neutral-to-bearish reading on the longer timeframe suggests that the current price levels around $0.70122 might represent a valuable area for accumulation if broader market conditions improve or if the US dollar's upward momentum falters. The fact that the daily ADX is only at 20.48, indicating a relatively weak trend, further supports the idea that the current downtrend might lack the conviction for a sustained plunge below critical support. A bullish scenario would likely require a clear break and hold above the immediate resistance at $0.70325, followed by a push towards $0.70747. This would signify a shift in short-term momentum and potentially attract further buying interest, especially if the DXY begins to retrace some of its recent gains.
The Bear Case: Trend Strength and Dollar Dominance
On the flip side, the bearish argument for AUDUSD is compelling, particularly when examining the shorter timeframes and the broader macroeconomic context. The 1-hour and 4-hour charts are dominated by a strong downtrend, with the ADX indicator registering robust readings of 26.13 and 36.13 respectively. These figures suggest that the market is experiencing a significant trend, and attempting to counter it is a risky endeavor. The MACD indicator on both these timeframes is also firmly in negative territory, with the MACD line below its signal line, reinforcing the bearish momentum. This technical picture suggests that sellers are actively engaged and have control over price action in the near term. The daily chart, while showing a weaker ADX, still has its RSI below 50 and MACD in negative territory, indicating that the overarching trend is still down, even if the conviction is wavering.
Furthermore, the strengthening US Dollar Index (DXY), currently at 99.34, provides a strong fundamental tailwind for the bearish case. As the DXY climbs, it exerts downward pressure on risk-sensitive currencies like the Australian dollar. The recent energy market surge, with Brent crude at $112.54 and WTI at $98.62, could potentially fuel inflation concerns, leading to expectations of tighter monetary policy from the Federal Reserve. While higher commodity prices can sometimes support the AUD, the dominant factor currently appears to be the strength of the US dollar and global risk sentiment. A bearish scenario would see AUDUSD decisively break below the $0.69770 support level, potentially targeting the next significant floor at $0.69102. This would confirm the continuation of the downtrend and likely be accompanied by further dollar strength and a retreat in global risk appetite.
Technical Confluence and Divergence
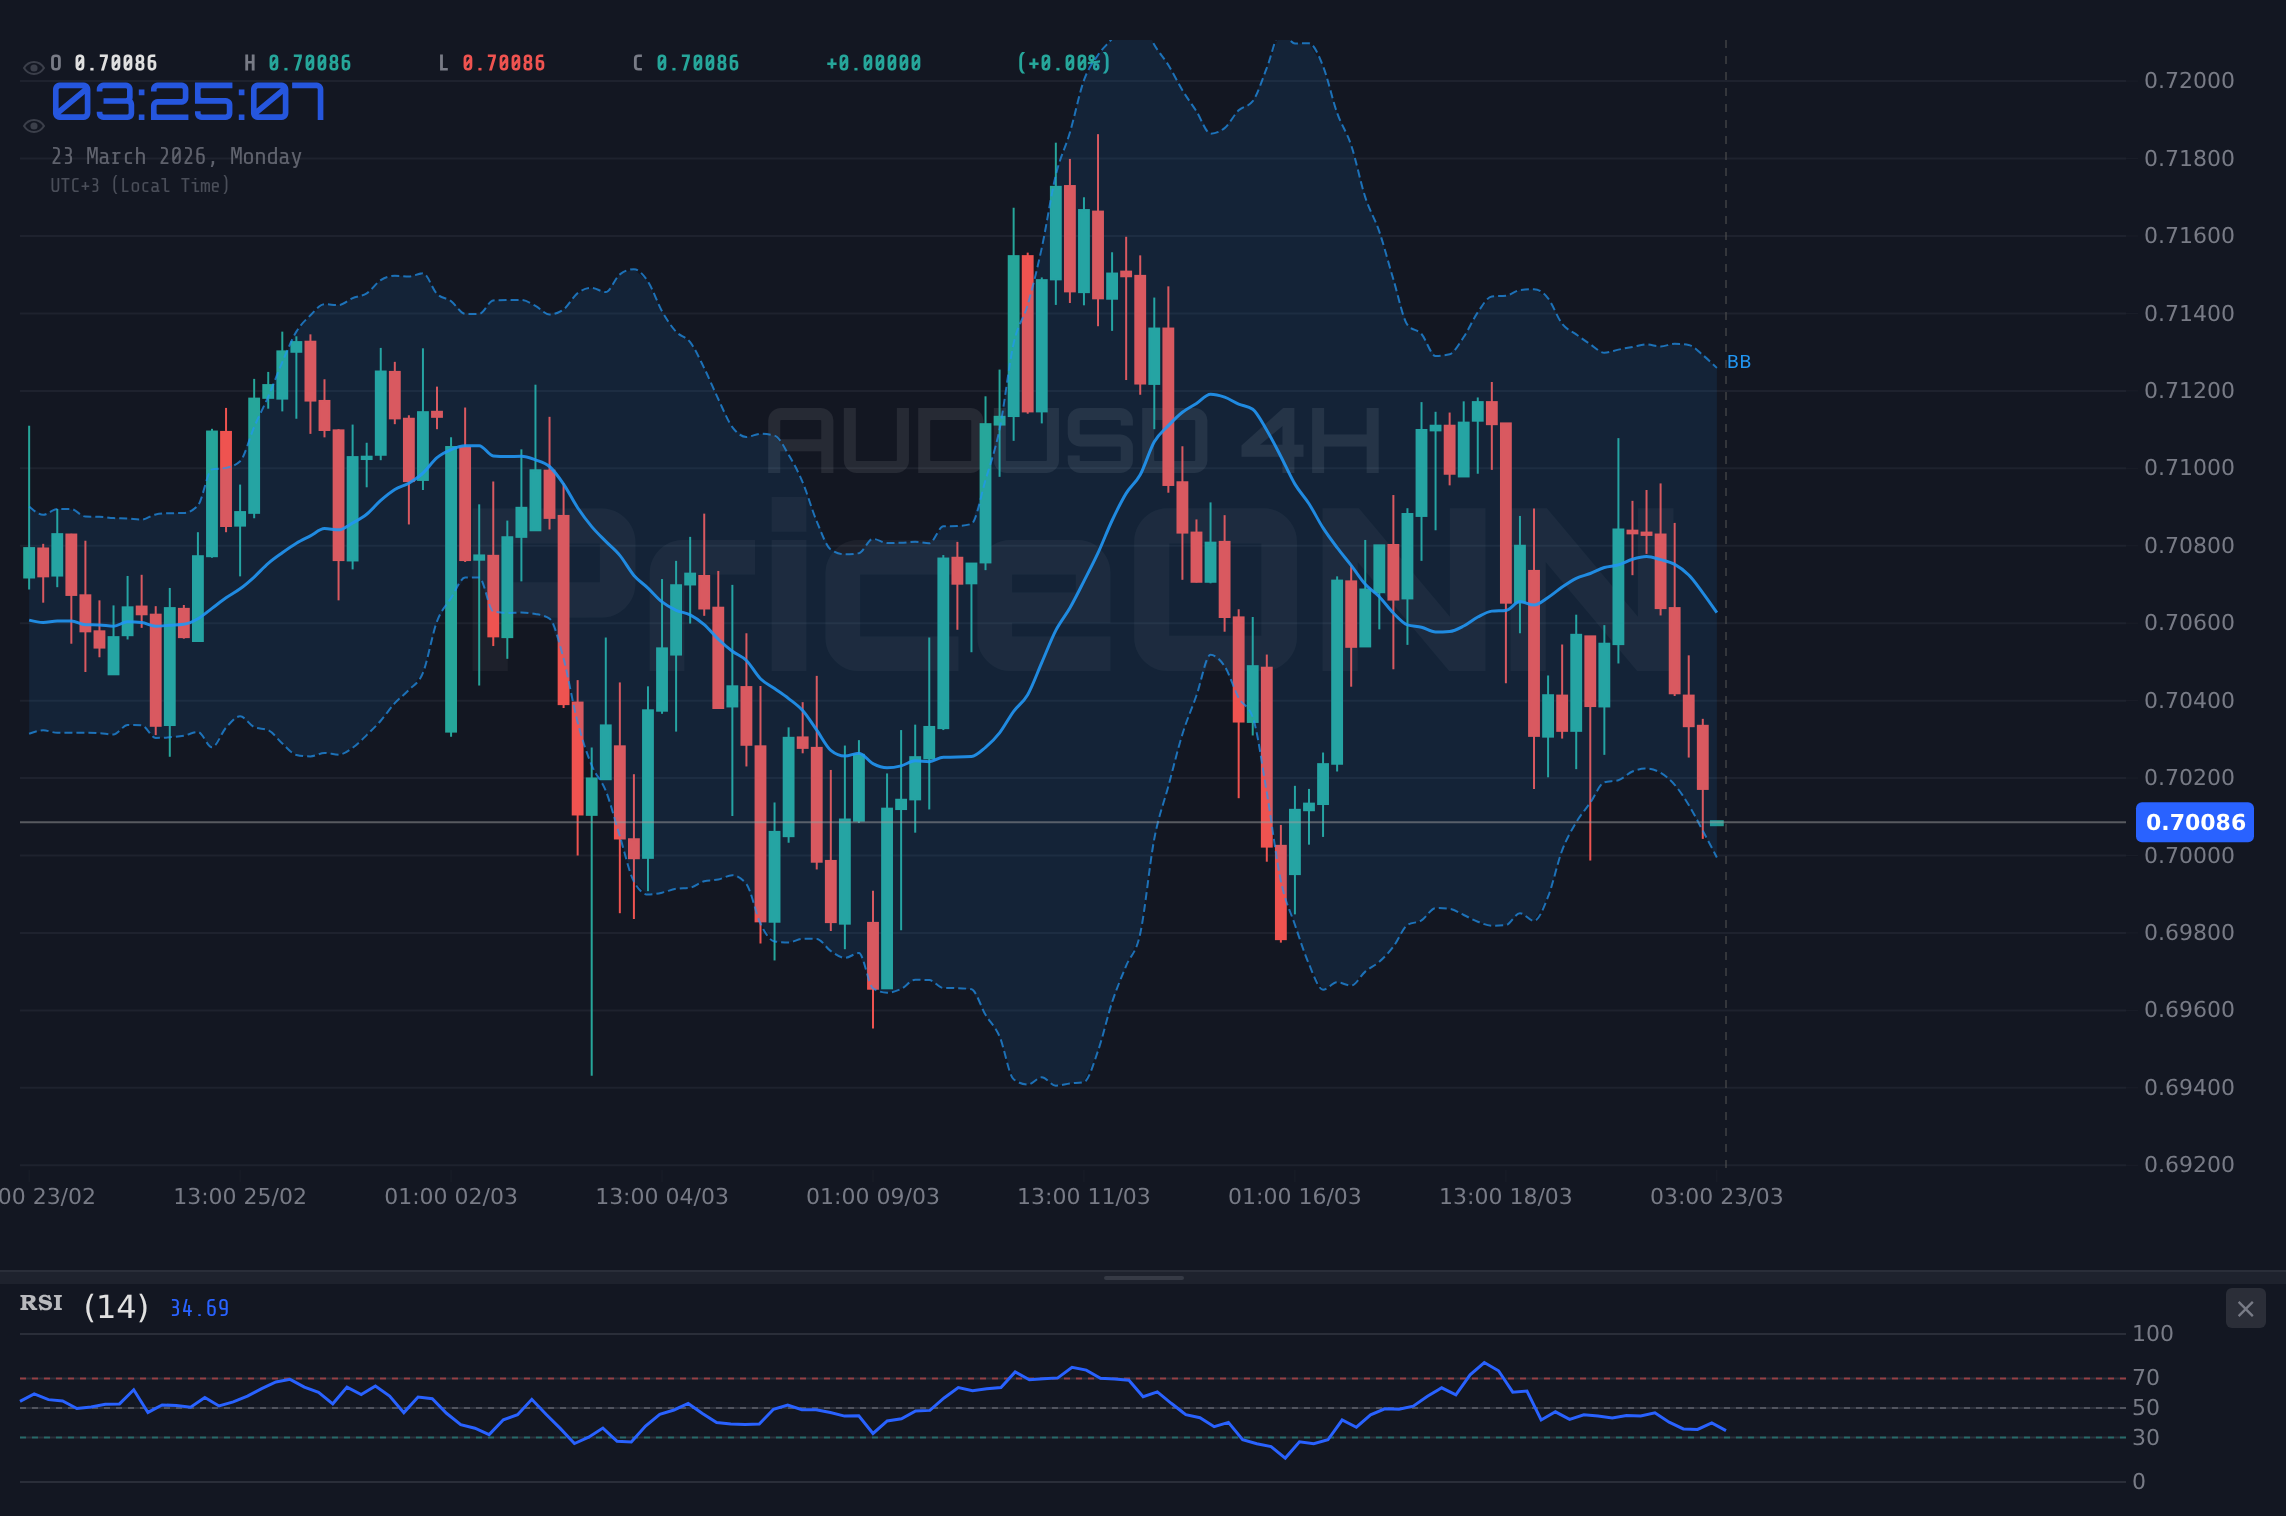
The technical landscape for AUDUSD is a fascinating study in contrasts. On the 1-hour chart, the Stochastic Oscillator is oversold, suggesting a potential bounce, yet the RSI is bearish and the ADX indicates a strong trend. This is a classic example of conflicting signals. The Stochastic might be indicating a short-term correction within a larger downtrend, rather than the start of a new bullish phase. The price action itself, hugging the lower Bollinger Band on the 1-hour and 4-hour charts, further emphasizes the bearish pressure. The fact that the price has been unable to reclaim the middle Bollinger Band on these shorter timeframes is a significant bearish indicator, suggesting that sellers are consistently stepping in at higher prices.
The daily timeframe offers a slightly different perspective. While the overall trend is still considered down, the ADX at 20.48 suggests a lack of strong directional conviction. The RSI at 47.97 is hovering in a neutral zone, meaning it's neither significantly overbought nor oversold. This could imply that the market is consolidating or waiting for a catalyst. If AUDUSD can hold the support at $0.69545, there's a possibility of a move back towards the daily middle Bollinger Band, which currently sits around $0.70193. However, for this to materialize, the bearish signals on the shorter timeframes would need to abate, and the DXY would need to show signs of weakness. The current data suggests that while a short-term bounce is possible, the path of least resistance still appears to be downwards until key resistance levels are convincingly breached.
Scenario Analysis: Charting the Path Forward
Given the conflicting signals and the critical price levels surrounding AUDUSD, a scenario-based approach is essential for navigating this market. The current technical setup, with a strong downtrend on shorter timeframes but a weaker trend on the daily, alongside mixed indicator readings, suggests a high degree of uncertainty. The interplay between the US dollar's strength and the commodity-linked Australian dollar will be paramount in determining the next directional move.
Bearish Scenario: Sustained Dollar Strength
65% ProbabilityNeutral Scenario: Consolidation Around $0.70122
25% ProbabilityBullish Scenario: Oversold Bounce and Dollar Weakness
10% ProbabilityThe Verdict: Cautious Bearish Stance
Based on the current technical data and macroeconomic correlations, the most probable scenario for AUDUSD leans towards the bearish side. The strength of the downtrend on shorter timeframes, supported by robust ADX readings and bearish MACD signals, coupled with the persistent strength of the US Dollar Index (DXY) at 99.34, creates a challenging environment for the Australian dollar. While the oversold Stochastic on the 1-hour chart suggests a potential for a short-term bounce, this is likely to be a corrective move within a larger downtrend rather than the start of a significant rally. The daily chart's neutral stance indicates that if the bearish momentum continues, the downside targets become increasingly probable.
The key level to watch remains the support at $0.69770. A decisive break below this level would likely accelerate selling pressure, potentially leading AUDUSD towards the $0.69102 mark. Conversely, for the bulls to regain control, they would need to not only break through immediate resistance at $0.70325 but also see a notable weakening in the DXY and a shift in broader market sentiment. Until then, traders should exercise caution and consider the possibility of further downside. Risk management remains paramount; any positions should be carefully sized, and stop-losses should be strategically placed below key support levels. Patience is key – waiting for a confirmed breakout or a clear reversal signal will be more rewarding than trying to catch a falling knife.
Frequently Asked Questions: AUDUSD Analysis
What happens if AUDUSD breaks below the $0.69770 support level?
A break below $0.69770 would confirm the bearish trend, with the next significant target likely being the daily support at $0.69102. This would be driven by sustained dollar strength and potentially further risk aversion in global markets.
Should I buy AUDUSD at current levels of $0.70122 given the oversold Stochastic signal?
Buying at $0.70122 solely based on the oversold Stochastic is risky, as the overall trend remains bearish. A confirmation signal, such as a close above $0.70325 resistance and weakening DXY, would be needed for a higher probability bullish setup.
Is the RSI at 33.49 a sell signal for AUDUSD right now?
An RSI of 33.49 on the 1-hour chart indicates bearish momentum but is not yet in extreme oversold territory for a strong reversal signal. It aligns with the prevailing downtrend, suggesting further downside potential if resistance levels hold.
How will the strengthening DXY at 99.34 affect AUDUSD this week?
The rising DXY typically puts downward pressure on AUDUSD, as seen in its current correlation. Further gains in the dollar could push AUDUSD towards its support levels, while any DXY pullback might offer a brief reprieve for the Aussie.
Track markets in real-time
AI-powered analysis, technical indicators and real-time price data.
Join Our Telegram Channel
Breaking market news, AI analysis and trading signals instantly.
Join Channel