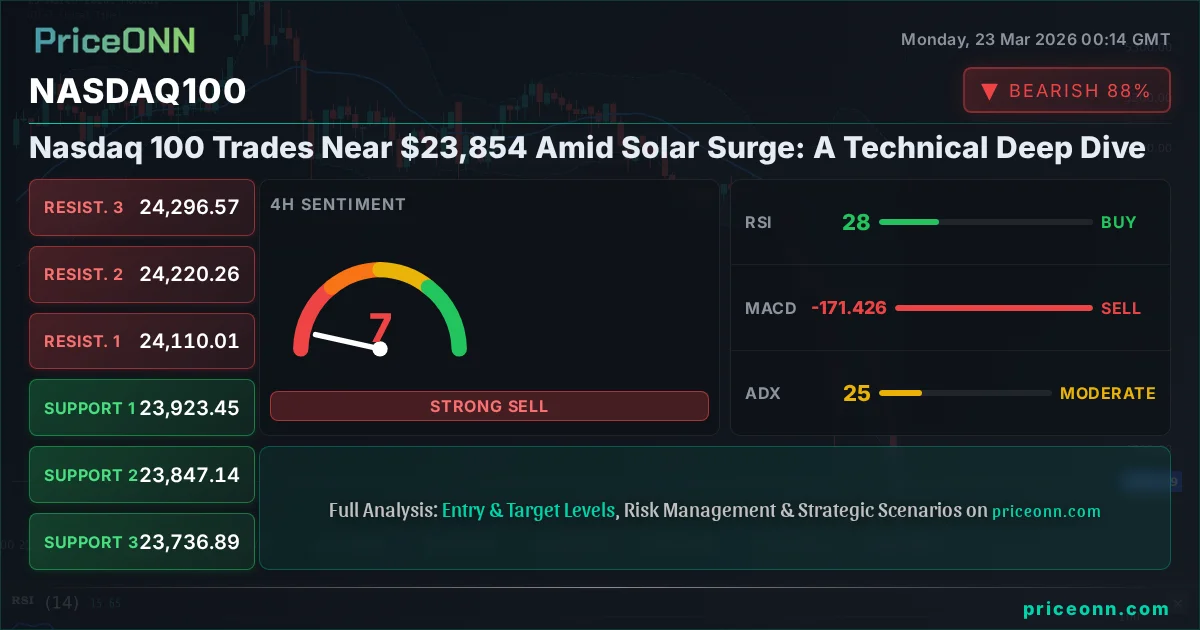
Nasdaq 100 Trades Near $23,854 Amid Solar Surge: A Technical Deep Dive
The Nasdaq 100 hovers near critical support at $23,854.88, with a powerful solar energy boom creating unexpected market cross-currents. Analysis reveals a tense technical picture.
The Nasdaq 100 is currently teetering on a knife's edge, trading precariously close to the $23,854.88 support level. This isn't just another day in the tech-heavy index; a fascinating confluence of technical indicators and a surprising surge in solar energy adoption is creating a complex narrative for traders right now. While the broader market sentiment has been decidedly risk-off, the relentless growth in renewables, particularly solar, presents an intriguing backdrop that could influence market dynamics in ways we haven't fully anticipated. This deep dive will dissect the Nasdaq 100's current technical setup, explore the implications of its correlation with broader market trends, and assess the potential impact of this burgeoning solar boom.
- Nasdaq 100 RSI at 31.39 signals bearish pressure, nearing oversold territory on the 1-hour chart.
- Critical support for the Nasdaq 100 sits at $23,633.57, a level tested multiple times this week.
- The ADX at 40.67 on the 1-hour chart indicates a strong downtrend, suggesting further downside risk.
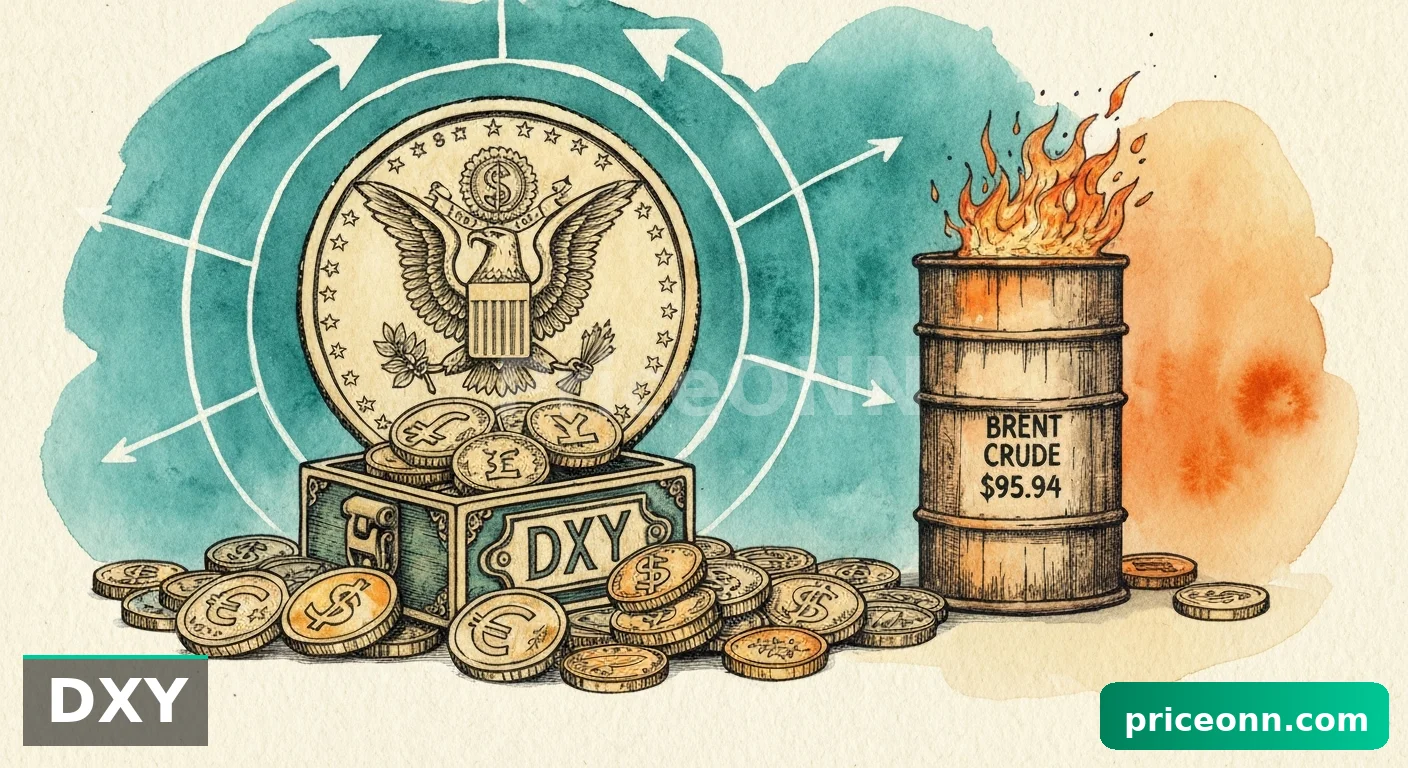
- The DXY index at 99.31 is showing strength, potentially correlating with Nasdaq 100 weakness.
The Nasdaq 100's Precarious Position: A Technical Breakdown
Looking at the Nasdaq 100 ($23,854.88), the technical picture is undeniably bearish across multiple timeframes, yet there are whispers of potential capitulation that could signal a turning point. On the 1-hour chart, the trend is firmly established as bearish with a formidable 97% strength, underscored by an RSI reading of 34.86. This isn't quite oversold territory on this timeframe, but it's certainly heading in that direction, suggesting that the selling pressure, while strong, might be approaching exhaustion. The MACD is firmly in negative territory, with its histogram below the signal line, confirming the prevailing bearish momentum. The ADX at 40.39 further solidifies this view, indicating a strong, established downtrend. However, the Stochastic Oscillator is showing a potential buy signal with %K (45.65) crossing above %D (38.35), a divergence that warrants attention amidst the overwhelming bearish signals.
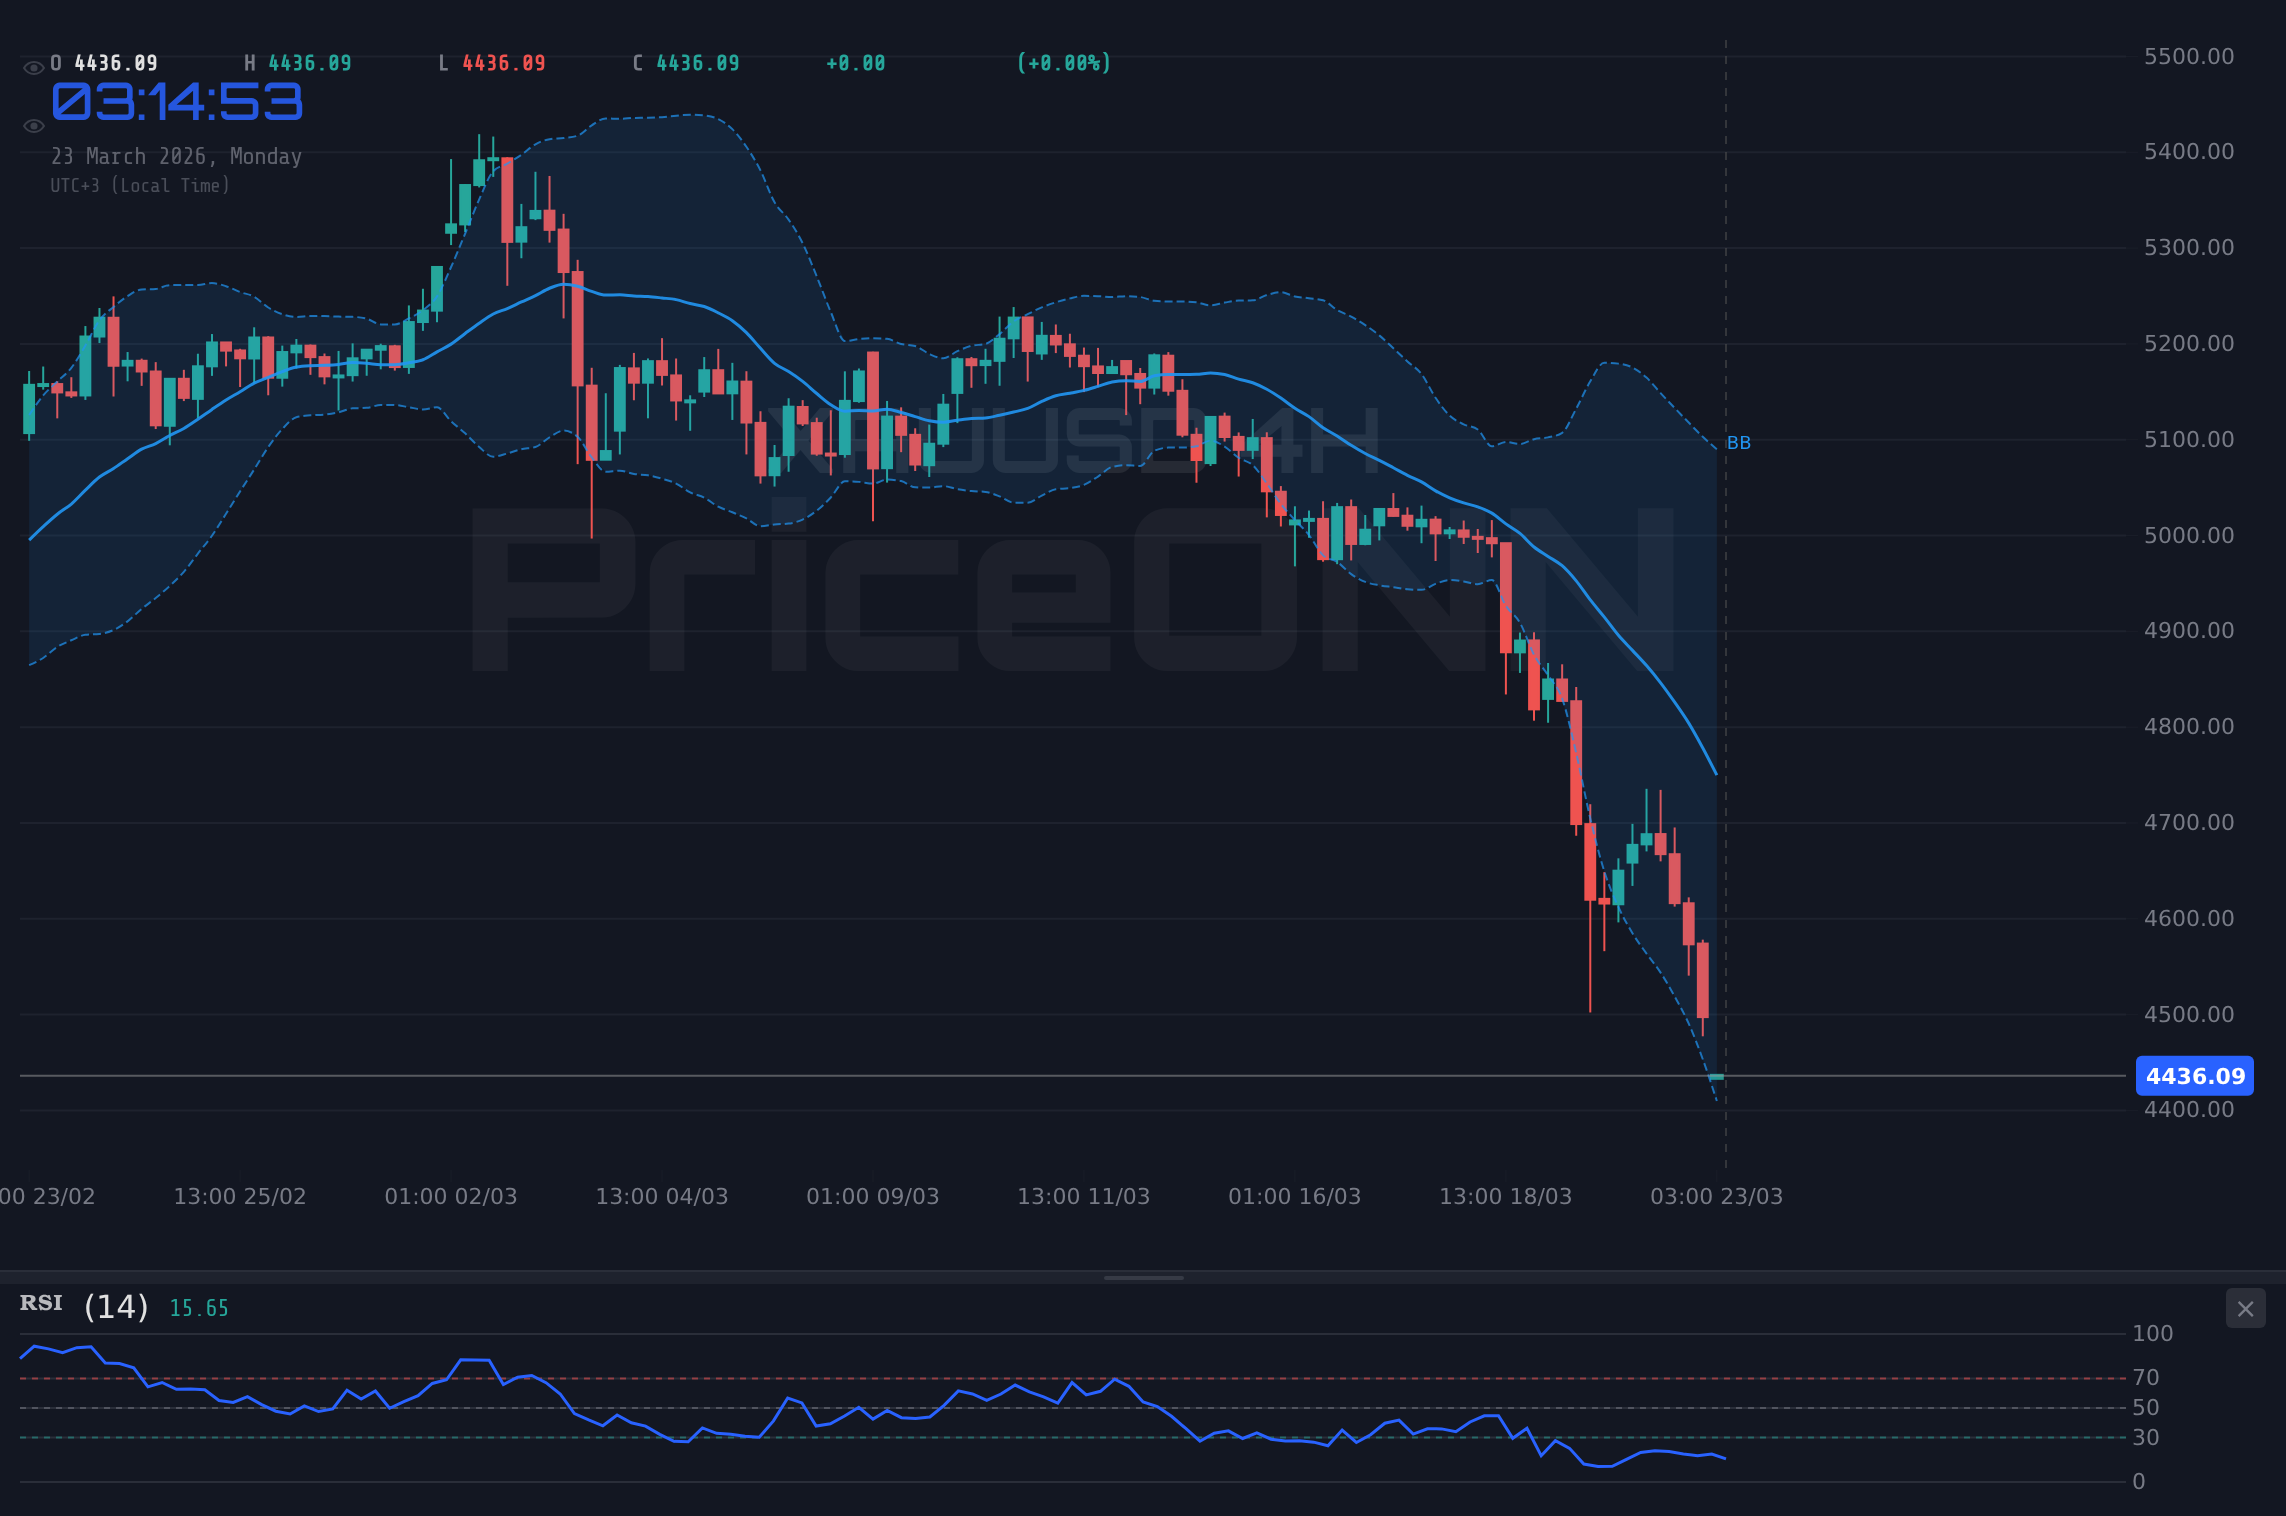
The 4-hour timeframe paints an even starker picture. The trend is overwhelmingly bearish (93% strength). The RSI here is even lower, at 27.5, firmly in oversold territory, which historically can precede a bounce, though it offers no guarantee. The MACD remains negative, and the Bollinger Bands are showing the price action hugging the lower band, a classic sign of strong bearish momentum. The Stochastic, with %K at 19.23 and %D at 28.1, continues to signal a bearish trend, with %K below %D. The ADX here is at 36.32, still indicating a strong downtrend, albeit slightly less intense than the 1-hour chart. The confluence of these indicators on the 4-hour chart suggests that while a short-term bounce is possible, the broader sentiment remains decidedly negative.
On the daily chart, the Nasdaq 100's trend is officially classified as neutral, with a 50% strength, but this neutrality belies the underlying weakness. The price is trading below the middle Bollinger Band, and the RSI at 43.6 is in the upper half of the neutral zone, but trending downwards. The MACD, while still negative, shows a MACD line (43.6) that is higher than its signal line, hinting at a potential slowdown in the bearish momentum or even a nascent bullish crossover. Stochastic K (18.07) is below D (46.47), reinforcing the bearish bias on this timeframe, but the gap is wide, and the values are deep in oversold territory. The ADX at 21.63 points to a moderate downtrend, indicating that the strong directional moves seen on shorter timeframes might be losing steam on a daily basis. This daily neutrality is the key point of tension: the short-term charts scream sell, while the daily chart suggests a potential pause or reversal is brewing, making any short-term trading strategy extremely sensitive to immediate price action.
Correlation Analysis: DXY Strength and Equity Weakness
The current market environment is characterized by a strong inverse correlation between the US Dollar Index (DXY) and major equity indices like the Nasdaq 100. The DXY is currently trading at 99.31, showing a 0.41% increase on the day and a strong 92% bullish trend on the daily timeframe. This strengthening dollar puts pressure on global equities, as it makes US assets more expensive for foreign investors and can signal tighter financial conditions or a flight to safety. On the 1-hour chart, the DXY exhibits a bullish trend (90% strength) with an RSI of 53.52, indicating room for further upside. The MACD is positive, and price is above the middle Bollinger Band, supporting a bullish outlook for the dollar in the short term. This dollar strength is a significant headwind for the Nasdaq 100, contributing to the bearish sentiment and the testing of critical support levels.
The correlation extends to other risk assets as well. The S&P 500 is down 1.74% at 6501.1, and the Nasdaq 100 is following suit with a 2.21% drop to 23854.88. The Nasdaq 100's 4-hour chart shows a bearish trend with an RSI of 28.88, indicating oversold conditions, but the ADX at 26.97 still points to a strong downtrend. Similarly, the Dow Jones Industrial Average has fallen 0.99% to 45627.5, with its daily chart showing a 100% bearish trend and an RSI deep in oversold territory at 26.04. This synchronized decline across major US indices, driven partly by dollar strength and broader risk aversion, reinforces the bearish narrative for the Nasdaq 100. Investors are clearly favoring safe-haven assets or de-risking their portfolios, which directly impacts growth-oriented tech stocks that dominate the Nasdaq 100.
The interplay between the DXY and the Nasdaq 100 is a crucial element for traders to monitor. As the dollar strengthens, the cost of holding non-dollar denominated assets, including the tech stocks within the Nasdaq, effectively increases. This dynamic is particularly potent when coupled with rising interest rate expectations or geopolitical uncertainty, both of which can drive capital towards the perceived safety of the US dollar. The fact that the DXY is showing strong daily trend strength while the Nasdaq 100 is exhibiting significant weakness on its shorter timeframes creates a clear headwind. Any sustained rally in the Nasdaq 100 would likely require either a significant pullback in the DXY or a clear shift in risk appetite, which is not currently evident in the broader market indices like the S&P 500 and Dow Jones.
The Solar Surge: An Unlikely Tailwind?
Amidst the broader market gloom, the energy sector, particularly solar power, is experiencing an unexpected boom. Recent news highlights that despite political headwinds, solar energy adoption is accelerating across the US, with conservative states leading the charge. This growth is fueled by technological advancements, such as quantum leaps in battery technology promising faster charging and increased capacity. While seemingly disconnected from the Nasdaq 100's performance, this energy sector rally, especially in renewables, can have ripple effects. Companies involved in solar technology, battery storage, and related infrastructure are often listed on major indices, including the Nasdaq.
The surge in solar adoption, driven by innovation and a growing recognition of its economic viability, presents a potential, albeit indirect, tailwind. As companies in this sector see increased investment, improved earnings, and positive market sentiment, their stock prices can rise. If these companies are significant components of the Nasdaq 100, their outperformance could theoretically provide some support or at least mitigate further declines in the index. For instance, advancements in quantum batteries, as reported, could revolutionize energy storage, creating new investment opportunities and potentially boosting the valuations of associated tech firms. This sector-specific strength offers a counterpoint to the general bearishness affecting growth stocks.
The narrative around energy transition is evolving rapidly. While traditional oil and gas prices are soaring, leading to discussions about nuclear power's role, the momentum behind renewables like solar is undeniable. Alaska's record oil and gas lease sales might signal a short-term focus on traditional energy, but the long-term trend towards decarbonization, driven by AI's increasing energy demands and the need for sustainable solutions, points towards continued investment in areas like solar and battery tech. This creates a dichotomy: the broad market may be driven by macroeconomic fears and dollar strength, but specific sectors like clean energy are charting their own course based on technological innovation and long-term policy shifts. This divergence is crucial for understanding potential pockets of strength within an otherwise weak market.
Navigating the Technical Landscape: Key Levels and Scenarios
The immediate technical focus for the Nasdaq 100 remains on the support level around $23,633.57. This is the first significant floor that traders are watching. A break below this level on a 4-hour closing basis would likely confirm the bearish trend and open the door for further downside, potentially targeting the $23,558.64 support. The strength of the downtrend on the 1-hour and 4-hour charts, supported by ADX readings above 40 and 25 respectively, suggests that a breakdown is a plausible scenario if the current selling pressure continues. The RSI readings in the oversold territory on these shorter timeframes could lead to a temporary bounce, but without a significant shift in broader market sentiment or a catalyst, such bounces are likely to be short-lived, offering opportunities for short-sellers rather than a sustained recovery.
Conversely, a bullish scenario would require the Nasdaq 100 to reclaim and hold above the immediate resistance level at $23,906.76. A decisive close above this level on the 1-hour chart, ideally accompanied by increasing volume and a softening of the dollar's strength (a dip in DXY), could signal a short-term trend reversal. The Stochastic's buy signal on the 1-hour chart, if confirmed by further upward momentum, could support this. However, the strong bearish signals on the 4-hour and daily charts, particularly the high ADX values indicating a strong trend, mean that any bullish move would face significant hurdles. The key would be for price to not only break resistance but to sustain the move, pushing towards the next resistance at $24,080.82. This would require a significant shift in market psychology, moving away from the current risk-off environment.
A neutral or consolidation scenario is also possible, especially given the conflicting signals between the shorter-term bearish trends and the potentially oversold daily indicators. If the Nasdaq 100 fails to break decisively below $23,633.57 and also fails to overcome the $23,906.76 resistance, we could see a period of consolidation. This would likely occur between these two key levels. The weak trend strength indicated by the daily ADX (21.63) lends some credence to this possibility. In such a range-bound environment, traders would look for opportunities to fade extremes – selling near resistance and buying near support, although the strong overall bearish momentum would make fading support a riskier proposition. The market seems to be in a tug-of-war between the prevailing macroeconomic fears and the potential for oversold bounces, making precise entry and exit points crucial.
Bearish Scenario: Downside Momentum Continues
65% ProbabilityNeutral Scenario: Consolidation Around Key Levels
25% ProbabilityBullish Scenario: Short-Term Rebound Potential
10% ProbabilityNavigating the Trade: What to Watch Next
For traders looking to navigate the current Nasdaq 100 environment, the strategy hinges on risk management and patience. The overwhelming bearish sentiment on shorter timeframes, coupled with the strong dollar, suggests that short positions on any bounces might be the prevailing strategy. However, the oversold conditions on the daily chart cannot be ignored, hinting that a significant bounce could materialize if key levels hold. The solar energy surge, while not a direct driver, adds an interesting layer; monitoring individual tech stocks within the Nasdaq that are linked to this sector could offer clues about pockets of strength.
The immediate action to watch is the price reaction around the $23,633.57 support. A confirmed break below this level would validate the bearish scenario and potentially trigger a cascade of stop-losses, accelerating the decline. Conversely, if the index manages to hold this level and shows signs of a short-term reversal, traders will look for confirmation above $23,906.76. The strength of the DXY will be a critical counter-indicator to monitor; any significant weakening in the dollar could provide the catalyst for a Nasdaq 100 bounce. Ultimately, the current market demands a cautious approach, favoring trades that align with the dominant trend while remaining alert for potential oversold bounces or shifts in underlying sentiment, especially given the underlying strength in specific tech sub-sectors like solar.
Frequently Asked Questions: Nasdaq100 Analysis
What happens if the Nasdaq 100 breaks below its current support level of $23,633.57?
A break below $23,633.57 on the 4-hour chart would invalidate any immediate bullish hopes and likely trigger further selling pressure. This could lead to a test of the $23,558.64 support, driven by the strong bearish momentum indicated by the 1-hour and 4-hour ADX readings.
Should I consider buying the Nasdaq 100 at current levels near $23,854.88, given the oversold RSI on the daily chart?
Buying at current levels carries significant risk due to the strong bearish trend on shorter timeframes. While the daily RSI at 43.6 suggests potential for a bounce, confirmation above $23,906.76 resistance would be needed. A more prudent approach might be to wait for a confirmed break above resistance or a clear hold of support with bullish divergence.
Is the Nasdaq 100's RSI at 31.39 on the 1-hour chart a bearish signal?
An RSI of 31.39 on the 1-hour chart indicates strong bearish momentum and is approaching oversold territory. While it doesn't signal an immediate buy, it suggests that the current selling pressure is substantial and that any bounces might be short-lived until this indicator moves significantly higher.
How might the strengthening DXY at 99.31 impact the Nasdaq 100's outlook this week?
The DXY's current strength and daily bullish trend at 99.31 typically exerts downward pressure on risk assets like the Nasdaq 100. This correlation suggests that further dollar strength could hinder any potential recovery in the index, making breaks below key support levels more probable.
Track markets in real-time
AI-powered analysis, technical indicators and real-time price data.
Join Our Telegram Channel
Breaking market news, AI analysis and trading signals instantly.
Join Channel