SP500 Dips to $6,460.40; Will Support Hold Amidst Fed Fears?
SP500 is trading at $6,460.40, testing critical support at $6,461.53. Traders watch Fed rate hike prospects and geopolitical tensions.
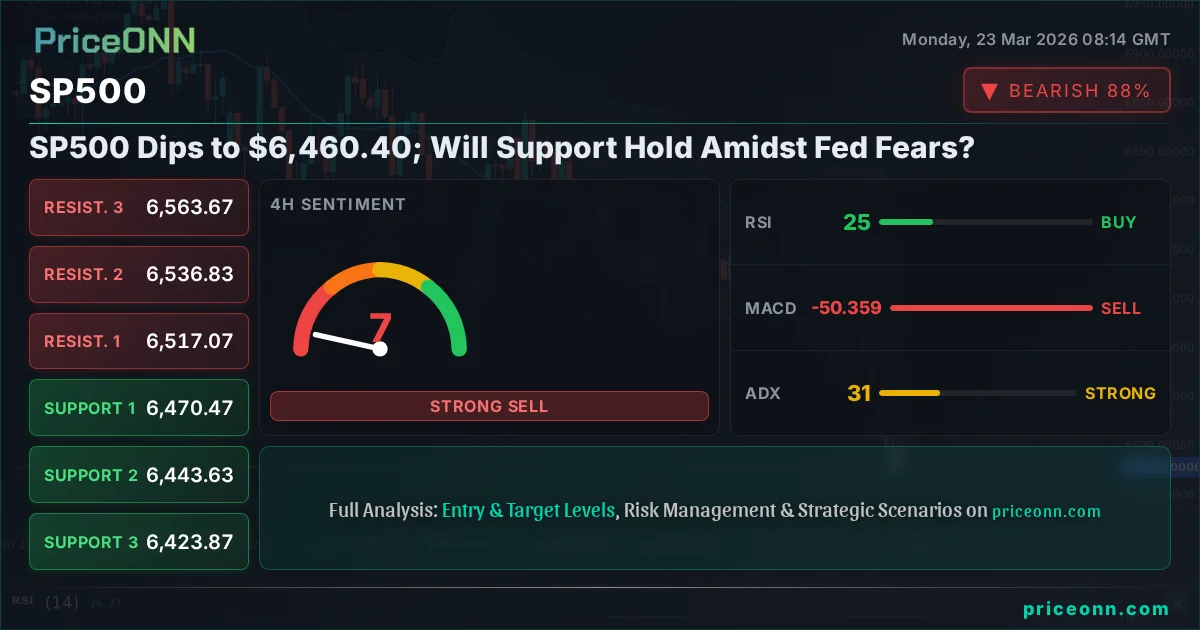
The S&P 500 (SP500) is currently navigating a challenging phase, trading at $6,460.40, as investors grapple with a confluence of escalating geopolitical tensions and renewed fears of aggressive central bank policy. This sharp pullback has brought the index to a critical juncture, testing key support levels that could dictate the near-term market direction. The question on many traders' minds is whether the current dip represents a healthy correction or the beginning of a more significant downturn. This analysis delves into the technical signals and underlying macro factors influencing the SP500's price action, offering a clear perspective for navigating these volatile markets.
- The SP500 is trading at $6,460.40, with the 1-hour chart showing a strong downtrend and a general sell signal.
- Critical support for the SP500 is identified at $6,461.53 on the daily chart, a level that has seen significant testing.
- RSI(14) on the 1-hour chart reads 32.74, indicating waning momentum, while the 4-hour RSI at 25.14 suggests oversold conditions are approaching.
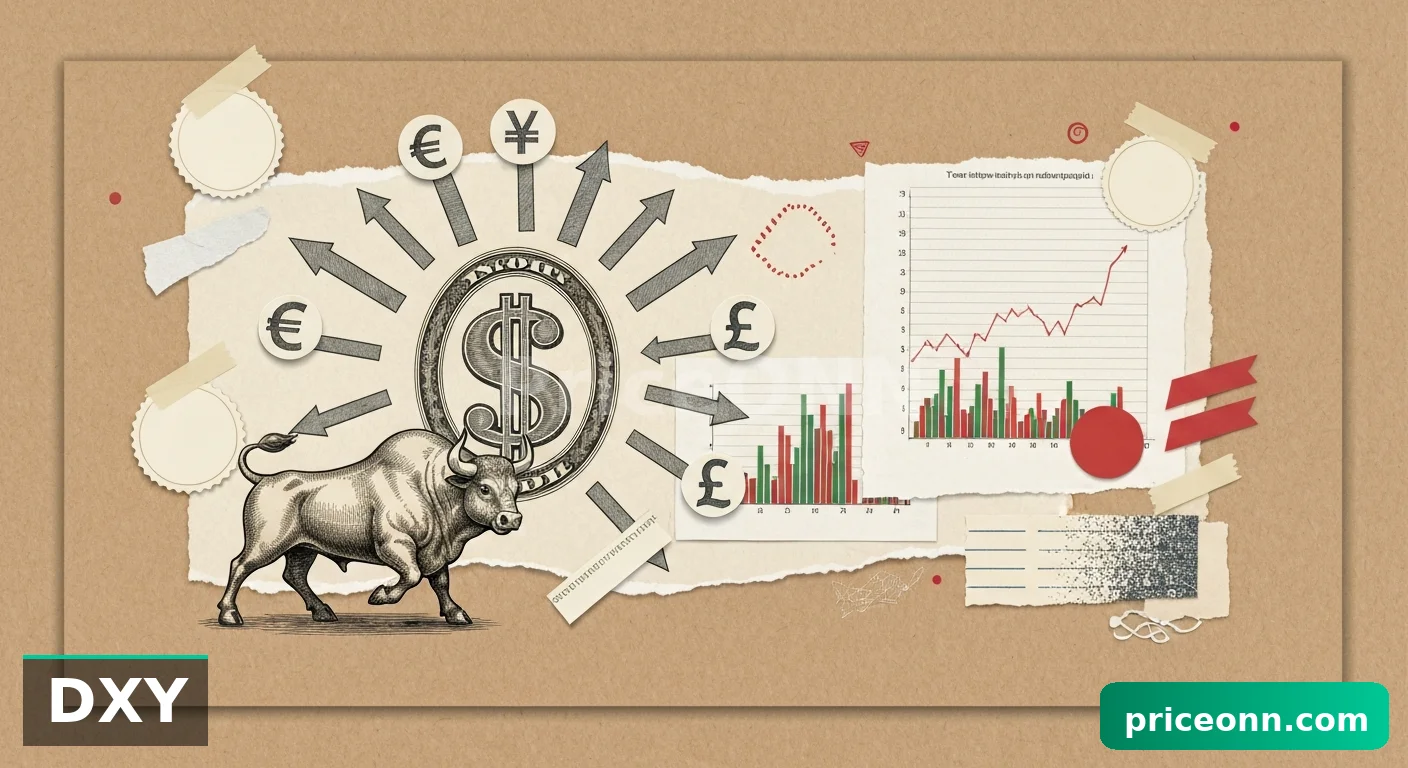
- The correlation with DXY, currently at 99.57, suggests that a strengthening dollar is adding pressure to the equity markets.
The recent market sentiment has been heavily influenced by a potent mix of global uncertainty. Escalating geopolitical risks, particularly in the Middle East, have stoked inflation fears, which in turn are fueling expectations of more hawkish stances from central banks, including the Federal Reserve. The narrative around potential Fed rate hikes, despite the current economic climate, is gaining traction, putting pressure on risk assets like equities. This is a crucial dynamic to monitor; a persistent rise in the Dollar Index (DXY), currently trading at 99.57, often coincides with a pullback in global stock markets as capital seeks safer havens or higher yields. The SP500's correlation with the DXY is a vital piece of the puzzle for understanding its current trajectory.
Technically, the picture on the SP500 is becoming increasingly bearish across multiple timeframes. The 1-hour chart paints a clear downtrend, with a strong 100% trend power and a prevailing sell signal across most indicators. The MACD is firmly below its signal line, and the ADX at 48.17 indicates a robust downward momentum. While the Stochastic oscillator shows a slight potential for a bounce, the overwhelming signals point towards further downside pressure in the short term. This immediate weakness is a significant concern for market participants looking for signs of stability.
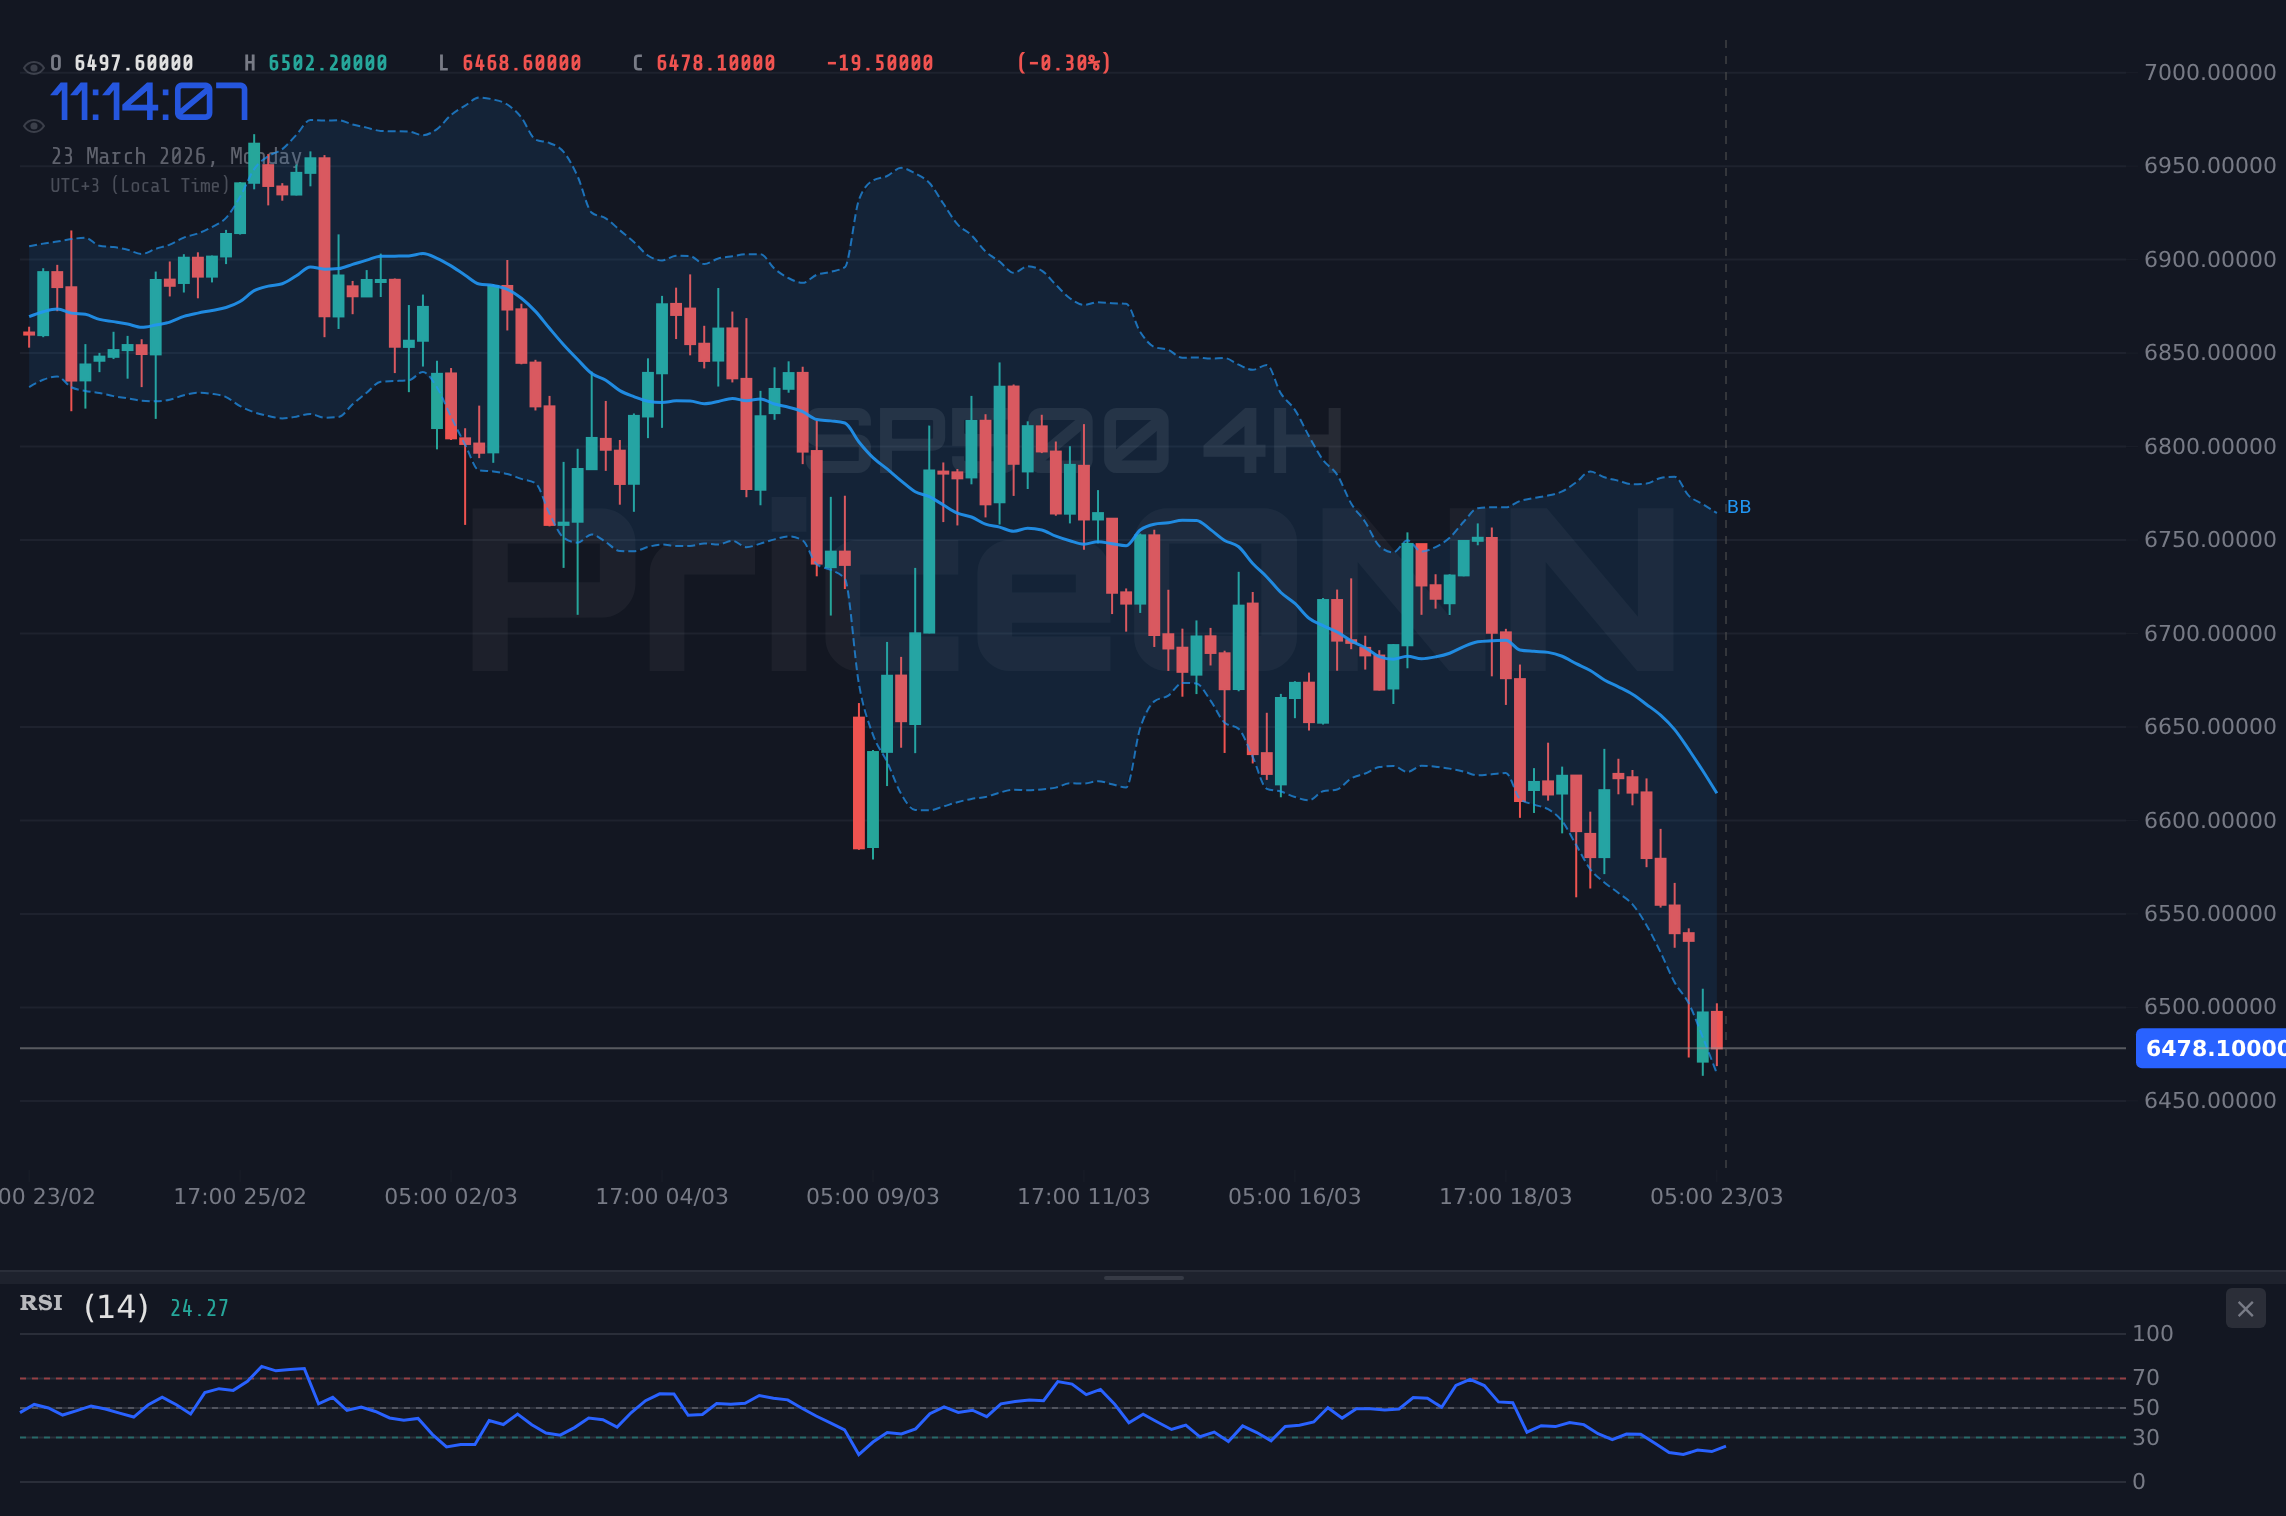
Zooming out to the 4-hour timeframe, the bearish trend remains dominant, albeit with slightly less conviction at 95% trend power. The RSI(14) sits at 25.14, firmly in oversold territory, suggesting that a short-term bounce is plausible. However, the MACD continues to signal negative momentum, and the ADX at 30.96 still denotes a strong downtrend. The Stochastic oscillator here also shows a bearish signal (%K < %D), reinforcing the idea that any bounces might be short-lived corrections within a larger downtrend. The market is clearly leaning towards risk aversion.
The daily chart provides the most critical perspective, and it currently signals a neutral trend with 50% power. However, this neutrality is deceptive; the underlying signals are still predominantly bearish. The RSI(14) at 29.1 is deeply oversold, historically a zone where significant buying interest can emerge. Yet, the MACD remains negative, and the ADX at 46.24 confirms a strong downtrend is still in play. The Stochastic oscillator is also showing a bearish signal. This divergence between an oversold RSI and bearish momentum indicators warrants extreme caution. It suggests that while a bounce is possible, the overall trend remains under pressure, and any upside could be a bear market rally rather than a sustained recovery.
The current price action places the SP500 at a pivotal support level. On the daily chart, the first key support is identified at $6,461.53. This level has been tested multiple times, and its ability to hold will be crucial. A decisive break below this level could trigger significant selling pressure, potentially leading to a rapid decline towards the next support at $6,387.47. Conversely, if this support holds firm, we might see a short-term relief rally, but it would need to overcome immediate resistance levels to signal a genuine trend reversal.
Resistance levels are equally important to watch. On the 1-hour chart, immediate resistance is seen at $6,471.6, followed by $6,491.9. A sustained move above these levels would be the first indication that the short-term downtrend might be pausing. However, the more significant resistance lies on the daily chart, starting at $6,621.33. Breaking through this level would be necessary to challenge the broader bearish sentiment and suggest a potential shift in market dynamics. Until then, rallies are likely to be met with selling pressure.
Navigating the Geopolitical Crosscurrents
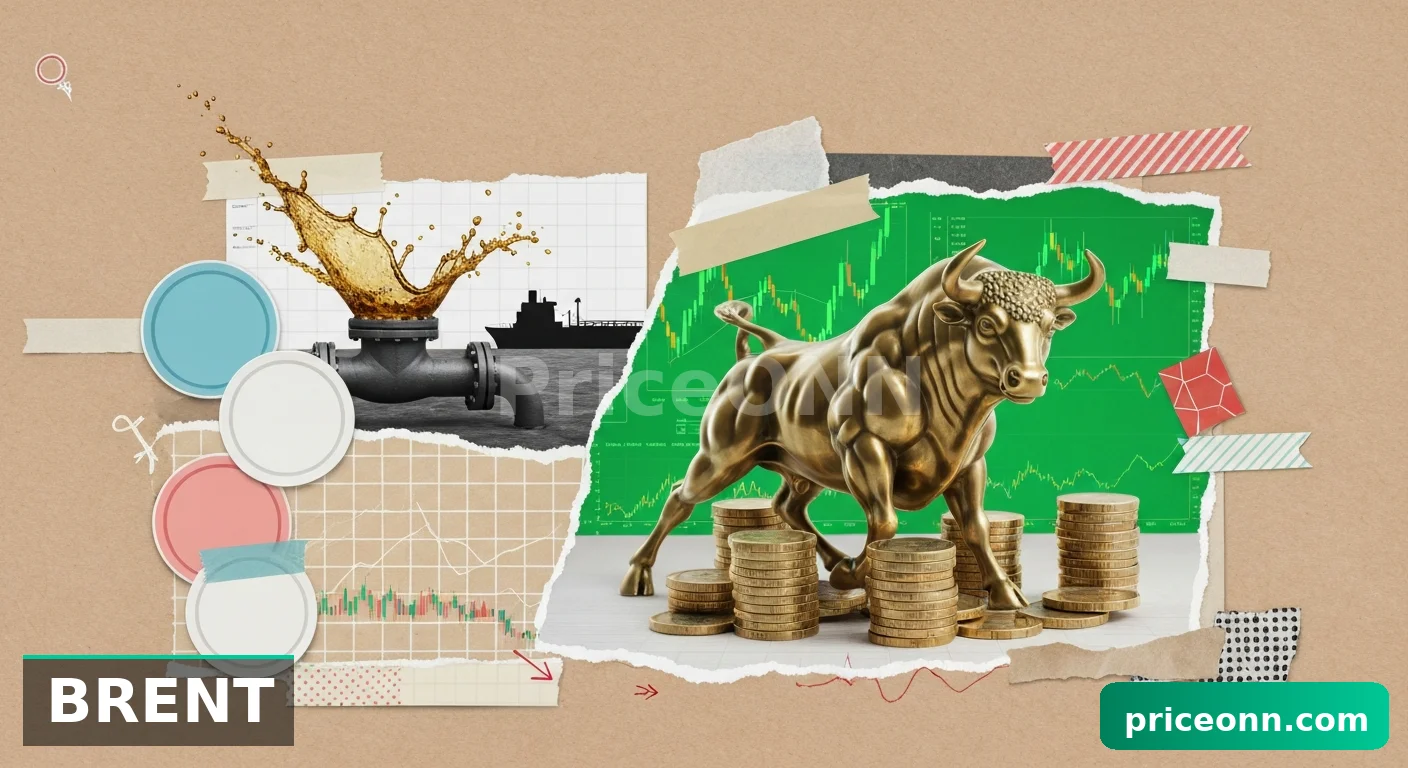
The current market turbulence cannot be fully understood without considering the intensifying geopolitical landscape. Events unfolding in the Middle East have sent shockwaves through commodity markets, most notably driving Brent crude oil prices above the critical $100 per barrel mark and WTI past $100.31. This surge in energy prices inevitably fuels inflation concerns globally. For equity markets like the SP500, this creates a double-edged sword: higher energy costs can dampen corporate profit margins and consumer spending, while also increasing the specter of persistent inflation that could force central banks to maintain a tighter monetary policy for longer than anticipated.
The implications for monetary policy are profound. Traders are increasingly pricing in the possibility of further Federal Reserve rate hikes, or at least a prolonged period of higher interest rates, to combat this inflationary pressure. This shift in expectations is reflected in the bond markets and directly impacts risk appetite. When the market anticipates tighter financial conditions, the appeal of growth assets like technology stocks, heavily represented in the Nasdaq 100, diminishes. The Nasdaq 100 itself is showing significant weakness, trading down at 23,685.39, further corroborating the risk-off sentiment that is weighing on the broader SP500 index.
This environment also strengthens the US Dollar. As seen with the DXY at 99.57, the dollar is benefiting from its safe-haven status and the prospect of higher US interest rates relative to other major economies. A stronger dollar typically acts as a headwind for US multinational corporations, whose earnings are translated back into dollars, and it also makes dollar-denominated assets more expensive for foreign investors. This dynamic further contributes to the selling pressure on the SP500, creating a negative feedback loop where geopolitical fears, inflation, rate hike expectations, and dollar strength all reinforce each other.
The correlation between these factors is undeniable. For instance, the recent dip in gold, trading around $4,460, despite inflation fears, can be partly attributed to the strengthening dollar and rising yields. Gold, often seen as an inflation hedge and a safe haven, is facing headwinds from these opposing forces. This complex interplay underscores the difficulty in predicting short-term market moves, but it highlights the dominant themes shaping investor sentiment: inflation and geopolitical instability.
Technical Indicators: A Mixed Signal Amidst the Downtrend
While the macro picture paints a predominantly bearish canvas, a closer look at the technical indicators reveals some nuances, particularly concerning the potential for short-term bounces. On the 1-hour chart, the RSI(14) at 32.74 is approaching oversold territory, suggesting that the immediate selling momentum might be exhausting. Similarly, the Stochastic oscillator, despite showing a slight bullish crossover (%K > %D), is still in the lower range, indicating potential for a short-term reversal. However, the MACD remains deeply negative, and the strong ADX of 48.17 confirms that the downtrend is powerful and any bounce is likely to be a retracement within this trend.
The 4-hour timeframe offers a more pronounced oversold reading. The RSI(14) stands at 25.14, a level often associated with significant buying opportunities in the medium term. The Stochastic is also oversold, though still showing a bearish cross. The ADX here is at 30.96, still indicating a strong trend but slightly less intense than on the 1-hour chart. This oversold condition on the 4-hour chart is perhaps the strongest technical argument for a temporary pause in the decline or a short-covering rally. Traders will be looking for confirmation from price action and volume.
On the daily chart, the RSI(14) at 29.1 is perhaps the most compelling signal for a potential bounce. Historically, when the SP500’s daily RSI dips below 30, it often precedes a period of consolidation or a short-term reversal. This is the zone where bargain hunters might step in. However, it's crucial to temper optimism. The MACD is still printing negative histogram values, and the ADX at 46.24 signifies a very strong trend. The Stochastic also provides a bearish signal (%K < %D). This conflict - an oversold RSI versus bearish momentum and trend strength - is a classic sign of a bear market where bounces can be sharp but short-lived. Confirmation of a bottom will require a clear break of resistance levels and sustained buying volume.
The divergence in signals across timeframes is noteworthy. The short-term charts suggest exhaustion, while the longer-term trend indicators remain firmly bearish. This often leads to choppy price action, with sharp intraday swings. Scalpers might find opportunities in short-term bounces, while swing traders will need to wait for clearer signals, perhaps a confirmed break of a key resistance level or a sustained hold of the current support. The ADX values across all timeframes (48.17 on 1H, 30.96 on 4H, 46.24 on 1D) consistently point to strong trending conditions, even if the direction is currently down.
Trade Scenarios: Mapping the Path Forward
Given the current technical setup and macro backdrop, several scenarios are plausible for the SP500. The dominant bearish pressure suggests that downside risks remain elevated, but the oversold conditions on higher timeframes also open the door for potential counter-trend moves.
Bearish Scenario: Downside Acceleration
65% ProbabilityNeutral Scenario: Consolidation Around Support
25% ProbabilityBullish Scenario: Oversold Bounce
10% ProbabilityThe bearish scenario carries the highest probability, driven by the persistent macro headwinds and the strong downtrend signals across multiple timeframes. A decisive break below the $6,461.53 support level could ignite further selling, as stops are triggered and momentum traders enter short positions. The confluence of factors - geopolitical risk, inflation, potential rate hikes, and a strong dollar - creates a potent mix for further downside.
The neutral scenario envisages a period of consolidation or a choppy trading range around the current support level. This could occur if the market digests recent news or awaits further economic data. However, given the strength of the current trend, such consolidation might be temporary, potentially leading to a breakout in either direction. For this scenario to play out, key resistance levels on the shorter timeframes would need to be tested and potentially broken, but without the conviction of a full trend reversal.
The bullish scenario, while having the lowest probability currently, cannot be entirely dismissed, especially given the deeply oversold readings on the daily RSI. A strong bounce from the $6,461.53 support level, perhaps fueled by surprisingly dovish commentary from the Fed or a de-escalation of geopolitical tensions, could lead to a relief rally. However, for this to gain traction, the index would need to decisively break through significant daily resistance levels, which seems unlikely in the current environment without a fundamental shift.
What the Indicators Are Saying
The technical indicators provide a granular view of the market's immediate pressures. On the 1-hour chart, the ADX at 48.17 suggests a very strong trend is in play, which currently favors sellers. The RSI(14) at 32.74 is nearing oversold territory, hinting at potential exhaustion of the current downward momentum. The MACD is firmly in negative territory, indicating bearish sentiment prevails. The Stochastic oscillator (%K: 22.44, %D: 21.26) shows a slight bullish crossover, but this is occurring in the oversold zone and needs further confirmation to be considered significant.
Moving to the 4-hour chart, the ADX remains strong at 30.96, confirming a robust downtrend. The RSI(14) at 25.14 is deeply oversold, presenting a potential short-term buying opportunity, though the trend strength suggests caution. The MACD continues to signal negative momentum. The Stochastic oscillator (%K: 19.06, %D: 21.65) indicates a bearish signal, reinforcing the downward pressure. The combination here suggests that while oversold conditions are present, the trend remains firmly in control of the bears.
On the daily timeframe, the ADX at 46.24 signifies a very strong downtrend. The RSI(14) at 29.1 is deeply oversold, which historically has offered buying opportunities, but the strength of the overall trend must be respected. The MACD is negative, and the Stochastic oscillator (%K: 12.27, %D: 24.12) also provides a bearish signal. The conflict between the oversold RSI and the strong bearish trend indicators is a key feature of the current market environment, suggesting high volatility and the potential for sharp, albeit possibly short-lived, counter-trend moves.
The interplay between these indicators and the key support and resistance levels highlights the critical nature of the current price action. A close below $6,461.53 on the daily chart would be a significant bearish signal, potentially accelerating the decline. Conversely, a hold of this level, followed by a decisive break above the immediate hourly resistance and ultimately the daily resistance at $6,621.33, would be required to challenge the prevailing bearish sentiment.
Market Sentiment and Correlation Dynamics
The broader market sentiment is decidedly risk-averse, a condition exacerbated by the ongoing geopolitical tensions and the persistent inflation narrative. This sentiment is clearly reflected in the performance of major indices. The Nasdaq 100 is down 1.28% today, trading at 23,685.39, and the Dow Jones Industrial Average (DJ30) has fallen 0.98% to 45,348.5. This broad-based decline in equities underscores a general flight to safety, which typically benefits assets like the US Dollar.
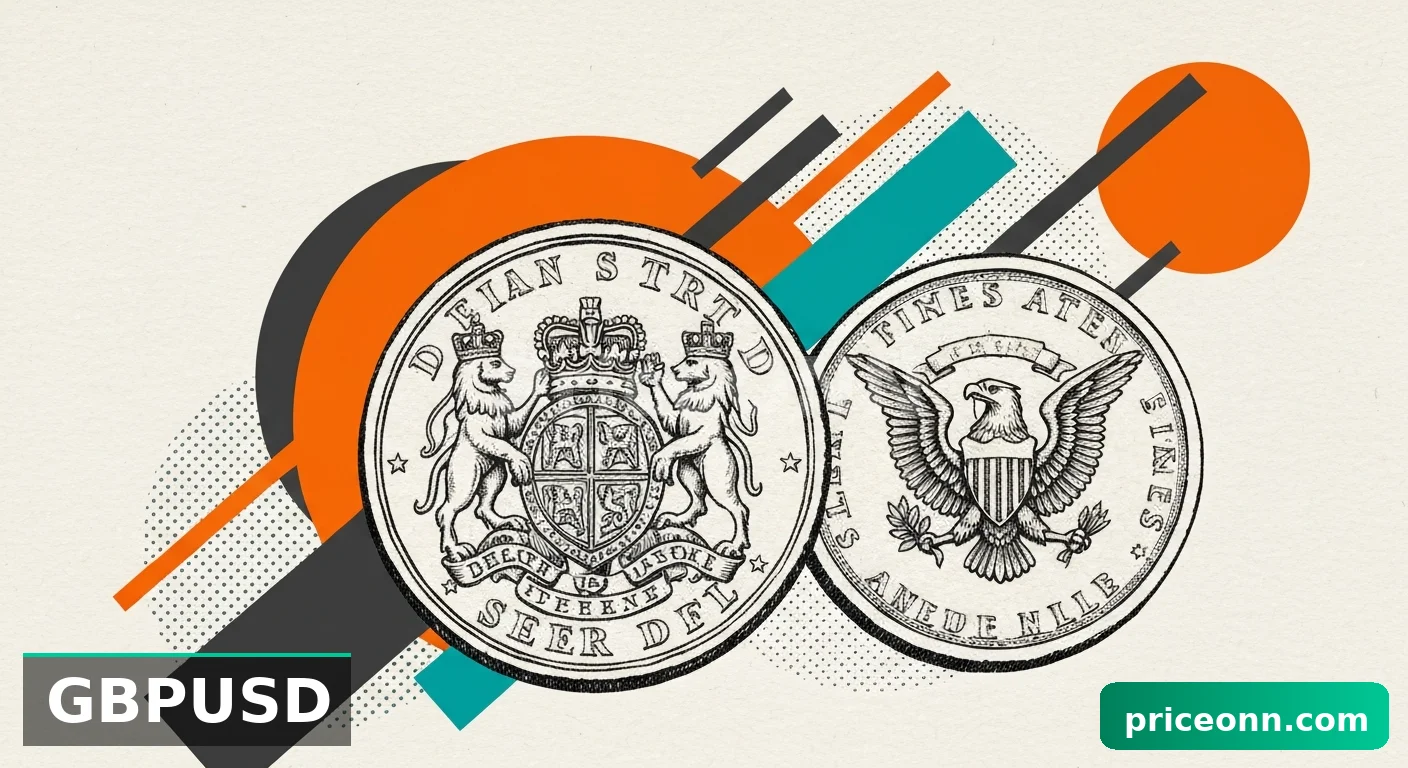
The Dollar Index (DXY) is currently trading at 99.57, showing a significant daily gain of 0.31%. This strengthening dollar is a key factor influencing other markets. For forex pairs, it means potential weakness in currencies like EUR/USD (currently at 1.1537) and GBP/USD (at 1.33115), as well as pressure on commodity-linked currencies like AUD/USD (0.69629) and NZD/USD (0.5795). The correlation is direct: a stronger dollar often implies tighter global liquidity and reduced appetite for riskier assets.
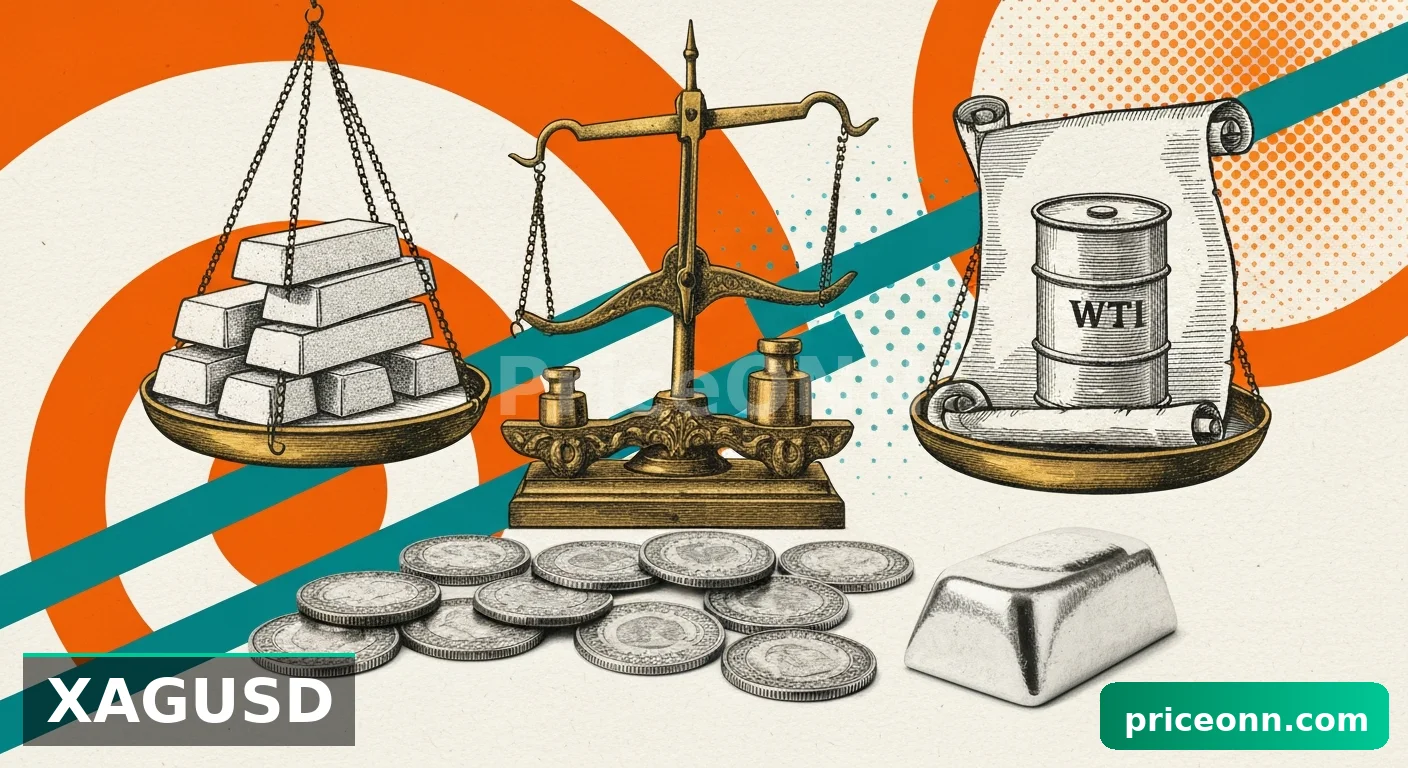
For commodities, the impact is mixed but leans negative for non-interest-bearing assets like gold. While inflation fears usually support gold, the combination of a stronger dollar and rising real yields (as markets price in rate hikes) can counteract this. Gold is currently trading around $4,460, down significantly today, reflecting this complex interplay. Silver is also under pressure, testing critical support around $60.
Energy prices, however, are a notable exception, driven by supply-side concerns related to geopolitical events. Brent crude is above $113 and WTI is above $100. This surge in oil prices is a primary driver of inflation fears, creating the very conditions that could lead central banks to tighten policy further. This creates a challenging environment for the SP500, as it faces both rising input costs and the prospect of higher borrowing costs.
Frequently Asked Questions: SP500 Analysis
What happens if SP500 breaks below the $6,461.53 support level?
A break below the critical daily support at $6,461.53 would likely trigger further selling, invalidating the potential for a short-term bounce. The next significant downside target would be $6,387.47, with further acceleration possible towards $6,301.73 if momentum picks up.
Should I buy SP500 at current levels of $6,460.40 given the oversold RSI?
While the daily RSI(14) at 29.1 is oversold, suggesting a potential bounce, the strong daily trend (ADX 46.24) and negative MACD indicate significant downside risk remains. A cautious approach is advised; waiting for confirmation of a hold above $6,461.53 and a break of resistance at $6,471.60 would be prudent.
Is the RSI at 32.74 on the 1-hour chart a reliable sell signal for SP500?
An RSI of 32.74 on the 1-hour chart indicates waning downward momentum but is not a definitive sell signal in itself. It suggests the immediate selling pressure might be easing, potentially leading to a short-term consolidation or bounce. However, it should be considered alongside other indicators like MACD and ADX, which still point to a bearish trend.
How will continued Fed rate hike fears affect SP500 this week?
Persistent fears of Fed rate hikes will likely continue to pressure the SP500, especially if accompanied by strong inflation data or hawkish central bank commentary. This scenario could lead to further testing of support levels around $6,461.53, as investors reduce exposure to risk assets in anticipation of tighter monetary policy.
Track markets in real-time
AI-powered analysis, technical indicators and real-time price data.
Join Our Telegram Channel
Breaking market news, AI analysis and trading signals instantly.
Join Channel