DowJones30 Tests $45,313.50 Support: Bears Tighten Grip
DowJones30 is currently testing critical support at $45,313.50. With RSI at 34.12 on the 1H chart and ADX showing a strong 39.11 downtrend, bears appear to be in control as the index struggles to hold key levels.
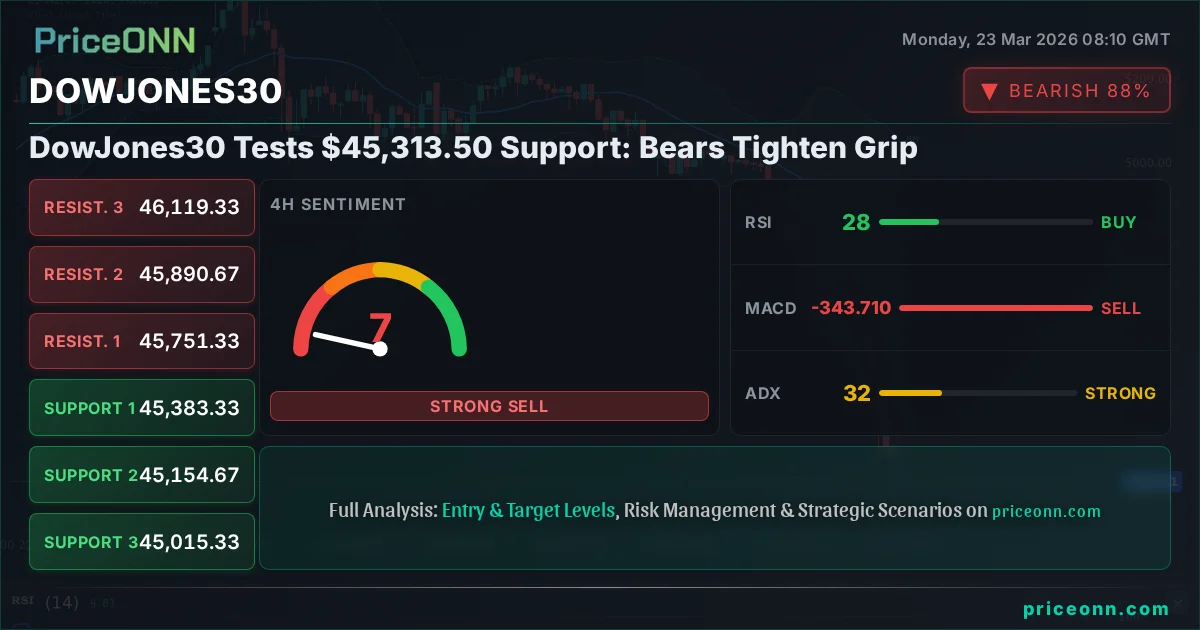
This is where the rubber meets the road for the DowJones30. After a sharp sell-off that saw the index shed 1.06% or 484.5 points yesterday, we're seeing the blue-chip average hover precariously around the $45,313.50 mark. This isn't just another trading day; it's a crucial juncture where the bulls are fighting desperately to defend territory against an increasingly aggressive bearish sentiment. The question on every trader's mind right now is whether this $45,313.50 level will hold, or if it's merely a brief pause before the next leg down. The signals from the technical indicators are flashing red, suggesting that the bears are indeed gaining the upper hand and that further downside could be on the cards if this support crumbles.
- With RSI at 34.12 on the 1H chart, it signals considerable selling pressure, though not yet in extreme oversold territory.
- Critical support sits at $45,313.50, a level the DowJones30 is currently testing after a significant daily decline.
- The MACD histogram shows negative momentum on the 1H chart, indicating bearish sentiment is building.
- The strong ADX reading of 39.11 on the 1H chart confirms a robust downtrend is in play.
The recent price action paints a grim picture for the DowJones30. A daily drop of 1.06%, culminating in a current price of $45,313.50, isn't just a blip; it's a significant move that speaks volumes about the prevailing market sentiment. This decline wasn't isolated; it occurred within a broader market context where risk appetite is clearly waning. The SP500 saw a 1.23% drop, and the Nasdaq100 followed suit with a 1.35% fall, indicating a widespread equity sell-off. This correlated weakness suggests that traders are moving away from riskier assets, and the DowJones30, despite its blue-chip status, is not immune to this broader de-risking trend. The strength in the Dollar Index (DXY), which rose 0.33% to 99.59, further exacerbates the pressure on risk assets, including equities, as higher rates and a stronger dollar typically make equities less attractive.
Digging into the technicals on the 1-hour chart, the picture for the DowJones30 is decidedly bearish. The Relative Strength Index (RSI) sits at 34.12, firmly in neutral territory but leaning towards oversold conditions, suggesting that while selling pressure is strong, there might be some room for further decline before extreme exhaustion sets in. More concerning is the MACD, which is showing negative momentum with the MACD line below the signal line, reinforcing the bearish bias. The ADX, a measure of trend strength, is at a robust 39.11 on the 1H timeframe, indicating a strong downtrend is firmly established. This isn't a fleeting dip; it's a committed bearish move. Even on the 4-hour chart, the trend remains strongly bearish with an ADX of 32, and on the daily chart, the trend is overwhelmingly bearish with an ADX of 43.32, confirming that the bears are in control across multiple timeframes.
Looking at the immediate support and resistance levels derived from the live data, the $45,313.50 level is indeed a critical pivot. Below it, the next significant support lies at $45,203.67 (S1), followed by $45,120.33 (S2). A decisive break below $45,313.50 could quickly target these lower levels. On the upside, resistance is stacked up, starting with $45,409.67 (R1). For the bulls to even contemplate a recovery, they would need to convincingly reclaim and hold above $45,409.67, which seems like a tall order given the current momentum. The fact that the index is testing $45,313.50 after such a sharp decline suggests that the path of least resistance is currently downwards. The market sentiment analysis, reflected in the broad equity sell-off and the strengthening dollar, further supports this bearish outlook.
Why DowJones30 Volatility Analysis Points to a Downside Risk
The volatility analysis on the DowJones30 doesn't offer much comfort to the bulls right now. The significant daily price range observed, coupled with the sharp percentage drop, indicates that market participants are actively participating in the downward move. On the 1-hour chart, the Bollinger Bands are widening as the price moves below the middle band, a classic sign of increasing bearish momentum. The Stochastic Oscillator, with %K at 23.25 and %D at 31.23 on the 1H, is in oversold territory but still trending downwards, signalling that downward pressure could persist. This confirms the readings from RSI and MACD, painting a consistent picture of bearish dominance. The strength of the trend, as indicated by the ADX, is particularly noteworthy. An ADX of 39.11 on the 1H and 43.32 on the daily chart signifies a strong, established trend, meaning that attempts to reverse it will likely face significant headwinds and require substantial buying pressure.
The correlation with broader market movements cannot be overstated here. When major indices like the SP500 and Nasdaq100 are experiencing sharp declines, it invariably creates a ripple effect across the market. The current environment, characterized by rising energy prices – Brent crude is up 0.75% to $113.47 and WTI surged 2.55% to $100.84 – and persistent inflation fears, is leading investors to reassess their risk exposure. Escalating geopolitical tensions, as hinted at by market news regarding the Middle East, further fuel these fears, pushing investors towards safer assets. The DXY's rise to 99.59 is a direct consequence of this risk-off sentiment, and its strength typically weighs on global indices. This interconnectedness means that any significant move in these correlated assets will likely have a direct impact on the DowJones30's trajectory.
What the MACD Signal Tells Us About DowJones30 Trend Analysis
Delving deeper into the MACD indicator on the 1-hour chart for the DowJones30 reveals a clear bearish signal. The MACD line is trading below the signal line, and the histogram is printing negative values, indicating that the short-term momentum is weaker than the medium-term momentum, and importantly, that selling pressure is increasing. This divergence between the MACD and its signal line is a classic bearish signal, often preceding further price declines. While the MACD itself doesn't dictate price, it serves as a strong confirmation tool for the trend observed in price action. On the 4-hour and daily charts, the MACD continues to show negative momentum, reinforcing the bearish outlook. This consistent bearish signal across different timeframes suggests that traders should be wary of any upward bounces, as they may represent short-lived opportunities for profit-taking or bear market rallies rather than a genuine trend reversal.
The strength of the current downtrend is further validated by the ADX indicator. On the 1-hour chart, an ADX reading of 48.17 points to a very strong trend. On the 4-hour chart, it's 31.01, and on the daily chart, it's a formidable 46.26. These readings confirm that the market is not in a choppy, indecisive state but is experiencing a powerful directional move. When the ADX is this high, it implies that the trend is well-established and likely to continue until strong counter-signals emerge or significant price levels are breached. For traders, this means that the probability of riding the existing trend is higher than betting on a reversal, especially in the short to medium term. The market is currently favouring sellers, and any attempt by buyers to regain control will need to overcome significant momentum.
DowJones30 Price Forecast: Key Levels to Watch
The immediate focus for the DowJones30 remains on the $45,313.50 support level. A breach below this critical price point would likely trigger a cascade of selling as stop-loss orders are hit, potentially sending the index down towards the $45,203.67 and $45,120.33 support levels. On the flip side, any attempt at a recovery would need to overcome the resistance at $45,409.67. A sustained move above this level, ideally with increasing volume, could signal a short-term bottoming process. However, given the confluence of bearish technical indicators and the broader risk-off market sentiment, such a scenario appears less probable in the immediate future. The current market structure suggests that the bears have the advantage, and traders should be looking for signs of further weakness rather than premature bullish entries.
The correlation between the DowJones30 and other major indices, as well as the DXY, is a key factor to monitor. The fact that the SP500 and Nasdaq100 are also in sharp decline, coupled with the DXY's upward momentum, creates a reinforcing bearish environment for equities. This suggests that the DowJones30's movements are not happening in isolation but are part of a broader market trend. If the DXY continues to climb, driven by inflation fears and potential rate hike prospects as suggested by recent market commentary, it will likely continue to exert downward pressure on the DowJones30. Conversely, any sign of the DXY faltering or major indices finding a bottom could provide a much-needed reprieve for the DowJones30, but the current data does not support such optimism.
DowJones30 Trading Signals: Navigating the Bearish Trend
Given the prevailing technical signals and market conditions, the trading landscape for the DowJones30 appears challenging for the bulls. The overwhelming number of 'Sell' signals across multiple timeframes, particularly on the 1-hour and 4-hour charts, suggests a cautious approach is warranted. The ADX readings are particularly strong, indicating that this is not a time to fight the trend. For short-term traders, looking for opportunities to short on bounces towards resistance levels like $45,409.67 might be a strategy, with a tight stop-loss above that level. However, the risk of a sharp reversal, while currently low in terms of probability, cannot be entirely discounted. Long-term investors might see the current levels as potential opportunities, but the technical indicators suggest that further downside is more probable before any significant bottom is formed. Patience and risk management are paramount in this environment.
The data from the Stochastic Oscillator also adds to the bearish conviction. On the 1-hour chart, %K at 23.25 and %D at 31.23 indicate oversold conditions, but the downward trend suggests these levels can hold for some time. On the 4-hour chart, it's even more pronounced, with K=28.19 and D=30.59, still trending down. This means that while the index is technically oversold on shorter timeframes, the trend remains firmly in place, and we could see these oversold conditions persist or even deepen before a meaningful bounce occurs. The daily chart Stochastic shows K=10.1 and D=14.82, firmly in oversold territory, but this is a daily reading, and the trend strength (ADX 43.32) suggests that even oversold conditions can remain for extended periods in a strong downtrend. Therefore, relying solely on oversold Stochastic readings for a buy signal would be a risky strategy right now.
DowJones30 Market Sentiment: Bears in the Driving Seat
The overall market sentiment surrounding the DowJones30 is unequivocally bearish. The sharp decline yesterday, coupled with the negative technical indicators across multiple timeframes, points to a lack of confidence among investors. The news flow, hinting at escalating geopolitical tensions and persistent inflation fears, only serves to amplify this negative sentiment. This creates a self-reinforcing cycle: negative sentiment leads to selling, which pushes prices lower, which in turn fuels more negative sentiment. The fact that the DXY is showing strength adds another layer to this bearish narrative, as a strong dollar typically correlates with weaker equity markets, especially for indices that are sensitive to global capital flows.
The DowJones30's performance is also being influenced by broader economic concerns. While specific economic calendar data wasn't provided for this immediate analysis, the general market narrative often revolves around inflation, interest rate expectations, and the potential for economic slowdowns. If upcoming economic data were to surprise to the downside, or if central banks signal a more hawkish stance than anticipated, it could further cement the bearish trend. Conversely, any unexpectedly positive economic news or a clear signal from central banks that inflation is under control could potentially shift sentiment. However, based on the current technical picture and the prevailing risk-off environment, the bears have a clear advantage.
Bearish Scenario: Continued Downtrend
70% ProbabilityNeutral Scenario: Consolidation at Support
20% ProbabilityBullish Scenario: Short-Term Bounce
10% ProbabilityFrequently Asked Questions: DowJones30 Analysis
What happens if the DowJones30 breaks decisively below the $45,313.50 support level?
If the DowJones30 closes below $45,313.50, expect a rapid move towards the next support at $45,203.67, and potentially $45,120.33 as the bearish trend strengthens. This would be confirmed by continued negative MACD momentum and a strong ADX reading.
Should I consider buying the DowJones30 at current levels near $45,313.50 given the oversold Stochastic readings?
While the Stochastic is oversold on the 1H chart (K=23.25, D=31.23), the overall trend strength (ADX 39.11) suggests that oversold conditions can persist. A contrarian buy at this level carries significant risk; it would be prudent to wait for a confirmed bounce and a break above $45,409.67 resistance before considering long positions.
Is the RSI at 34.12 on the 1H chart a reliable sell signal for the DowJones30 right now?
An RSI of 34.12 indicates selling pressure but is not yet in extreme oversold territory (typically below 30). It aligns with the broader bearish trend confirmed by MACD and ADX. While it suggests weakness, it's more of a confirmation of the downtrend rather than an independent sell signal on its own.
How might the rising DXY at 99.59 and geopolitical fears impact the DowJones30's short-term outlook?
The strengthening DXY at 99.59 typically exerts downward pressure on global equities like the DowJones30. Combined with escalating geopolitical tensions that dampen risk appetite, this creates a challenging environment. Expect continued headwinds for the DowJones30 unless the DXY falters or risk sentiment dramatically improves.
The path forward for the DowJones30 hinges on its ability to hold the $45,313.50 support. The technical indicators overwhelmingly suggest that bears are in the driver's seat, supported by a broader risk-off sentiment and a strengthening dollar. While a short-term bounce is a low-probability scenario, the prevailing trend points towards further downside. Traders should remain vigilant, manage risk meticulously, and wait for clear confirmation signals before committing to any positions. The market always provides opportunities, but patience and discipline are key to navigating these choppy waters.
Track markets in real-time
AI-powered analysis, technical indicators and real-time price data.
Join Our Telegram Channel
Breaking market news, AI analysis and trading signals instantly.
Join Channel