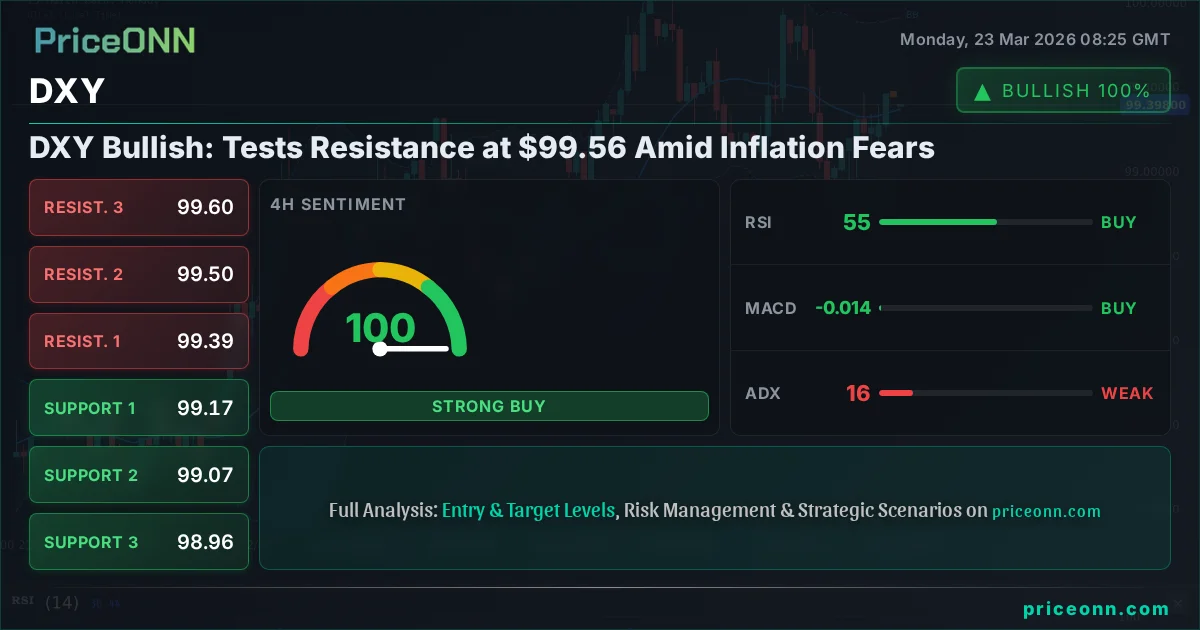
DXY Bullish: Tests Resistance at $99.56 Amid Inflation Fears
The DXY Dollar Index is testing resistance at $99.56. Persistent inflation and geopolitical tensions fuel Fed rate hike expectations, strengthening the dollar.
The relentless march of inflation and escalating geopolitical tensions across the globe are creating a potent cocktail of uncertainty, and the US Dollar Index (DXY) is currently reflecting this complex environment as it approaches a critical resistance level at $99.56. This DXY today analysis delves into the intricate dance between market sentiment, central bank expectations, and technical indicators, seeking to uncover the path forward for the world's reserve currency. With the DXY currently trading at $99.56, traders are keenly watching to see if the dollar can sustain its upward momentum or if it will falter at this key juncture.
- RSI at 63.52 signals overbought pressure on the 1H chart, suggesting potential consolidation or pullback.
- Critical resistance sits at $99.56, a level the DXY is currently testing and must decisively break to continue its bullish trend.
- MACD histogram shows positive momentum on the 1H and 4H charts, indicating underlying strength, but ADX readings suggest a potentially choppy market.
- Fed rate hike expectations, fueled by persistent inflation data and geopolitical instability, are the primary driver for the dollar's strength.
Navigating the Dollar's Ascent: A Technical Perspective
The DXY's journey towards $99.56 has been characterized by a gradual build-up of bullish momentum, particularly noticeable across the shorter timeframes. On the 1-hour chart, the trend is currently neutral with a 50% strength, yet the ADX at 19.53 indicates a weak trend, suggesting that the current upward move might lack sustained conviction. However, the Stochastic Oscillator is flashing an overbought signal with %K at 94.1 and %D at 76.74, pointing towards a potential short-term pause or reversal. Despite this, the MACD remains in positive territory, with its histogram above the signal line, reinforcing the bullish sentiment. The RSI at 63.52 hovers in neutral territory, leaning towards a more bullish inclination, but not yet in the extreme overbought zone that would typically signal an immediate reversal. This mixed picture on the 1-hour chart suggests caution, with the market potentially consolidating before the next significant move.
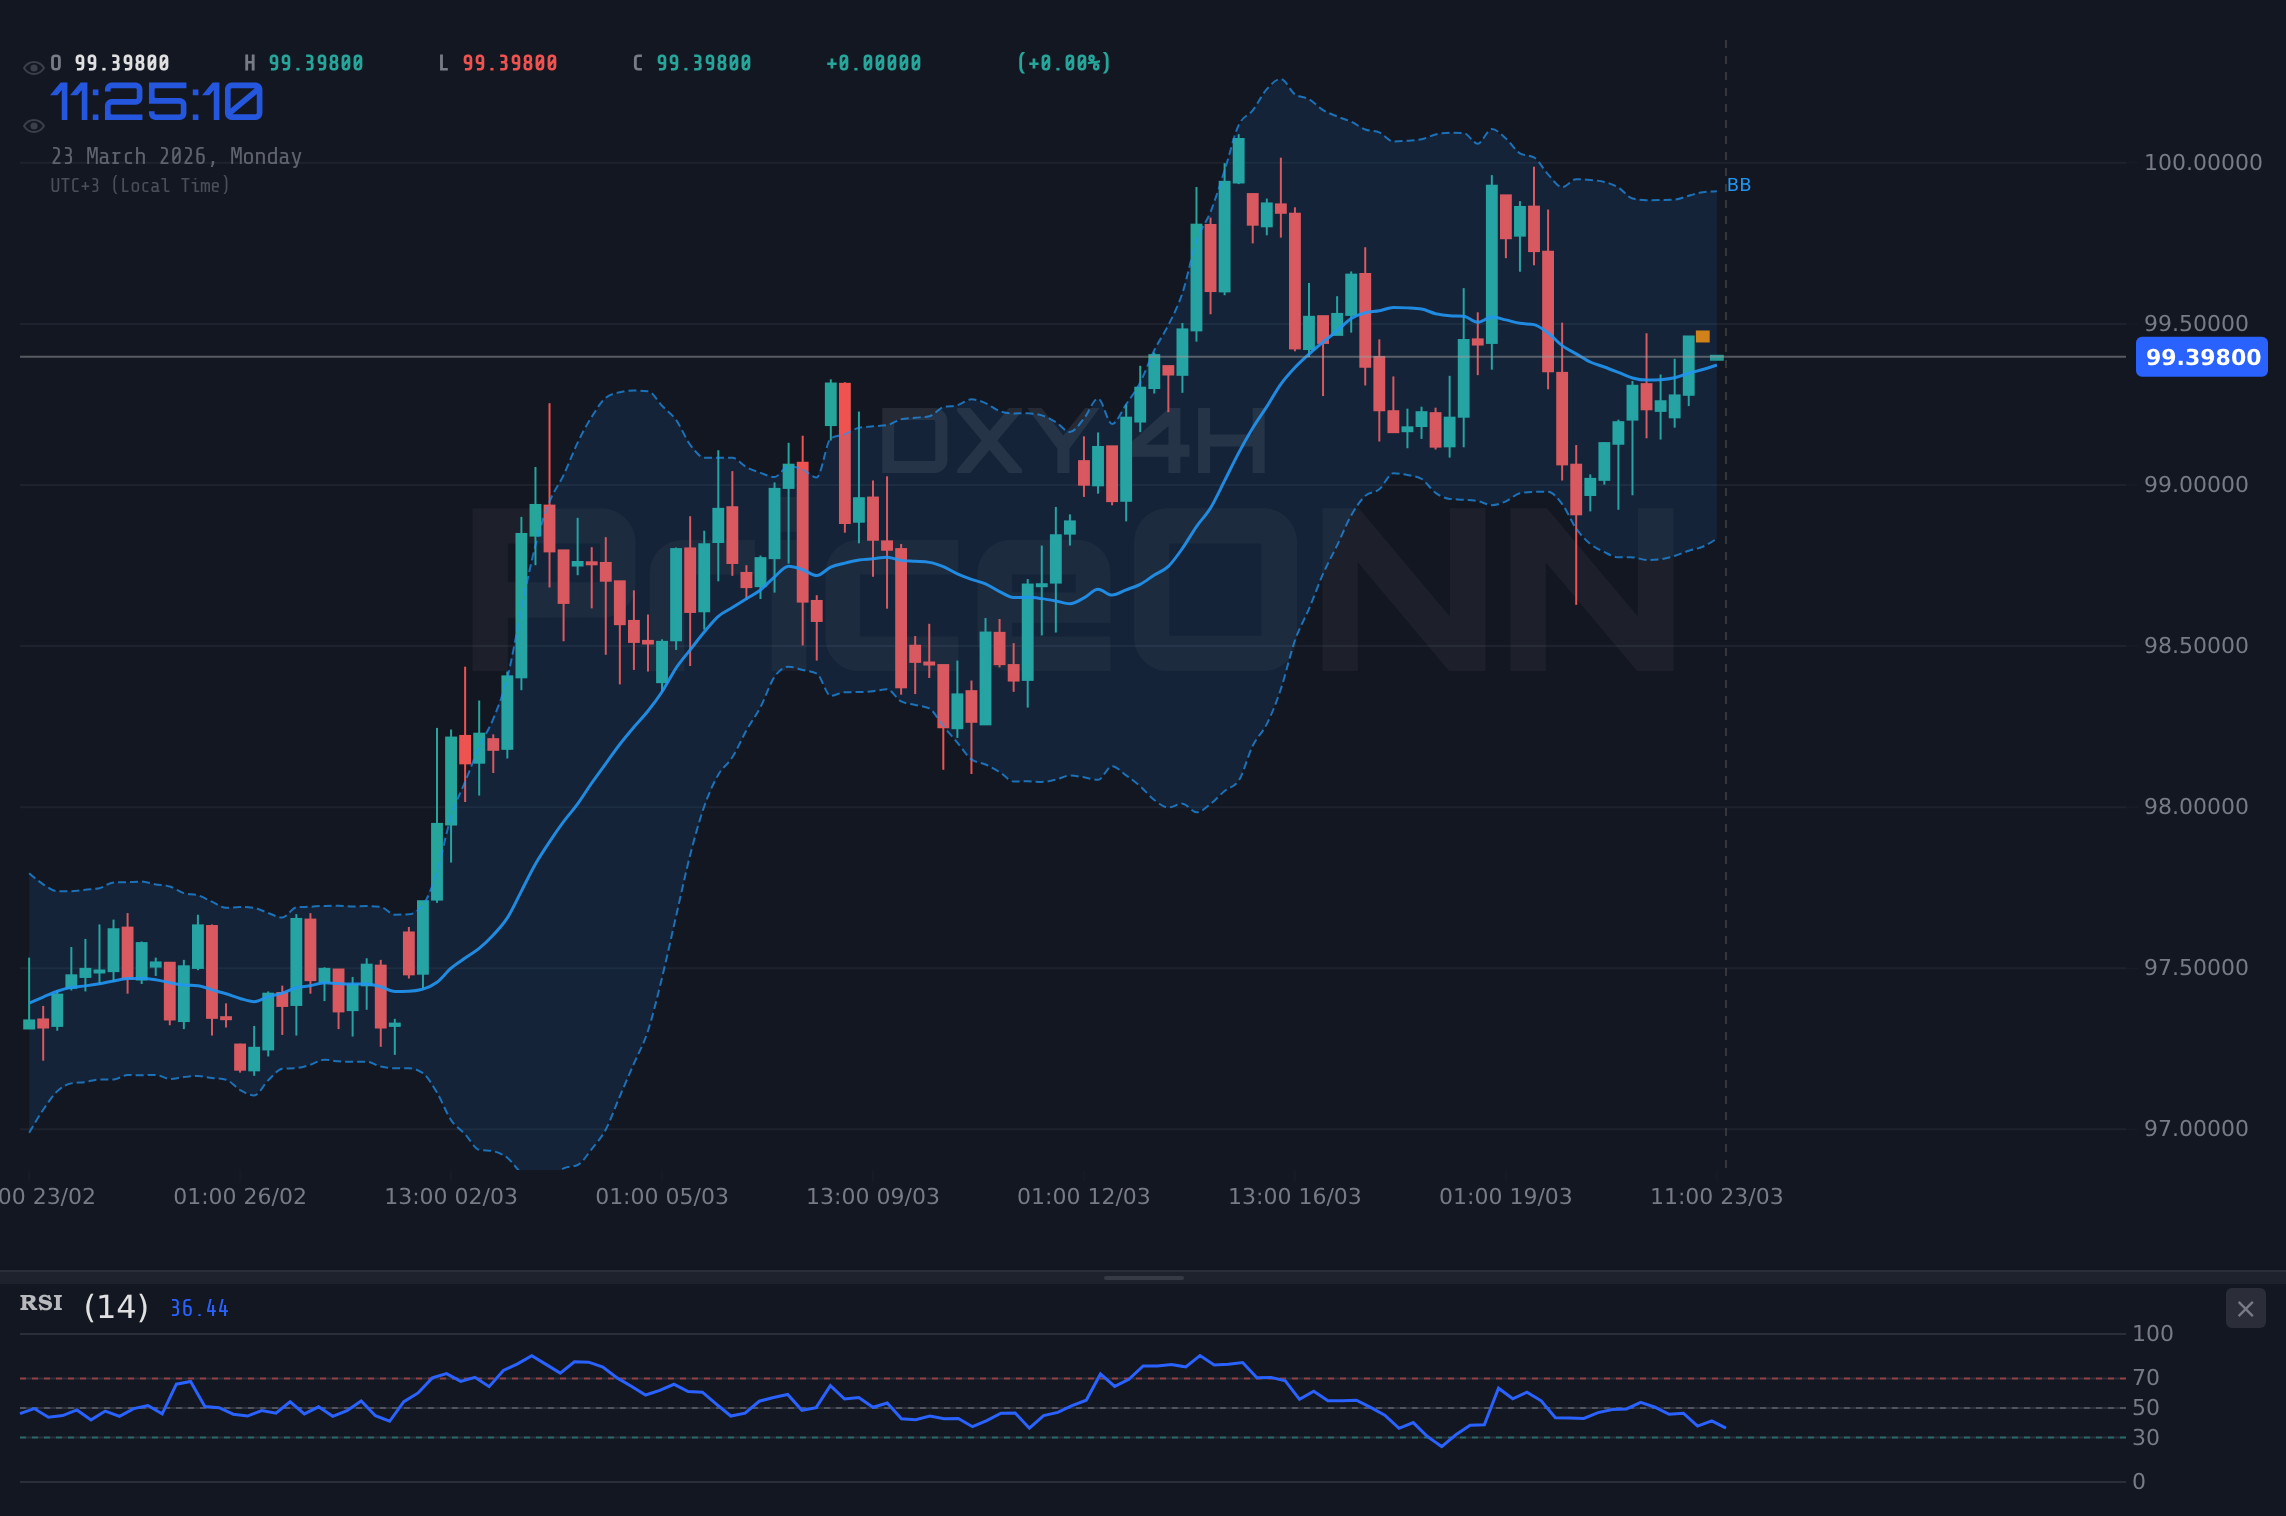
Looking at the 4-hour timeframe, the DXY trend strengthens to bullish with 88% power. Here, the RSI at 56.18 is comfortably in neutral territory, showing room for further upside. The MACD continues its positive trajectory, and the Stochastic Oscillator, while still showing strength with %K at 75.24, is not yet in the extreme overbought zone. The ADX at 16.49, however, reinforces the idea of a weak trend, hinting that this bullish move might be more of a grind than a surge. This is where you need to pay attention; the dollar is showing signs of life, but the underlying trend strength indicators are not screaming 'breakout' yet. Price action is key here. The price is currently trading above the middle Bollinger Band, indicating a bullish inclination on this timeframe, but the overall trend strength remains subdued, suggesting that significant price discovery might be limited until clearer directional signals emerge.
The daily chart paints a more robust picture of bullish sentiment, with the DXY trend classified as bullish with 92% strength. The RSI at 59.51 is in neutral territory, suggesting ample room for the index to appreciate further without immediately triggering overbought conditions. The MACD is firmly in positive momentum, with its histogram comfortably above the signal line, a classic bullish signal. The Stochastic Oscillator, however, presents a conflicting signal, with %K at 56.32 and %D at 69.27, suggesting a potential bearish divergence or a pullback is imminent as %K crosses below %D. The ADX at 34.82 indicates a strong uptrend, which is a significant positive for dollar bulls. This confluence of a strong daily trend with conflicting signals from the Stochastic Oscillator highlights the current market tension. Bulls are pushing higher, but the potential for a pullback is amplified by this divergence, making the $99.56 resistance level even more critical.
The Critical Juncture at $99.56
The DXY's current position at $99.56 is more than just a price point; it represents a battleground for market conviction. On the daily chart, the immediate resistance levels are pegged at $99.51 and $99.77, with further upside targets at $100.07. A decisive break and sustained hold above $99.56 could signal a continuation of the bullish trend, potentially targeting the $100.07 level and beyond. Conversely, failure to overcome this resistance could lead to a pullback, with initial support found at $99.39, followed by $99.17 and $98.96. The current market structure, with its mixed signals across different timeframes, suggests that the price action around $99.56 will be pivotal in determining the next direction. If the dollar fails to break higher, we could see a retest of lower levels, especially if risk appetite improves or if Fed rate hike expectations begin to moderate.
The Macroeconomic Undercurrents: Inflation and Geopolitics
The strength observed in the DXY is not occurring in a vacuum. Persistent inflation concerns continue to be a dominant theme in global financial markets. Recent economic data, though not explicitly detailed here, continues to paint a picture of an economy still grappling with elevated price pressures. This environment keeps the Federal Reserve on a hawkish footing, with market participants increasingly pricing in the possibility of further interest rate hikes or a slower pace of rate cuts than previously anticipated. The CME FedWatch tool, if it were showing data, would likely reflect this heightened expectation. This divergence in monetary policy expectations, with the Fed perceived as more hawkish than other major central banks like the ECB or BoJ, provides a fundamental tailwind for the US dollar. The market's pricing of future Fed actions is a critical driver, and any deviation from hawkish expectations could quickly shift the DXY's trajectory.
Adding another layer of complexity are the escalating geopolitical tensions. While the specific details of current conflicts are dynamic, their impact on global risk sentiment is undeniable. Typically, periods of heightened geopolitical uncertainty tend to drive safe-haven flows towards assets like the US dollar, US Treasuries, and gold. However, the current situation presents a more nuanced picture. The rise in oil prices, for instance, driven by these geopolitical fears, could paradoxically fuel inflation further, complicating the Fed's path and potentially reinforcing the case for a strong dollar. The AUD/JPY retreating below 111.70 and Silver facing a critical test around $60, as reported in recent news, are indicators of this broader risk-off sentiment. The DXY's ability to benefit from these 'risk-off' events, as seen in its upward move towards $99.56, underscores its role as a primary safe-haven asset in times of global stress. However, the correlation is not always straightforward; a surge in oil prices, while increasing inflation, can also weigh on global growth, creating a tug-of-war for dollar sentiment.
The Fed's Tightrope Walk: Rates, Inflation, and the Dollar
The Federal Reserve faces a delicate balancing act. On one hand, sticky inflation necessitates a firm stance on monetary policy to ensure price stability. On the other hand, concerns about potential economic slowdowns and the impact of higher interest rates on growth require careful consideration. The market is currently pricing in a scenario where the Fed might need to maintain higher rates for longer, or even consider further hikes if inflation proves more stubborn than expected. This expectation is a significant tailwind for the DXY. If upcoming economic data, such as employment figures or inflation reports, surprise to the upside, it could further solidify the hawkish Fed narrative and push the DXY higher. Conversely, any signs of cooling inflation or a significant economic downturn could prompt a reassessment of Fed policy, potentially leading to dollar weakness. The interplay between incoming data and the Fed's communication will be crucial in shaping the DXY's path in the coming weeks. The market's reaction to Fed speeches and policy minutes will be closely scrutinized for clues about the future path of interest rates, a key determinant of dollar strength.
Correlation Analysis: DXY, Equities, and Gold
The DXY's performance is intrinsically linked to other major market assets, offering valuable insights into overall market sentiment. Typically, a strengthening dollar exerts downward pressure on gold prices (XAU/USD), as seen with gold dipping to $4,460 amid a stronger dollar. The current data shows XAUUSD trading at $4215.71, significantly down from recent highs, with its 1-hour RSI at 18.11 and 4-hour RSI at 11.74 indicating extreme oversold conditions, a stark contrast to the DXY's bullish trend. This inverse correlation is a classic market dynamic. Similarly, a stronger dollar often correlates with a risk-off environment, leading to declines in equity indices like the S&P 500 and Nasdaq. The S&P 500 is currently down 1.18% at 6458.75, and the Nasdaq is down 1.27% at 23687.11, both exhibiting strong downtrends. This risk-off sentiment, while generally supporting the dollar as a safe haven, also creates a complex feedback loop. If the equity sell-off intensifies, it could trigger broader market panic, potentially leading to a flight to safety that further boosts the DXY, but it could also signal a global economic slowdown that eventually weighs on all risk assets, including the dollar.
The relationship is not always linear. For instance, while the DXY's rise might pressure EUR/USD, which is currently at 1.15377 and showing a bearish trend on the daily chart, the underlying reasons for dollar strength matter. If the dollar is strengthening due to robust US economic performance relative to other regions, it might coincide with a more stable or even rising risk appetite. However, in the current environment, the dollar's strength appears to be driven more by safe-haven demand and Fed hawkishness, which often accompany broader market weakness. This means that a rising DXY might be a sign of underlying global economic stress, rather than pure US exceptionalism. The fact that Brent crude oil prices have surged past $100, as reported, adds another layer of complexity, potentially fueling inflation and reinforcing the Fed's hawkish stance, but also posing risks to global growth and thus indirectly to dollar demand.
Forecasting the DXY's Next Move: Scenarios and Probabilities
Given the technical indicators and macroeconomic backdrop, several scenarios are plausible for the DXY. The current price action around $99.56 is the focal point. If the dollar index can decisively break above this resistance, supported by strong economic data or hawkish Fed commentary, it could signal a continuation of its bullish trend. This would likely be accompanied by further weakness in risk assets and potentially gold. Conversely, if the DXY fails to clear $99.56 and begins to retreat, particularly if key support levels like $99.39 or $99.17 are broken, it could indicate a short-term reversal. This would likely coincide with a pickup in risk appetite and a potential bounce in equities and commodities. A neutral scenario involves consolidation around the current levels, with the DXY trading within a tight range as the market awaits clearer directional catalysts. The prevailing macroeconomic forces - inflation and geopolitical risk - suggest that volatility will remain elevated, making clear directional trades challenging without strong confirmation.
Bullish Scenario: Dollar Strength Continues
60% ProbabilityConsolidation Scenario: Range-Bound Volatility
30% ProbabilityBearish Scenario: Dollar Reversal Looms
10% ProbabilityFrequently Asked Questions: DXY Analysis
What happens if DXY breaks decisively above the $99.56 resistance level?
A sustained break above $99.56, confirmed by daily closes, would validate the bullish scenario, potentially targeting $99.77 and then the key psychological level at $100.07. This would likely coincide with increased pressure on risk assets and commodities.
Should I consider buying DXY at current levels near $99.56 given the mixed signals?
Caution is advised due to conflicting signals across timeframes and a weak ADX. While the daily trend is bullish, shorter-term overbought conditions and a lack of strong trend conviction suggest waiting for a confirmed breakout above $99.56 or a pullback to clear support levels before entering long positions.
Is the RSI at 63.52 on the 1-hour chart a sell signal for DXY right now?
An RSI of 63.52 is not an immediate sell signal; it indicates a strong upward move but is not yet in the extreme overbought territory. However, it does suggest that the market may be getting stretched on the short-term timeframe, increasing the probability of a pause or minor pullback before further upside.
How will upcoming inflation data and geopolitical events impact DXY this week?
If inflation data comes in hotter than expected or geopolitical tensions escalate further, it would likely reinforce the Fed's hawkish stance and boost the DXY towards resistance levels. Conversely, any signs of cooling inflation or de-escalation could lead to profit-taking and a DXY pullback.
| Indicator | Value | Signal | Interpretation |
|---|---|---|---|
| RSI (14) | 63.52 | Neutral | Bullish momentum, but room to move higher. |
| MACD Histogram | Positive | Bullish | Positive momentum continues. |
| Stochastic (%K/%D) | 94.1 / 76.74 | Bearish Divergence | Overbought, potential pullback signal on 1H. |
| ADX | 19.53 | Weak Trend | Lacks strong directional conviction on 1H. |
| Bollinger Bands | Above Mid-Band | Bullish | Price action favors upside on 1H. |
The DXY is at a critical juncture, hovering near $99.56 as inflation concerns and geopolitical risks continue to fuel hawkish expectations for the Federal Reserve. While technical indicators present a mixed picture across different timeframes, the overall daily trend remains bullish, suggesting potential for further upside. However, the overbought Stochastic on the 1-hour chart and the weak ADX readings warrant caution. Patience and a disciplined approach will be key for traders. Waiting for a clear breakout above resistance or a confirmed move below support will be crucial for navigating this market. Volatility creates opportunity, and for those prepared to manage risk, the DXY's current setup offers compelling scenarios to monitor.
Märkte in Echtzeit verfolgen
KI-gestützte Analyse und Echtzeit-Preisdaten.
Treten Sie unserem Telegram-Kanal bei
Aktuelle Marktnachrichten und KI-Analysen sofort.
Kanal beitreten