NZDUSD Dips to $0.57923: Bears Eyeing Support Amidst Geopolitical Turmoil
NZDUSD trades at $0.57923 as geopolitical fears and a stronger USD weigh on the pair. Technicals show a strong downtrend, with key support at $0.57991.
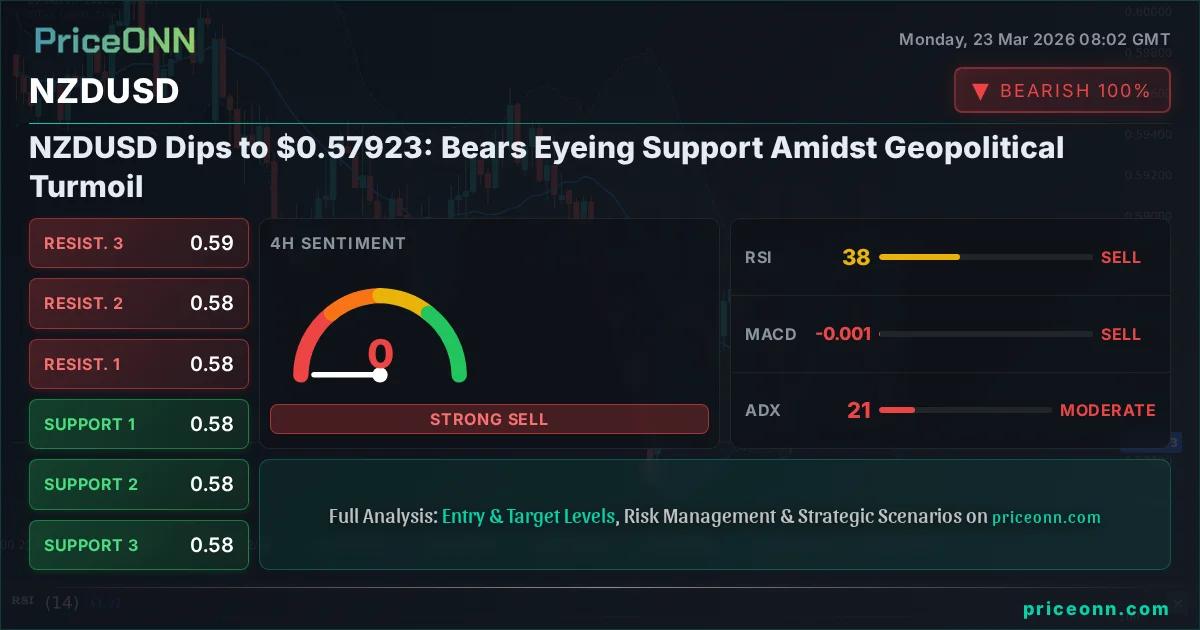
The New Zealand Dollar is facing significant headwinds, with NZDUSD dipping below the critical $0.58 level and currently trading at $0.57923. This slide is being driven by a confluence of escalating geopolitical tensions and a resurgent US Dollar, painting a challenging picture for the pair in the short term. Market sentiment has soured, pushing investors towards safer assets and away from riskier currencies like the Kiwi.
- RSI at 25.8 signals extreme oversold conditions, suggesting potential for a short-term bounce but not a trend reversal.
- Critical support sits at $0.57991, tested multiple times and now acting as a key level to watch.
- The MACD histogram shows negative momentum, indicating bearish pressure is still dominant.
- Fed rate hike expectations are driving DXY strength, correlating with NZDUSD weakness.
The prevailing narrative in the FX markets is one of caution, fueled by anxieties emanating from the Middle East and concerns over persistent inflation globally. These factors are bolstering demand for the US Dollar, which is strengthening against its major counterparts. For NZDUSD, this means the downward pressure is likely to persist as long as the Dollar Index (DXY) remains on a firm footing. The DXY is currently trading at 99.63, showing a clear upward trajectory that typically spells trouble for risk-sensitive currencies.
Technically, the NZDUSD pair is exhibiting a pronounced downtrend across multiple timeframes. On the 1-hour chart, the trend is firmly downwards with 100% strength, supported by a multitude of indicators. The Relative Strength Index (RSI) at 25.8 is deep in oversold territory, which, while signaling a potential for a short-term relief rally, also underscores the sheer selling pressure in the market. Similarly, the Stochastic Oscillator is showing K=7.23 and D=10.92, also deeply oversold and favoring further downside before any significant recovery can take hold. The ADX at 44.44 on the 4-hour chart confirms a strong downtrend, indicating that momentum is firmly with the sellers.
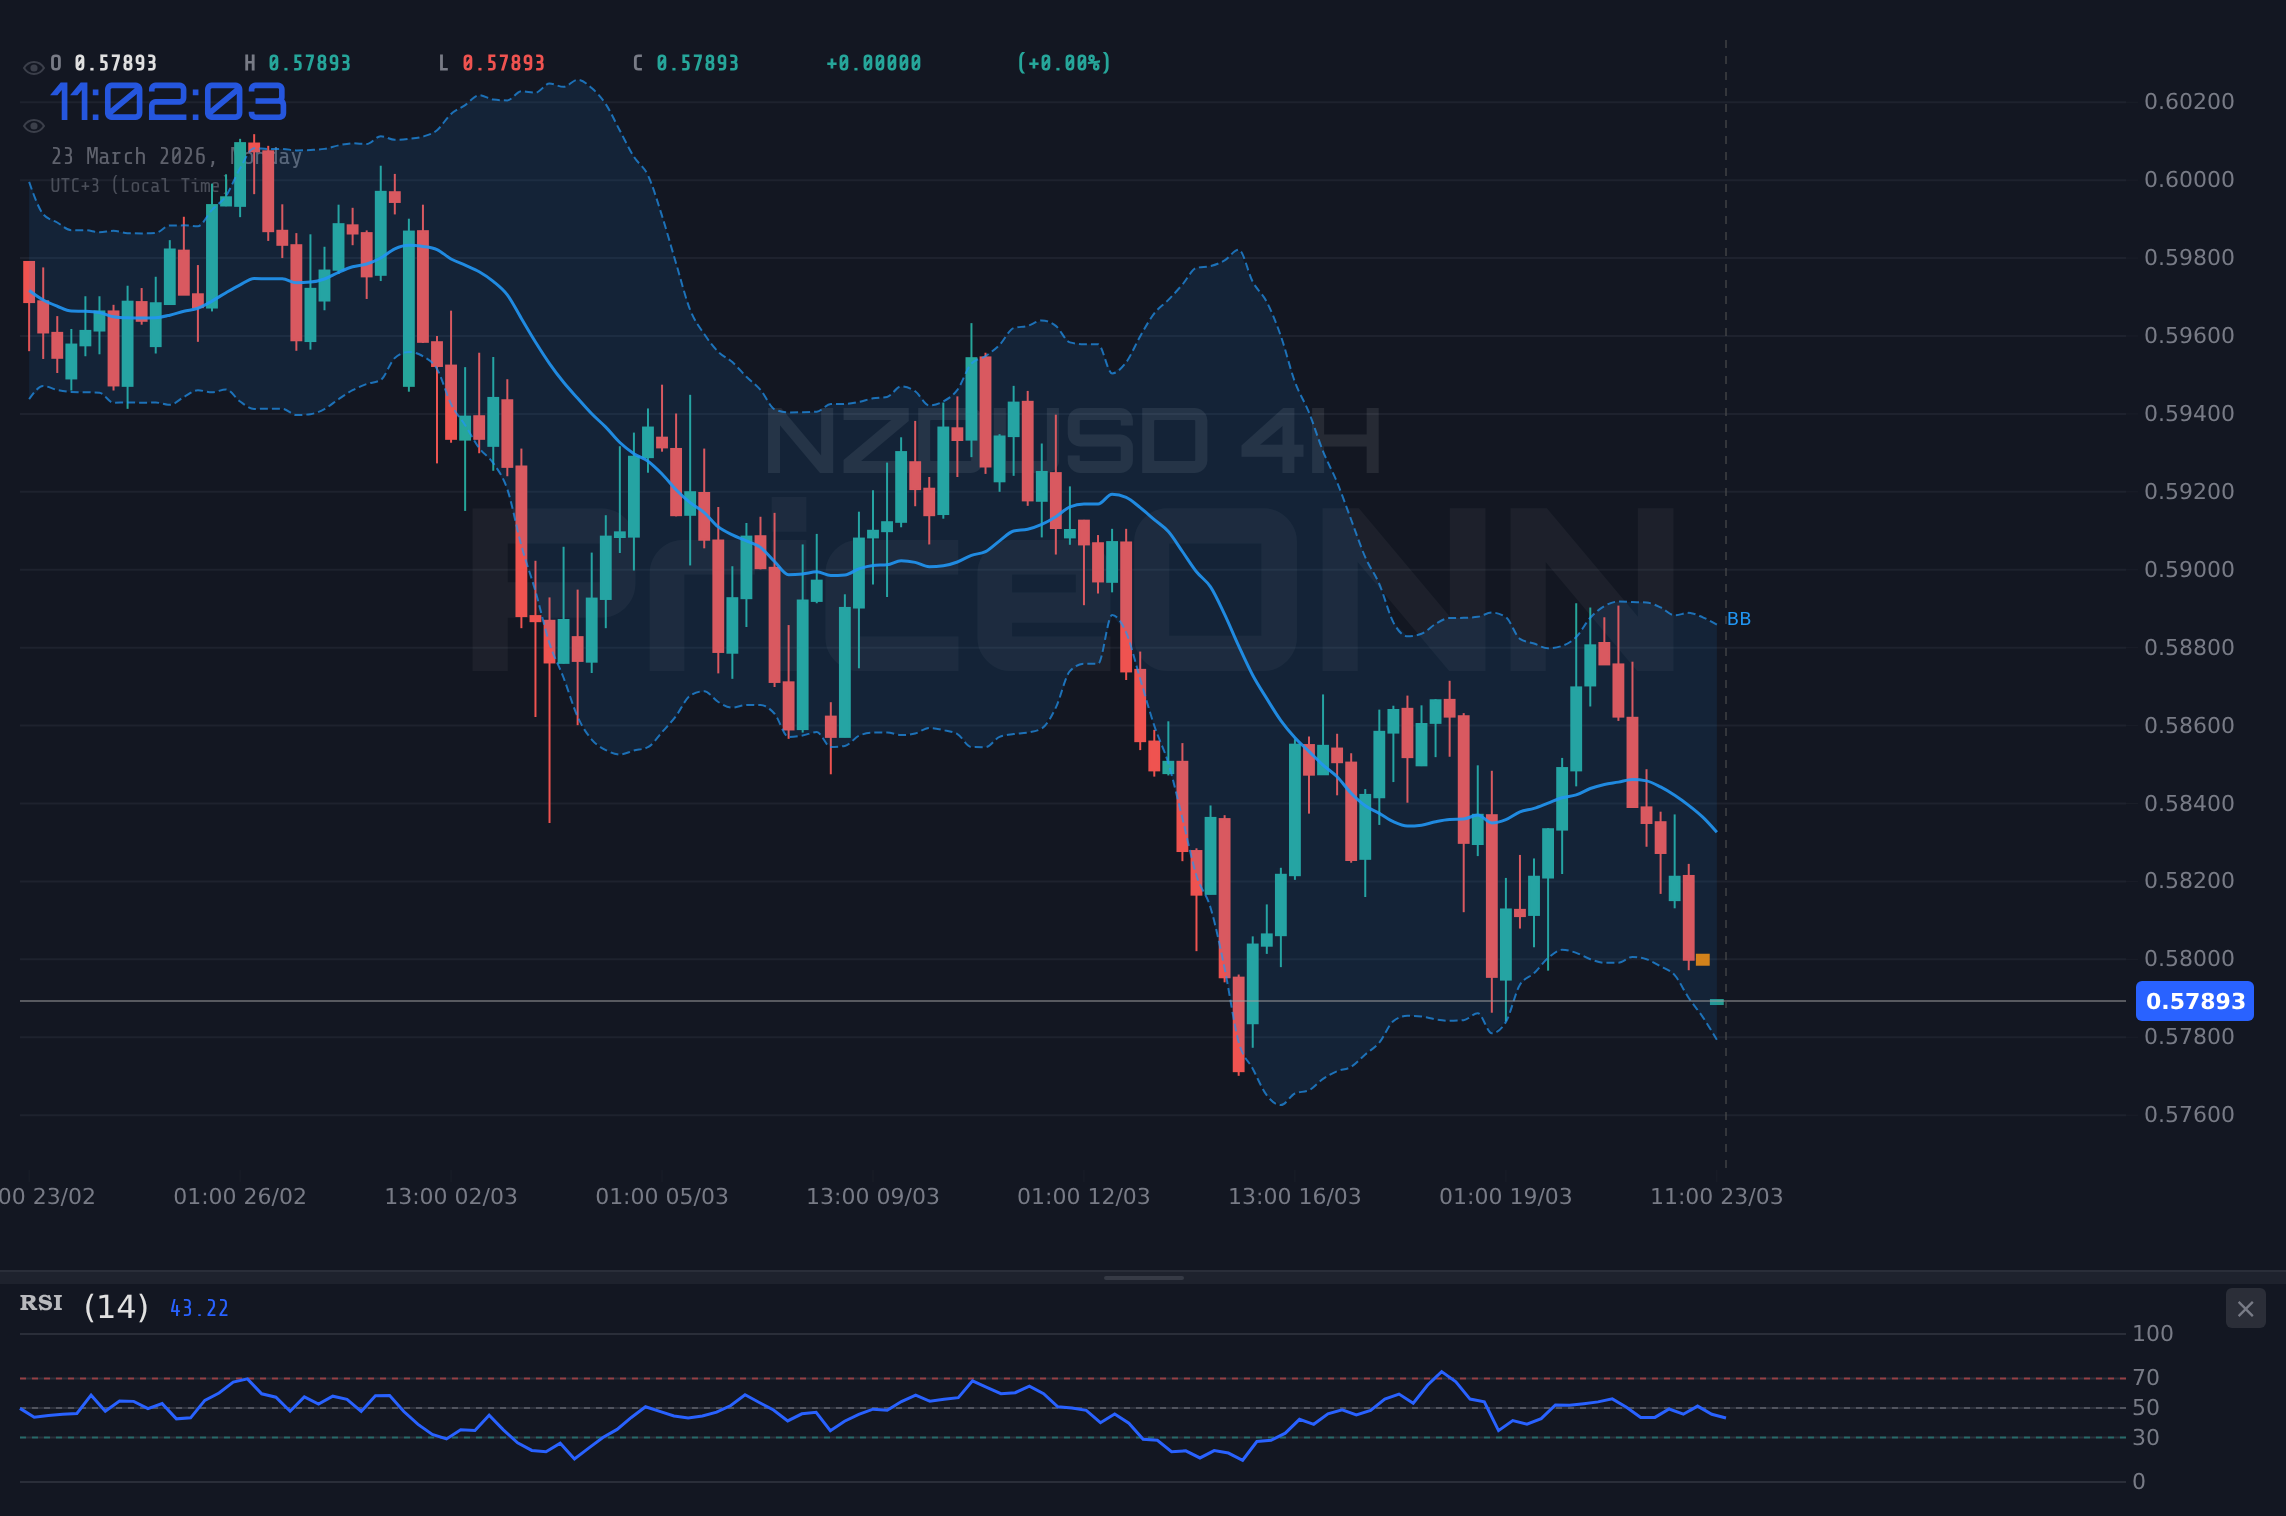
The 4-hour timeframe paints an even more bearish picture, with the trend also showing 90% strength downwards. The current price of $0.57923 is hovering precariously close to the immediate support level at $0.57991. A break below this level would not only confirm the bearish sentiment but also open the door for further declines towards the next significant support at $0.57826. The MACD indicator on this timeframe is deep in negative territory, with the MACD line well below its signal line, reinforcing the bearish momentum. Bollinger Bands are also showing the price trading below the lower band, a sign of extreme bearishness that can precede a short-term bounce, but more likely indicates a continuation of the downtrend if immediate support fails.
On the daily chart, the trend is still classified as downwards with 94% strength, despite some indicators hinting at oversold conditions. The RSI at 41.86 suggests there is still room to fall before reaching truly oversold levels, and the ADX at 28.96 indicates a strong downtrend is in play. The Stochastic Oscillator, with K=35.5 and D=30.39, shows a slight bullish divergence as %K is above %D, but it's still in the lower range, suggesting any upward movement might be limited. This mixed signal on the daily chart, compared to the stronger bearish signals on shorter timeframes, highlights the current indecision and the critical nature of the immediate support levels.
The strength of the US Dollar is a key driver here. With persistent inflation concerns and geopolitical risks escalating, the Federal Reserve is under pressure to maintain a hawkish stance, or at least delay any dovish pivot. This is reflected in the DXY's current price of 99.63 and its upward trend. A stronger dollar generally translates to weaker performance for currencies like the NZD, especially when coupled with risk-off sentiment. The correlation between DXY and NZDUSD is typically inverse, and right now, that relationship is playing out clearly, with the dollar's ascent dragging the Kiwi dollar lower.
Looking at the broader market context, major US indices like the S&P 500 and Nasdaq are also showing significant weakness, trading at 6452 and 23652.88 respectively. This risk-off environment further supports the safe-haven appeal of the US Dollar and puts pressure on commodity-linked currencies such as the NZD. The decline in equities suggests that investors are bracing for potential economic slowdowns or continued inflationary pressures, which are not conducive to higher-risk currency pairs.
The geopolitical situation in the Middle East is a significant wildcard. Escalating tensions have already sent oil prices surging, with Brent crude at $113.74 and WTI at $101.46. Higher energy prices can exacerbate inflation concerns, potentially forcing central banks to adopt a more aggressive monetary policy, which further bolsters the dollar. This creates a challenging environment for risk assets and currencies that are sensitive to global growth prospects. The news from March 23rd, 2026, highlighting Middle East turmoil and potential Fitch downgrades impacting NZD/USD, directly speaks to these concerns, reinforcing the bearish outlook for the pair.
Given the technical setup and the prevailing macro conditions, the immediate future for NZDUSD appears bearish. The pair is testing crucial support levels, and a failure to hold these could trigger a more substantial sell-off. The strong downtrend signals across the 1-hour and 4-hour charts, coupled with the overarching strength of the US Dollar, suggest that any rallies are likely to be short-lived and met with selling pressure. Traders will be closely watching the $0.57991 support level, as a decisive break below it could signal a move towards $0.57826 and potentially lower.
The market sentiment analysis also points towards continued weakness. While the RSI is deeply oversold, this often persists in strong downtrends, meaning that oversold conditions do not automatically translate into a buy signal. Confirmation is key. A sustained move above the immediate resistance at $0.57998, supported by improving risk appetite and a weaker DXY, would be needed to signal a potential reversal. However, with the current data, such a scenario seems less probable in the immediate term.
The implications for traders are clear: caution is warranted. While the oversold indicators might tempt some to look for a bounce, the overwhelming bearish technicals and fundamental backdrop suggest that a bearish bias is more appropriate. Shorting rallies or waiting for a confirmed break below support levels could offer more defined risk management opportunities. The risk/reward for a long position at these levels appears unfavorable given the current market dynamics.
The current price action around $0.57923 presents a critical juncture. The pair has already experienced a significant daily drop of -0.60% (-0.0035), indicating strong selling momentum. The daily range of 0.58084 - 0.58372 shows the volatility, but the overall direction has been down. This reinforces the view that the bears are in control and any upward movements should be viewed with skepticism until confirmed by stronger price action and a shift in macro drivers.
Considering the ADX reading of 20.61 on the daily chart, which indicates a moderate trend strength, it suggests that the current move has some legs but is not yet an extreme trend. This moderate strength, combined with the aligned RSI and MACD histogram suggesting a clear directional signal, makes the current environment ripe for traders to manage their positions carefully. The Stochastic Oscillator being in an extreme zone (K=7.23, D=10.92) adds to the narrative of oversold conditions, but as previously mentioned, this does not negate the prevailing downtrend without further confirmation.
The economic calendar is also a factor to consider. While specific upcoming events were not detailed in the provided data, general market focus on inflation and potential central bank actions remains high. Any unexpected economic data that strengthens the case for further Fed tightening would likely push the DXY higher and NZDUSD lower. Conversely, signs of cooling inflation or a less hawkish Fed stance could provide temporary relief, but the current technical picture would need to show a significant shift to support a sustained recovery.
The recent news highlighting Middle East turmoil and its potential impact on NZD/USD below 0.58 is particularly relevant. This geopolitical uncertainty acts as a catalyst for safe-haven flows into the US Dollar, directly pressuring the Kiwi. The fact that the pair is trading near these levels, as indicated by the news, aligns perfectly with the bearish technical outlook. The news also mentioned AUD/USD and NZD/USD under pressure, reinforcing the idea that the weakness is not isolated to just one currency but part of a broader trend affecting the antipodean currencies.
The NZDUSD is in a precarious position, trading at $0.57923 under significant bearish pressure. The confluence of a strong US Dollar, risk-off sentiment, and clear downtrend signals on multiple timeframes points towards potential further declines. Key support at $0.57991 is the immediate level to watch; a break below it could accelerate the downward move. While oversold indicators suggest a potential for a bounce, the overall trend and macro environment favor a bearish outlook for now.
Bearish Scenario: Downside Continuation
65% ProbabilityNeutral Scenario: Consolidation Around Support
25% ProbabilityBullish Scenario: Short-Covering Rally
10% ProbabilityFrequently Asked Questions: NZDUSD Analysis
What happens if NZDUSD breaks below the $0.57991 support level?
A break below $0.57991 would likely trigger further selling pressure, with the next key support level being $0.57826. This would confirm the bearish trend indicated by multiple timeframes and could lead to accelerated declines.
Is the RSI at 25.8 a buy signal for NZDUSD right now?
While an RSI of 25.8 is deeply oversold, it does not automatically signal a buy opportunity in a strong downtrend. It suggests potential for a bounce, but confirmation from price action and other indicators is crucial before considering a long position.
How will the current geopolitical tensions affect NZDUSD's trend analysis?
Escalating geopolitical risks tend to fuel safe-haven demand for the US Dollar, putting downward pressure on currencies like the NZD. This strengthens the bearish outlook for NZDUSD as long as these tensions persist.
Should traders consider shorting NZDUSD at current levels near $0.57923?
Given the strong bearish signals on shorter timeframes and the prevailing macro environment, a short position might be considered if price action confirms weakness below immediate support at $0.57991. Risk management is paramount, with invalidation above $0.58346.
Track markets in real-time
AI-powered analysis, technical indicators and real-time price data.
Join Our Telegram Channel
Breaking market news, AI analysis and trading signals instantly.
Join Channel