XAGUSD Tests $69.79: Silver's Next Move Hinges on Key Levels
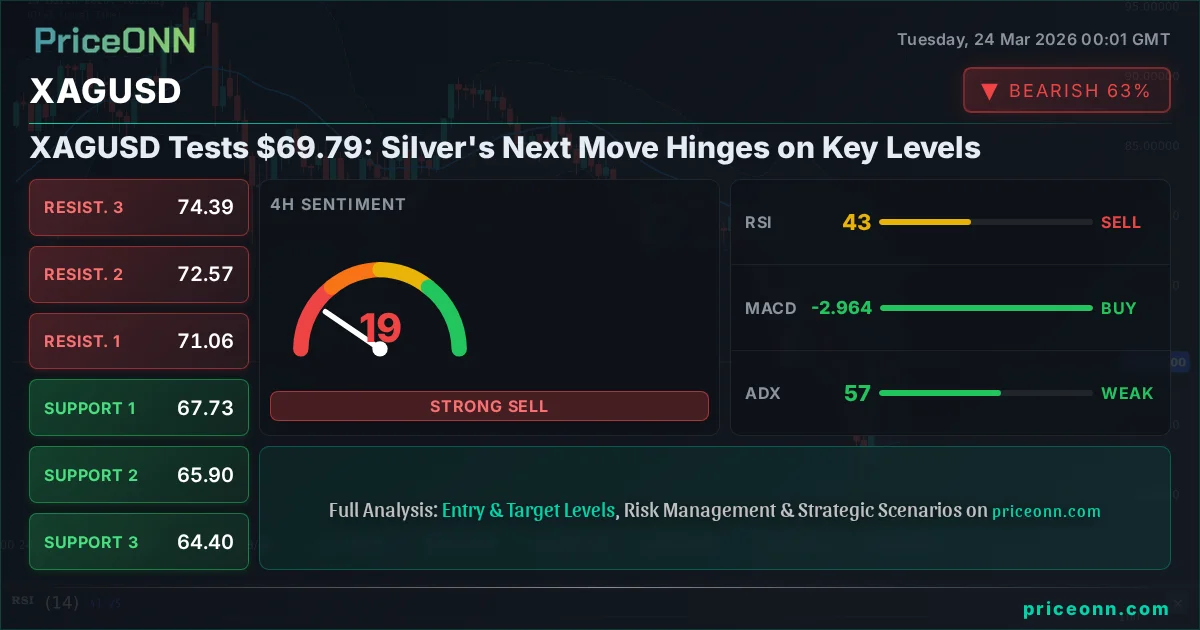
Silver is trading at $69.79 amidst mixed signals. With support at $65.49 and resistance at $72.35, traders watch for a clear trend direction.
The precious metals market is always a theater of shifting fortunes, and silver, or XAGUSD, is currently at a critical juncture, hovering around the $69.79 mark. This isn't just another trading day; it's a moment where the metal is testing key psychological and technical levels that could dictate its short-to-medium term trajectory. Having experienced significant volatility, with a recent daily drop of 1.23% or $55.19, the current price of $69.79 finds itself caught between the immediate pressures of a strong dollar and the underlying safe-haven appeal that often propels precious metals higher. Understanding the interplay of these forces, alongside the detailed technical indicators, is paramount for anyone navigating this complex market.
- RSI at 43.15 on the 4H chart suggests a bearish trend, but Stochastic signals a potential bounce.
- Silver's price is currently $69.79, with key support at $65.49 and resistance at $72.35.
- The ADX reading of 62.48 on the 4H chart indicates a very strong downtrend is in play.
- Despite short-term weakness, long-term inflation hedging demand could support silver prices if real rates decline.
The dramatic 5% tumble in silver prices observed earlier this week, reaching levels as low as $64.58, serves as a stark reminder of the metal's inherent volatility. While that sharp decline was attributed, in part, to the US Federal Reserve hinting at higher-for-longer interest rates, the subsequent recovery to $69.79 shows resilience. This recovery is crucial; it indicates that while the headwinds from a strong dollar and hawkish central bank sentiment persist, there's a persistent underlying demand for silver. This demand is fueled by a confluence of factors, including its role as a safe-haven asset, its industrial applications, and its appeal as a hedge against inflation, even if current inflation readings are moderating. The price action around the $69.79 level is therefore not just a technical observation but a reflection of these broader market forces battling for dominance.
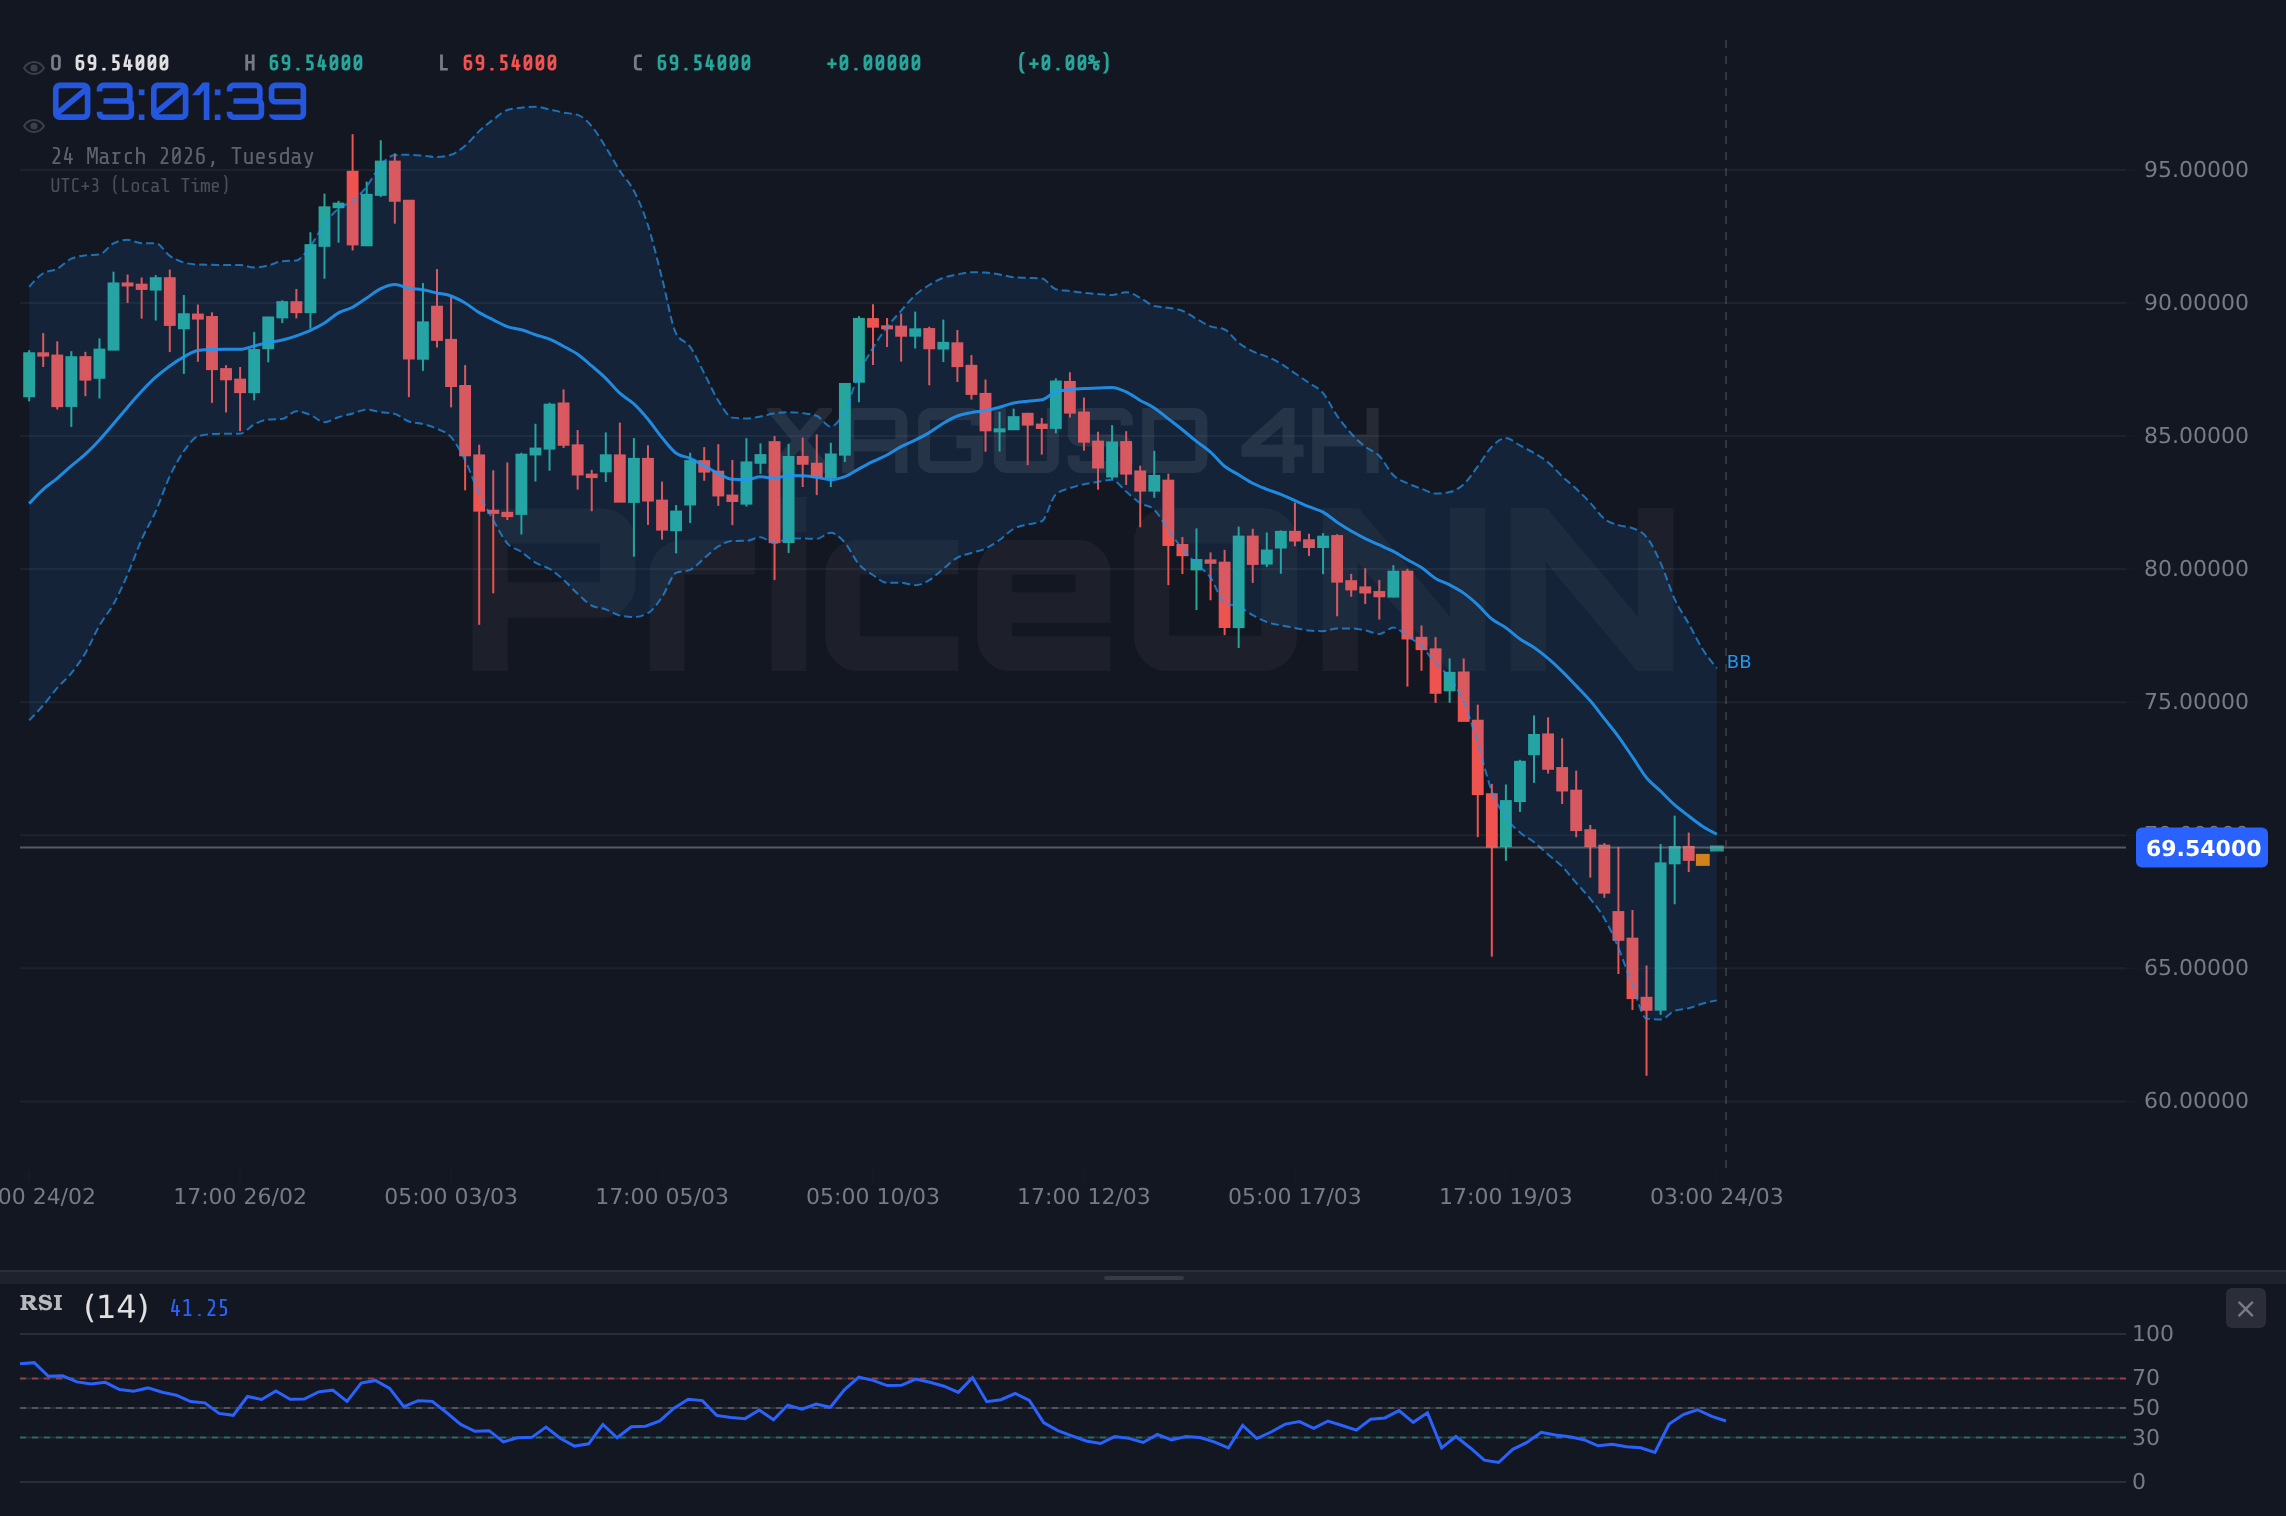
On the 4-hour chart, the technical picture for XAGUSD presents a fascinating dichotomy. The ADX indicator, a robust measure of trend strength, stands at a formidable 62.48, screaming that a very strong downtrend is firmly in control. This is corroborated by the MACD, which continues to print negative momentum below its signal line, and Bollinger Bands sitting below the middle band, all pointing towards bearish conviction. However, the Stochastic oscillator is flashing a different tune, showing %K above %D and hovering in a zone that could signal a potential upward correction or at least a pause in the selling pressure. This divergence is where market participants must exercise caution and look for confluence. A strong trend is in place, but the Stochastic is hinting that the current bearish momentum might be facing temporary headwinds or a potential short-covering rally. The RSI, at 43.15, also resides in neutral territory, leaning bearish but far from oversold conditions that might typically precede a significant reversal.
Zooming out to the daily timeframe, the narrative shifts slightly, presenting a more nuanced view. While the 4-hour chart screams downtrend, the daily ADX at 22.73 suggests a trend of moderate strength, indicating that the extreme bearish conviction seen on shorter timeframes might be softening over a longer perspective. The RSI(14) at 28.24 is firmly in oversold territory, a reading that historically has often preceded a price rebound for silver. This is a classic signal that the selling may have been overdone in the short term, opening the door for potential buying interest to emerge. However, the MACD still shows negative momentum, and the Bollinger Bands are hugging the lower band, suggesting that downside risk remains. This daily picture paints a scenario where the market is oversold, but confirmation of a sustained recovery is still pending, making the $69.79 level a critical pivot point.
The interplay between gold (XAUUSD) and silver (XAGUSD) also provides valuable context. Currently, XAUUSD is trading at $4442.19, showing a daily decline of 1.23%. While both precious metals often move in tandem, their correlation can fluctuate. Silver's recent strength, with a positive daily change of 2.87% or $1.95, pushing it to $69.79, while gold experiences a dip, suggests that industrial demand or specific market dynamics might be favoring silver at this moment. This divergence, if it continues, could be a significant signal. Historically, silver's industrial usage, which is substantial, can sometimes drive its price independently of gold, especially if there are positive developments in manufacturing or technology sectors that rely heavily on silver. The current price action around $69.79 could be influenced by these specific industrial demand factors, offering a counter-balance to the broader macroeconomic headwinds.
The US Dollar Index (DXY), currently at 98.92 and showing a daily drop of 0.35%, plays a crucial role in the silver market. A strengthening dollar typically exerts downward pressure on dollar-denominated commodities like silver, as they become more expensive for holders of other currencies. The recent dip in the DXY from its highs around 99.82 might be providing some breathing room for silver, allowing it to test higher levels. However, the daily timeframe for DXY shows a 'Yükseliş' (Uptrend) with 97% strength, indicating that the dollar's overall bullish bias remains intact. This creates a complex environment for silver: the dollar's underlying strength acts as a persistent ceiling, while any weakness in the dollar, like the one observed today, can offer temporary relief and support for silver prices. Traders are watching the DXY closely; a sustained move below its key support levels could unlock further upside for XAGUSD.
Looking at the equity markets, the S&P 500 is up 0.89% to 6593.9, and the Nasdaq is up 1.04% to 24241.89. This generally positive risk appetite in equities can sometimes be a headwind for safe-haven assets like silver, as investors might favor riskier assets when market sentiment is bullish. However, the relationship isn't always straightforward. If the equity rally is perceived as unsustainable or driven by factors that could lead to future inflation, investors might still seek refuge in precious metals. The fact that silver has shown some resilience despite a generally positive risk environment suggests that factors beyond simple risk-on/risk-off sentiment are at play. The strong downtrend indicated by the 4H ADX at 62.48 for XAGUSD implies that even positive equity moves are not enough to reverse the current bearish momentum in silver, at least not yet.
The macroeconomic backdrop, particularly concerning inflation and interest rates, remains a dominant theme. While inflation has shown signs of moderating, central banks, including the Federal Reserve, have maintained a hawkish stance, hinting at a prolonged period of higher interest rates. This environment is generally bearish for non-yielding assets like silver, as higher rates increase the opportunity cost of holding them. However, the narrative around real interest rates is also critical. If nominal rates remain elevated but inflation expectations fall faster, real rates could still rise, which is negative for gold and silver. Conversely, if inflation proves stickier than anticipated, or if central banks are forced to cut rates sooner than expected to avoid an economic downturn, real rates could fall, providing a significant tailwind for precious metals. The current price action around $69.79 for XAGUSD is occurring within this uncertain macroeconomic landscape, where the market is constantly repricing Fed policy expectations.
From a supply and demand perspective, industrial demand for silver remains a robust pillar of support. Silver is essential in various high-growth sectors, including electronics, solar panels, and electric vehicles. As global economies continue to transition towards greener technologies and advanced manufacturing, the demand for silver is expected to remain strong. Mine production, while a significant source, can be cyclical and is often subject to disruptions, while recycling provides a supplementary supply. The consistent industrial appetite for silver offers a fundamental floor to its price, acting as a buffer against excessive speculative selling. This underlying demand is a key reason why, despite bearish technical signals, silver hasn't collapsed entirely, finding buyers even as it tests lower levels, such as the $65.49 support.
The recent news about Coeur Mining significantly boosting its 2026 production forecast, expecting an 80% surge in gold output and adding substantial silver resources, highlights the supply side dynamics. While this is specific to gold production, it reflects a broader trend of investment in precious metals mining. Increased future supply could theoretically put pressure on prices, but the current market is more focused on demand factors and the immediate macroeconomic environment. The fact that mining companies are investing in future production suggests a belief in sustained long-term demand and prices that justify such capital expenditure. For now, however, the immediate focus remains on the price action around $69.79 and the technical signals it's generating.
Considering the current technical signals and the broader market context, a balanced approach is warranted. The strong bearish trend on the 4-hour chart, underscored by the ADX of 62.48, cannot be ignored. However, the oversold conditions on the daily RSI (28.24) and the conflicting signals from the Stochastic oscillator suggest that the downside momentum might be losing steam. This creates a trading environment ripe with possibilities, but also with significant risks. The $69.79 level acts as a battleground where these opposing forces are clashing. A break below the support at $65.49 would confirm the continuation of the strong downtrend, while a decisive move above the resistance at $72.35 could signal the beginning of a significant recovery. Until then, caution and a focus on risk management are key.
Navigating the Silver Maze: Scenarios Ahead
The path forward for XAGUSD is far from certain, with conflicting signals from various timeframes and indicators. The current price of $69.79 is a pivotal point, and understanding potential scenarios is crucial for any trader or investor. The strong downtrend indicated by the 4H ADX at 62.48 presents a clear bearish case, while the oversold daily RSI at 28.24 hints at a potential bottom. Here, we outline three distinct scenarios, each with its own trigger, invalidation point, and potential price targets, based on the provided market data.
Bearish Scenario: Trend Continuation
65% ProbabilityNeutral Scenario: Consolidation Around $69.79
25% ProbabilityBullish Scenario: Reversal Attempt
10% ProbabilityEconomic Calendar Watch: What's Next?
While the provided market data doesn't include specific upcoming economic events, it's crucial to acknowledge their potential impact. Any significant news regarding central bank policy shifts, inflation data releases, or geopolitical developments could drastically alter the trajectory of XAGUSD. For instance, a surprisingly dovish tone from the Federal Reserve or a significant drop in inflation figures could spark a rally, pushing silver towards its resistance levels. Conversely, any indication of sustained hawkishness or escalating geopolitical tensions that boosts the dollar could lead to a breakdown below the $65.49 support. Traders must remain vigilant and monitor scheduled economic releases closely, as these events often act as catalysts for significant price movements, potentially validating or invalidating the scenarios outlined above.
Frequently Asked Questions: XAGUSD Analysis
What happens if XAGUSD breaks below the $65.49 support level?
If XAGUSD closes decisively below the $65.49 support, it would likely confirm the continuation of the strong 4-hour downtrend indicated by the ADX of 62.48. The next immediate target would be the $63.14 level (S2), with a further move towards $58.64 (S3) possible if selling pressure intensifies.
Should I consider buying XAGUSD at current levels around $69.79 given the oversold daily RSI?
While the daily RSI at 28.24 suggests oversold conditions, caution is advised due to the strong 4-hour downtrend. A more prudent approach would be to wait for confirmation, such as a decisive break above the 1H resistance at $70.52 or a clear bullish reversal pattern forming. Aggressive buyers might risk a small position with tight stops below $65.49, but a confirmed breakout above $72.35 would offer a much stronger bullish signal.
Is the Stochastic's buy signal on the 4H chart a reliable indicator for XAGUSD at $69.79?
The Stochastic showing %K above %D is a bullish signal, but it contradicts the strong downtrend shown by the ADX (62.48) on the same 4-hour timeframe. This conflict means the Stochastic signal might only indicate a short-term bounce or pause rather than a full trend reversal. Confirmation from other indicators or price action is needed.
How will a potential Fed rate cut affect XAGUSD's price around $69.79?
A Fed rate cut, especially if it signals a pivot away from inflation concerns, would likely lower real interest rates and weaken the US dollar. This combination typically provides a strong tailwind for silver. If such a cut occurs while XAGUSD is testing its current levels, it could be the catalyst needed to break through the $72.35 resistance and target higher levels like $76.85.
Track markets in real-time
AI-powered analysis, technical indicators and real-time price data.
Join Our Telegram Channel
Breaking market news, AI analysis and trading signals instantly.
Join Channel