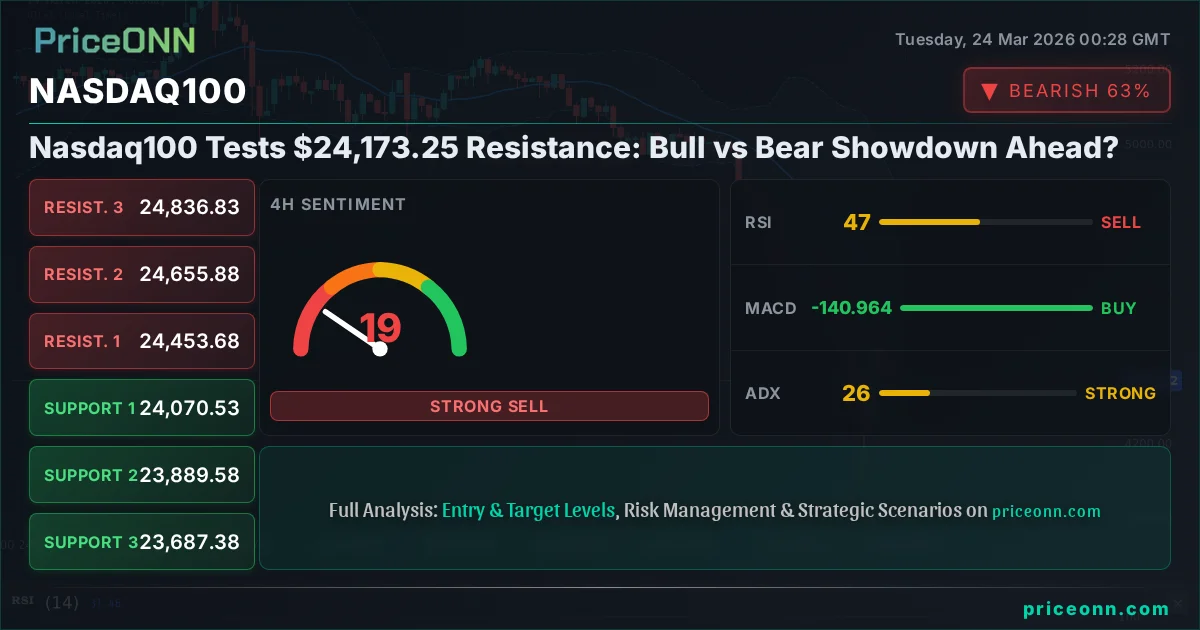
Nasdaq100 Tests $24,173.25 Resistance: Bull vs Bear Showdown Ahead?
Nasdaq100 hovers near $24,173.25 resistance. Key technicals suggest a critical juncture. Is a breakout imminent or a pullback due?
The Nasdaq100 index finds itself at a critical juncture, currently trading around $24,173.25, teetering near significant resistance levels. This pivotal moment ignites a fierce debate between bulls and bears, each presenting compelling arguments backed by technical indicators and market sentiment. The question on every trader's mind is whether the index has the momentum to push higher or if a pullback is on the horizon. Understanding the interplay of these forces is crucial for navigating the volatile tech-heavy index in the coming days. This analysis delves into the conflicting signals, historical patterns, and macroeconomic undercurrents shaping the Nasdaq100's immediate future.
- The Nasdaq100 is currently trading near $24,173.25, facing resistance at $24,369.5.
- RSI at 46.79 on the 4H chart indicates room for further downside, while the 1H RSI at 53.26 suggests potential upward movement.
- ADX readings show strong trend potential (35.77 on 1H, 28.49 on 4H), but divergence between timeframes adds complexity.
- Key support for the Nasdaq100 is identified at $24,070.53, with a break below potentially targeting $23,686.03.
- Macro factors like DXY's stance and Fed policy expectations will heavily influence the Nasdaq100's next move.
The Bullish Case: Momentum and Macro Tailwinds
Riding the Wave of Tech Innovation
The bulls are pointing to the Nasdaq100's inherent strength derived from its composition of leading technology and growth companies. Recent advancements in artificial intelligence, cloud computing, and semiconductor technology continue to fuel optimism. Despite short-term volatility, the long-term secular trend for tech remains robust. Companies within the index are consistently innovating, expanding market share, and demonstrating impressive earnings growth, which provides a fundamental underpinning for higher valuations. The current price action, while facing resistance, shows underlying buying interest, especially on the 1-hour chart where the RSI sits at a neutral 53.26, suggesting room for upward movement. The MACD on the 1H timeframe also displays positive momentum, with the MACD line above its signal line, indicating that buying pressure is currently dominant in the shorter term. This suggests that any dips might be seen as accumulation opportunities by investors betting on continued technological advancement.
Technical Signals Favoring the Upside
Looking closer at the technical indicators, the bulls find some encouragement. On the 1-hour chart, the ADX stands at 35.77, indicating a strong trend is in play, which, combined with the positive MACD and a neutral RSI, suggests that the upward momentum could be sustained. While the Stochastic K value at 24.39 is lower than the D value at 48.81, signaling a potential short-term dip, it's not in extreme overbought territory, leaving room for further upside before a significant reversal. The price is currently trading above the middle Bollinger Band on the 1H chart, which often acts as a dynamic support level during uptrends. A decisive break above the immediate resistance at $24,306.4 would likely trigger further buying, potentially targeting the $24,369.5 level and beyond. The general signal on the 1H chart leans towards 'BUY' (6 buys, 2 sells, 0 neutral), reinforcing the bullish sentiment in intraday trading. The resilience shown in holding above intraday support levels like $24,195.77 is also a positive sign for those betting on a continued rally.
Macroeconomic Environment: A Mixed Bag for Bulls
The macroeconomic backdrop presents a more nuanced picture. While inflation concerns might be easing, leading to speculation about potential Fed rate cuts later in the year, the US Dollar Index (DXY) is showing some strength, currently at 99.04. A stronger dollar typically exerts pressure on growth assets like Nasdaq100 components, as it can make US exports more expensive and reduce the value of overseas earnings when repatriated. However, the DXY's own technicals are mixed, with a neutral 1H trend and a weaker 4H outlook, suggesting its upward pressure might be limited. Furthermore, the current narrative around tech stocks often emphasizes their resilience and ability to pass on costs, potentially mitigating some of the negative impact of a stronger dollar. The expectation of future interest rate cuts, if realized, could provide a significant tailwind for growth stocks, making current levels attractive for long-term accumulation. The market sentiment is also influenced by corporate earnings reports, and positive outlooks from key tech giants could easily sway sentiment back towards the bulls.
The Bearish Case: Resistance, Divergence, and Macro Headwinds
Approaching a Technical Wall
On the other side of the debate, the bears are highlighting the Nasdaq100's proximity to significant resistance. The index is currently trading near $24,173.25, but the immediate resistance level identified in the data is $24,306.4, with a more substantial barrier at $24,369.5. On the 4-hour chart, the ADX is at 28.49, indicating a strong trend, but the RSI is at 47.04, suggesting that the upward momentum is not as strong as it appears on shorter timeframes and that there's room for a reversal. The MACD on the 4H timeframe shows positive momentum, but the Stochastic K value at 65.53 is approaching overbought territory, and importantly, it's higher than the D value at 34, indicating a potential upward push before a possible decline. However, the overall signal on the 4H chart leans towards 'SELL' (3 buys, 5 sells, 0 neutral), reflecting a cautious outlook from this longer timeframe perspective. The price action on the daily chart is even more concerning for bulls, with the RSI sitting at 36.61, firmly in neutral-to-oversold territory, and the ADX at 44.98, signaling a very strong downtrend. The daily chart's general signal is a clear 'SELL' (0 buys, 7 sells, 0 neutral), painting a grim picture for sustained upside.
Conflicting Indicators and Divergence
The technical landscape is far from clear-cut, and bears are quick to point out the conflicting signals across different timeframes. While the 1-hour chart might show some bullish momentum, the 4-hour and daily charts present a more bearish outlook. The divergence between the shorter-term bullish signals and the longer-term bearish indicators is a classic sign of market indecision and potential reversal. For instance, while the 1H RSI is at 53.26, the 4H RSI at 47.04 suggests weakening buying pressure. Similarly, the Stochastic indicator shows mixed signals: a potential dip on the 1H chart, a rise towards overbought on the 4H, and a fall into oversold on the daily. This conflicting data necessitates caution. The bears' argument is that the index is showing signs of fatigue near resistance, and the weaker longer-term indicators are more likely to dictate the next significant move. A failure to decisively break above $24,369.5 could lead to a sharp sell-off, with the first key support level at $24,070.53, and a break below that could target $23,686.03.
Macroeconomic Headwinds and Risk Sentiment
The macroeconomic environment also provides ammunition for the bears. The strengthening US Dollar Index (DXY), currently at 99.04 and showing a strong uptrend on the daily chart (ADX 33.66), acts as a significant headwind for risk assets like the Nasdaq100. A higher dollar can dampen overseas earnings for multinational tech companies and may signal a more cautious global economic outlook. Furthermore, persistent inflation data, even if showing signs of moderating, keeps the Federal Reserve's monetary policy in focus. Any hint from Fed officials about maintaining higher interest rates for longer, or even delaying rate cuts, could trigger a risk-off sentiment across markets. This would disproportionately affect growth stocks on the Nasdaq100, which are more sensitive to interest rate changes. The recent news about a potential UK profit cap on energy bills amid Middle East tensions, while not directly tied to Nasdaq100, points to broader global economic uncertainties that can dampen overall risk appetite. If market sentiment shifts towards risk aversion, the Nasdaq100, despite its tech focus, could see significant selling pressure as investors seek safer havens.
Navigating the Crossroads: Scenarios and Strategy
The current technical and fundamental landscape for the Nasdaq100 presents a complex picture, with conflicting signals across different timeframes and asset classes. Bulls are encouraged by shorter-term momentum and the underlying strength of the tech sector, while bears are wary of key resistance levels, longer-term bearish indicators, and potential macroeconomic headwinds. The interplay between these forces will dictate the index's next significant move.
Bearish Scenario: Resistance Holds, Pullback Ensues
65% ProbabilityNeutral Scenario: Consolidation Near Resistance
25% ProbabilityBullish Scenario: Breakout Above Resistance
10% ProbabilityThe Verdict: Caution and Confirmation
Weighing the evidence, the bearish scenario appears to hold a higher probability in the short to medium term, primarily due to the confluence of strong resistance levels, conflicting signals across timeframes, and potential macroeconomic headwinds. While the 1-hour chart offers some bullish cues, the prevailing trend on the 4-hour and daily charts leans towards caution. The ADX on the daily chart at 44.98 signals a very strong downtrend, which cannot be ignored. The RSI at 36.61 on the daily chart also suggests that any current strength is likely a counter-trend move within a larger downtrend. For bulls to regain control, a decisive break above $24,369.5 is imperative, accompanied by strong volume and positive confirmation from longer-term indicators. Until then, traders should exercise prudence. The current price action around $24,173.25 represents a critical test. A failure to hold this level could initiate a significant downward move, targeting the support zones identified. The strength of the DXY and future Fed commentary will be key watchpoints in the coming sessions.
For active traders, monitoring the price action around the $24,070.53 support level is paramount. A break below this could offer a shorting opportunity, targeting $23,686.03. Conversely, a confirmed break above $24,369.5 could signal a reversal, but confirmation from daily indicators and sustained volume would be essential before considering long positions. Patience and risk management are key in this environment.
Frequently Asked Questions: Nasdaq100 Analysis
What happens if Nasdaq100 breaks below the $24,070.53 support level?
A break below $24,070.53 on the Nasdaq100 would invalidate short-term bullish hopes and likely trigger further selling pressure. This scenario, supported by bearish signals on the 4H and daily charts, could see prices targeting the next major support at $23,686.03.
Should I consider buying Nasdaq100 at current levels of $24,173.25 given the RSI at 47.04 (4H)?
Buying at $24,173.25 with the 4H RSI at 47.04 presents a mixed risk/reward. While not extremely overbought, the RSI leaves room for upside, but the ADX at 28.49 suggests a strong trend might be against new longs. A more prudent approach would be to wait for a confirmed break above $24,369.5 or a dip to stronger support levels like $23,686.03, depending on your risk tolerance.
Is the MACD signal on the daily chart a sell signal for Nasdaq100 right now?
Yes, the MACD on the daily chart is currently showing negative momentum with the MACD line below its signal line. This is a bearish signal, reinforcing the view that the longer-term trend may be downwards, despite potential short-term bounces. Confirmation from price action near resistance levels would strengthen this bearish outlook.
How will the DXY's current level of 99.04 affect Nasdaq100 this week?
With the DXY at 99.04 and showing a strong daily uptrend, it presents a headwind for the Nasdaq100. A stronger dollar can increase costs for international investors and reduce the value of overseas profits for tech companies. If the DXY continues its upward trajectory, it could limit upside potential for the Nasdaq100, especially near resistance.
Track markets in real-time
AI-powered analysis, technical indicators and real-time price data.
Join Our Telegram Channel
Breaking market news, AI analysis and trading signals instantly.
Join Channel