BTCUSD Trades Near $70,166 Resistance: Bulls Eye Key Level
BTCUSD hovers near $70,166 as traders weigh strong upward momentum against resistance. Key levels and indicators suggest a critical juncture for the cryptocurrency.
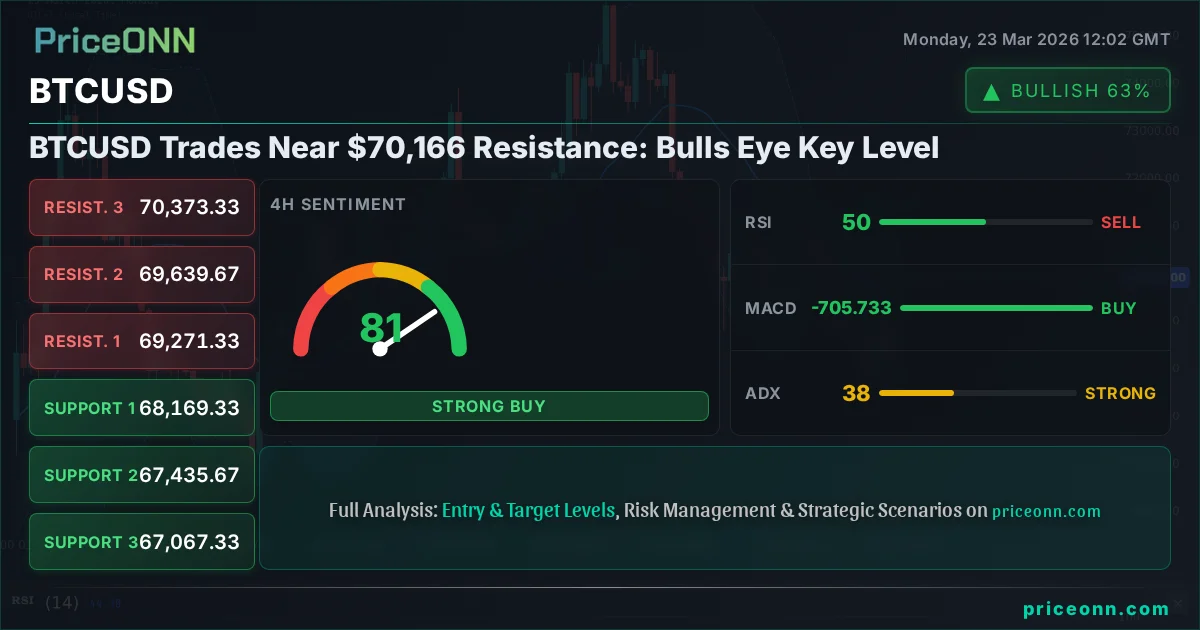
The digital asset space is holding its breath as BTCUSD finds itself nudging against significant resistance around the $70,166 mark. This isn't just another price level; it's a battleground where bulls, fueled by recent upward momentum, clash with bears eyeing potential pullbacks. Having climbed steadily, Bitcoin now faces a crucial test that could dictate its short-to-medium term trajectory. The question on everyone's mind is whether this $70,166 level will act as a springboard for further gains or a ceiling that triggers a much-needed correction. Understanding the forces at play - from technical indicators to broader market sentiment - is paramount for navigating this pivotal moment.
- RSI at 65.29 signals strong upward momentum but is approaching overbought territory, suggesting caution.
- Critical resistance sits at $70,373.33, a level that has capped upward moves on the 4H chart.
- MACD histogram shows positive momentum, but divergence on the daily chart hints at weakening bullish conviction.
- The correlation with a strengthening DXY at 99.39 puts pressure on risk assets like BTCUSD.
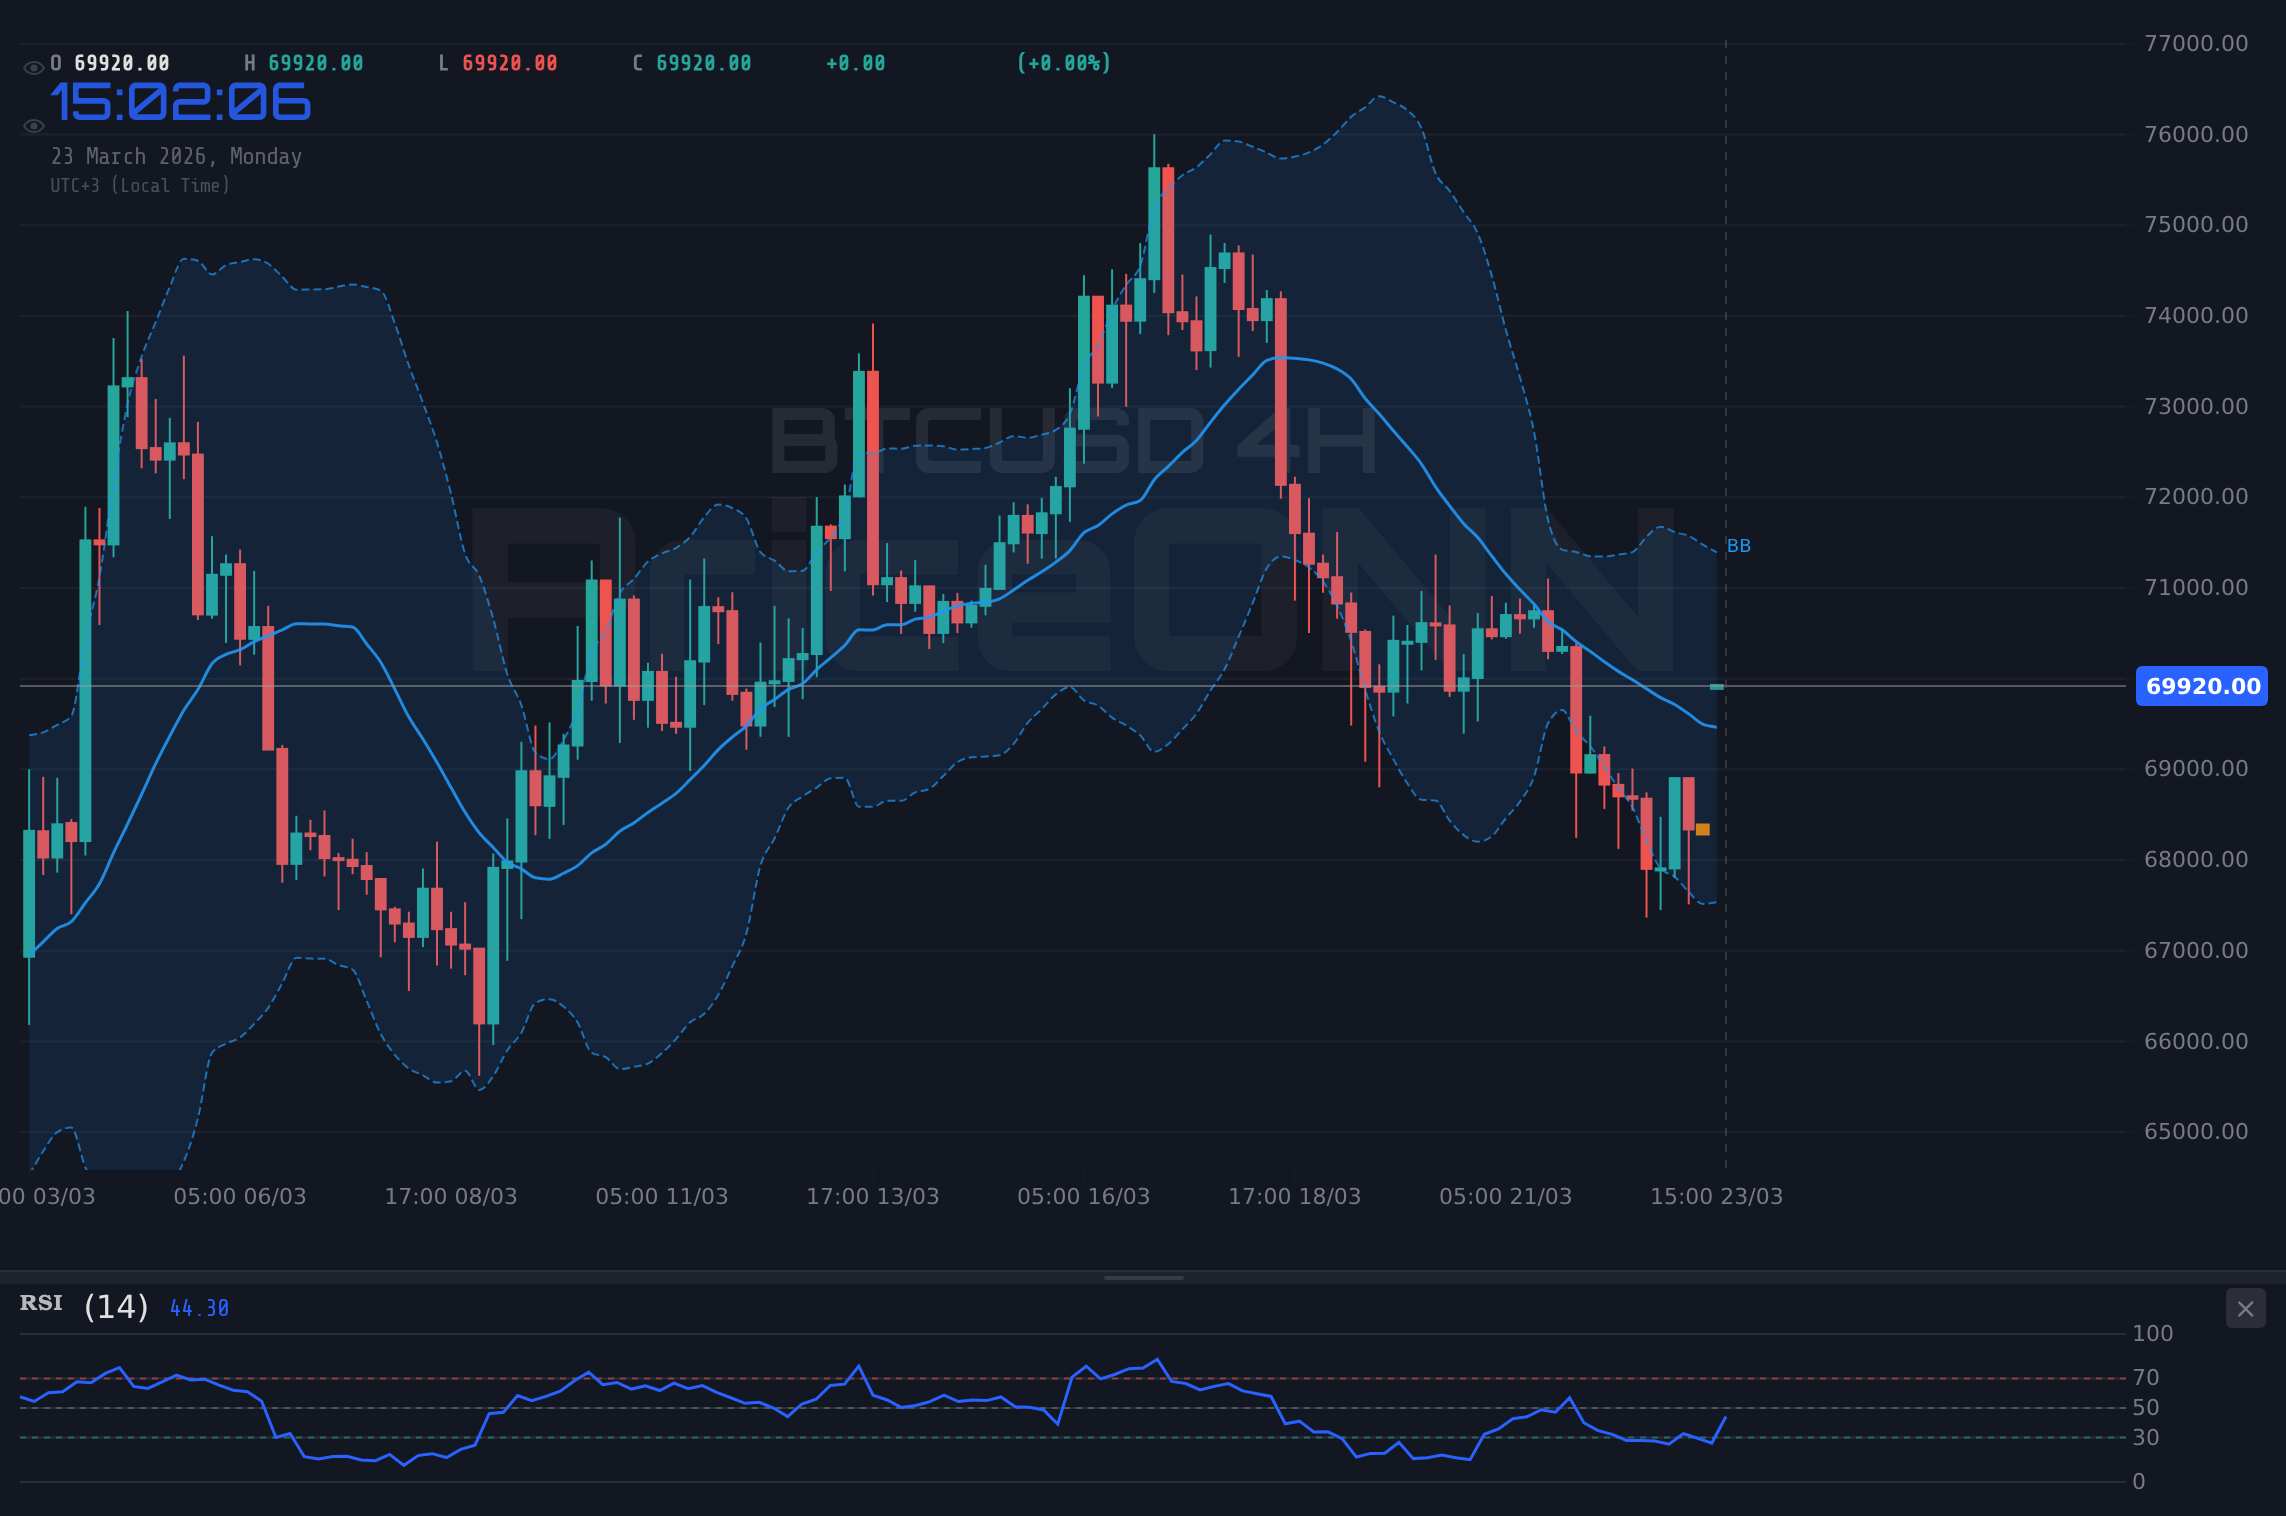
This crucial resistance zone, particularly the $70,373.33 level identified on the 4-hour chart, represents a significant hurdle. For bulls to maintain control, a decisive break and sustained hold above this price point are necessary. Such a move would not only validate the current uptrend but could also ignite a fresh wave of buying pressure, potentially targeting higher psychological levels. The strength and conviction behind any move above $70,373.33 will be a key determinant of future price action. Conversely, a failure to overcome this resistance could see sellers step in, initiating a retracement towards more immediate support levels.
The Bull Case: Breaking Through the Ceiling
Momentum and MACD Alignment
On the 1-hour timeframe, the technical picture paints a bullish narrative. The Relative Strength Index (RSI) at 65.29, while approaching overbought conditions, still indicates strong bullish momentum. This suggests that buyers have the upper hand in the short term. The MACD (Moving Average Convergence Divergence) is also showing positive momentum, trading above its signal line. This confluence of indicators on the intraday charts implies that the immediate pressure is upwards. For traders looking to capitalize on this, the strategy would be to identify entry points on any minor dips, expecting a push towards the next resistance levels. The ADX at 38.92 on the 1H chart further reinforces this, indicating a strong trend is in play, albeit one that needs to break through immediate overhead supply.
Stochastic Crossover and Trend Strength
Adding to the bullish argument, the Stochastic Oscillator on the 1-hour chart shows a bullish signal with the %K line (66.9) crossing above the %D line (64.46). While these levels are entering the overbought territory, the crossover itself is a short-term buy signal. This aligns with the overall trend strength indicated by the ADX on the 1H chart. The Daily chart, despite showing some signs of weakening momentum, still has a positive MACD, and the Stochastic is showing a bullish crossover, though on lower values. The key here is the intraday strength, which suggests that if market participants can push past the immediate resistance, there's a good chance for further upside before a more significant pullback occurs. The ability to hold above the $68,746.67 support on the 4H chart is crucial for maintaining this bullish outlook.
Historical Context and Market Sentiment
Looking back, Bitcoin has a history of breaking through key resistance levels after periods of consolidation. The current price action near $70,166 is reminiscent of previous psychological barriers that were eventually overcome. While there's no guarantee history will repeat itself, the underlying demand for Bitcoin, driven by increasing institutional adoption and its narrative as a digital store of value, remains a powerful tailwind. The recent inflows into Bitcoin ETFs and the general positive sentiment surrounding the cryptocurrency market contribute to the bullish case. Even with a strong DXY at 99.39, Bitcoin has shown resilience, suggesting that its price action is increasingly driven by its own ecosystem dynamics rather than solely by macro factors.
The Bear Case: Facing the Gravity of Resistance
Daily Chart Divergence and Weakening Momentum
However, the picture isn't entirely rosy for the bulls. The daily chart presents a more cautious outlook. While the 1-hour and 4-hour charts might show short-term bullish signals, the daily MACD, despite being positive, indicates a potential loss of upward momentum. More concerning is the Stochastic Oscillator on the daily chart, where %K (20.04) is below %D (35.17), suggesting a bearish signal and pointing towards oversold conditions that could precede a price decline. The ADX on the daily timeframe is at 20.15, indicating a weakening trend, which means the current upward push might lack the conviction to sustain itself significantly higher. This divergence between short-term strength and daily caution is a classic sign of a market at a critical crossroads.
The Power of Resistance and DXY Strength
The $70,373.33 resistance level on the 4H chart is not to be underestimated. This level has acted as a ceiling, and a failure to decisively break it could lead to significant profit-taking. Furthermore, the strengthening US Dollar Index (DXY), currently at 99.39, adds another layer of complexity. A stronger dollar typically exerts downward pressure on dollar-denominated assets like Bitcoin. The correlation between DXY and BTCUSD, while not always perfect, is often significant. If the DXY continues its ascent, it could provide the impetus for bears to push BTCUSD lower, seeking to test the support levels identified around $69,271.33 and $68,169.33 on the 4H chart. The current downward trend on the 4H chart, with an ADX of 37.71, shows that bears have been in control on this timeframe recently.
Overbought Conditions and Profit-Taking Potential
The RSI on the 1-hour chart is at 65.29, nearing the 70 threshold that typically signals overbought conditions. While not an immediate sell signal, it indicates that the recent rally might be running out of steam. Traders who have been long might consider taking some profits, especially as Bitcoin approaches the $70,373.33 resistance. This potential for profit-taking can create selling pressure, which, combined with a strong DXY and bearish signals on longer timeframes, could lead to a swift reversal. The daily RSI at 49.27, while neutral, suggests there's no strong buying conviction from a longer-term perspective to absorb potential selling pressure.
The Verdict: A Tightrope Walk at $70,166
Weighing the Indicators
The technical indicators present a mixed but leaning bearish picture for the immediate future, especially when considering the daily and 4-hour timeframes. While the 1-hour chart shows bullish momentum, the confluence of strong resistance at $70,373.33, a strengthening DXY, and potential bearish divergences on longer timeframes suggests that the upside might be limited from current levels. The ADX readings are particularly telling: strong on the 1H (38.92) and 4H (37.71), but weakening on the Daily (20.15). This indicates a strong short-term trend that is losing steam on a broader scale. The Stochastic on the daily chart also presents a bearish signal.
Scenario Analysis: What's Next for BTCUSD?
Given the conflicting signals and the critical resistance level, the market is at a delicate juncture. The probability of a short-term pullback seems higher than a decisive breakout, especially without further fundamental catalysts. The $70,166 price point is a battleground, and the immediate price action around the $70,373.33 resistance will be key. Traders should remain vigilant, as a false breakout could lead to significant losses for those caught on the wrong side.
Bearish Scenario: Resistance Holds Firm
65% ProbabilityNeutral Scenario: Consolidation Around Resistance
25% ProbabilityBullish Scenario: Resistance Breakthrough
10% ProbabilityThe current setup suggests that the path of least resistance might be downwards in the short term, especially if the $70,373.33 resistance holds. A move back towards the $69,271.33 support level seems more probable than an immediate surge to new all-time highs. However, the cryptocurrency market is known for its volatility, and a strong catalyst could quickly shift the sentiment. For now, caution is advised, and traders should wait for a clear signal rather than anticipating a move.
Frequently Asked Questions: BTCUSD Analysis
What happens if BTCUSD fails to break above the $70,373.33 resistance?
If BTCUSD fails to break above $70,373.33, a bearish scenario becomes more probable. This could lead to a pullback towards the 4-hour support levels at $69,271.33 and potentially $68,169.33, as sellers might step in to take profits.
Should I consider buying BTCUSD around current levels of $70,166 given the RSI at 65.29?
Buying at current levels around $70,166 with an RSI of 65.29 carries risk. While momentum is strong on the 1H chart, the approaching resistance and potential daily bearish divergence suggest waiting for a clearer signal or a pullback to a stronger support level before entering long positions.
Is the MACD histogram signal on the daily chart a sell signal for BTCUSD at $70,166?
The daily MACD histogram shows positive momentum, but its trend and potential divergence should be monitored closely. It's not an outright sell signal yet, but it indicates that the bullish conviction driving the price might be waning, warranting caution against aggressive long positions.
How might the strengthening DXY at 99.39 impact BTCUSD trading near $70,166?
A strengthening DXY at 99.39 typically puts downward pressure on risk assets like BTCUSD. This macro headwind could contribute to the bearish case if Bitcoin fails to break through its immediate resistance, potentially accelerating any pullback towards support levels.
Track markets in real-time
AI-powered analysis, technical indicators and real-time price data.
Join Our Telegram Channel
Breaking market news, AI analysis and trading signals instantly.
Join Channel