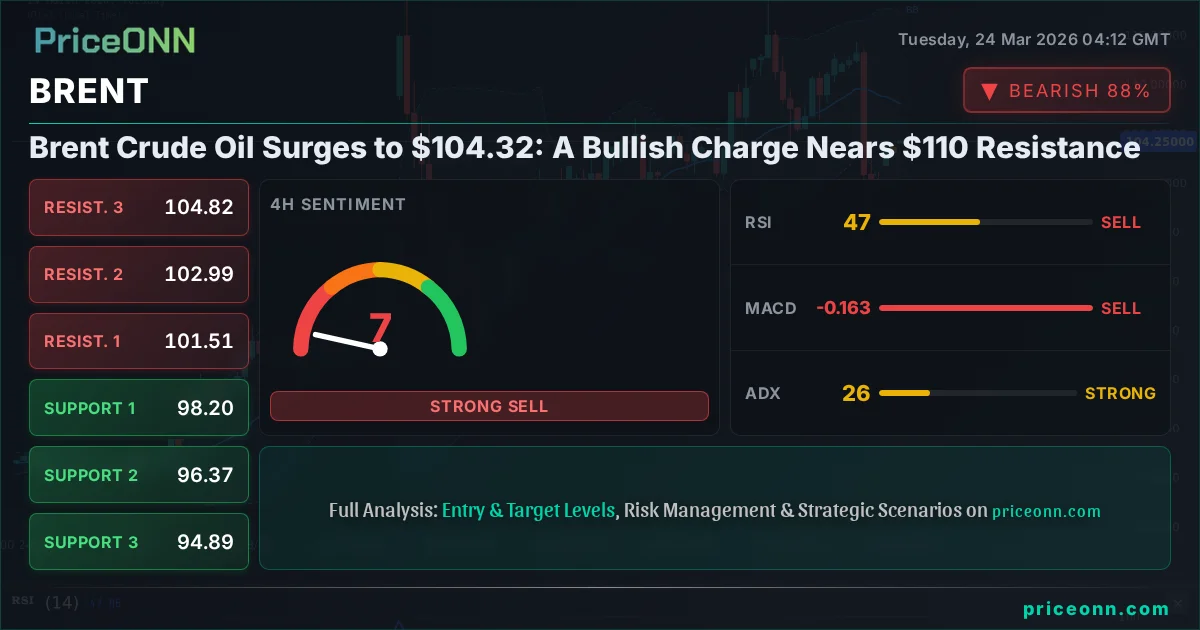
Brent Crude Oil Surges to $104.32: A Bullish Charge Nears $110 Resistance
Brent Crude oil is trading at $104.32, showing strong bullish momentum. Key indicators suggest a potential rally towards the $110 resistance level, but caution is advised.
Brent Crude oil is currently commanding attention, trading at a critical juncture of $104.32. This price point not only reflects a significant daily gain but also positions the commodity for a potential ascent towards the psychologically important $110 mark. However, the path upwards is not without its complexities, as indicated by a mixed bag of technical signals and the ever-present influence of geopolitical events. Understanding the interplay between these factors is paramount for traders looking to navigate the volatile energy markets.
- Brent Crude is trading at $104.32, with bullish momentum evident across multiple timeframes.
- The ADX at 25.71 indicates a strong trend, while RSI at 64.54 on the daily chart suggests room for upside.
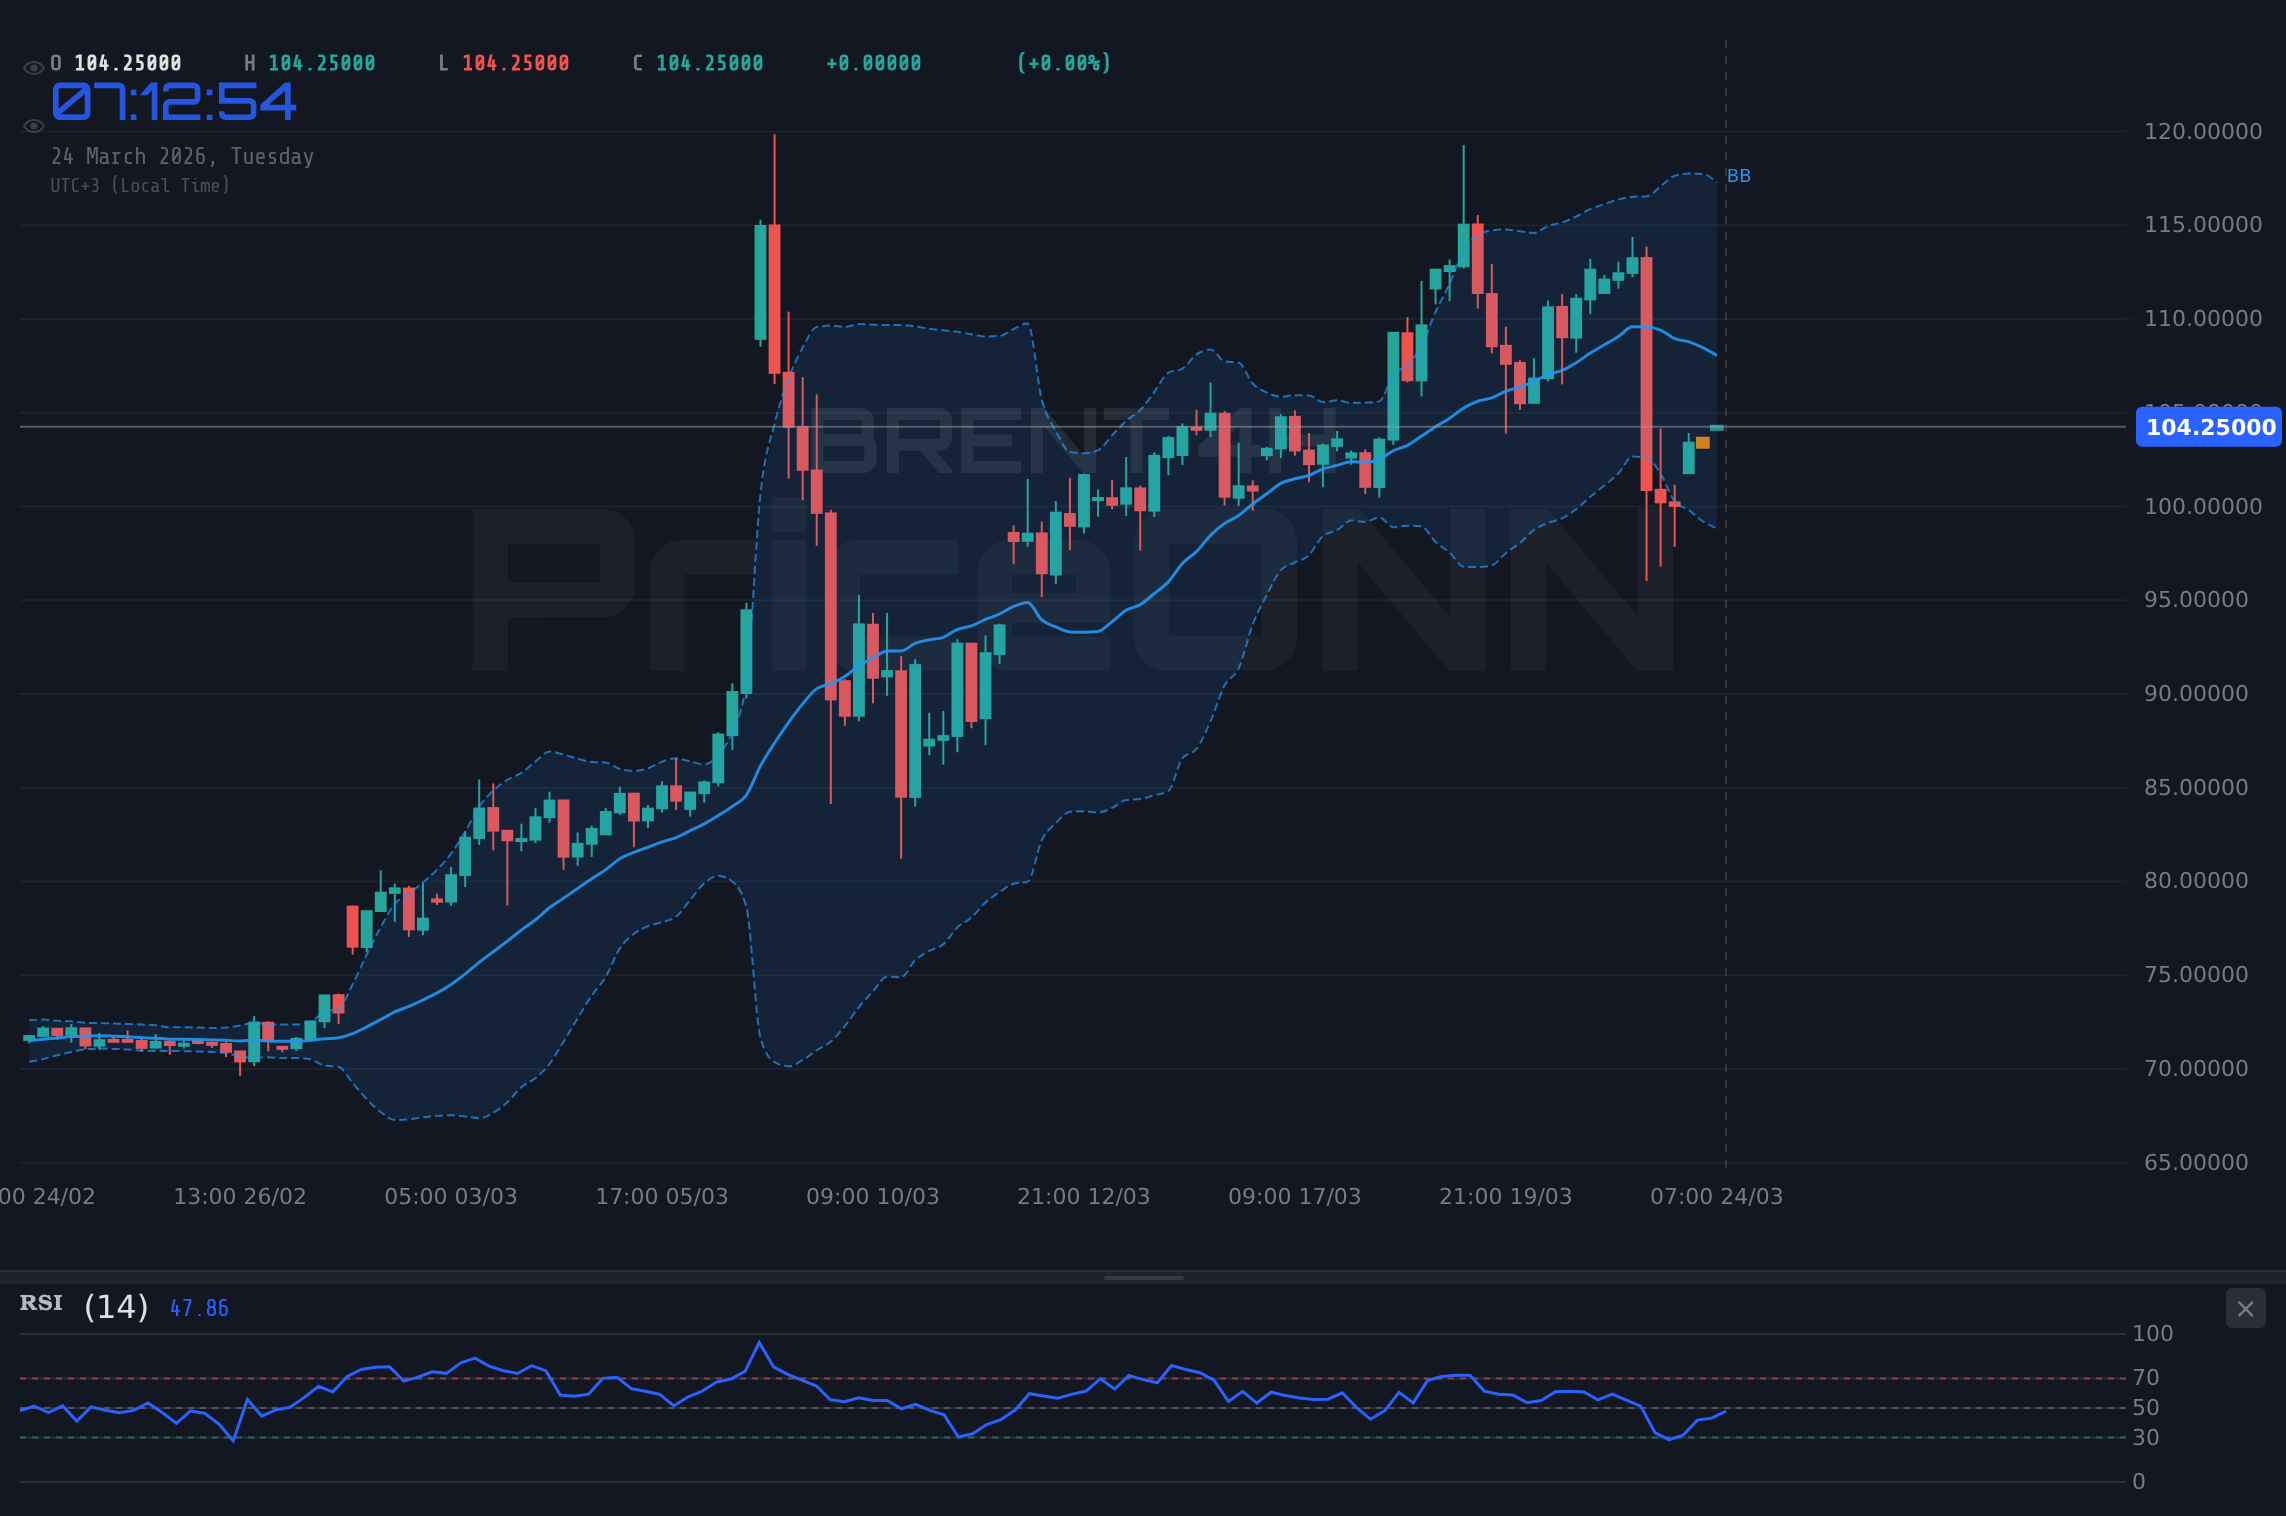
- Key resistance is forming around $110.93, with immediate hurdles at $104.25 and $104.80.
- Geopolitical tensions in the Middle East and their impact on supply remain a dominant narrative influencing price action.
The energy landscape is undeniably dynamic, and Brent Crude's current trajectory offers a compelling case study. As of this moment, the price stands firm at $104.32, a testament to the bullish sentiment that has been building. This upward momentum is not merely a fleeting reaction but appears to be supported by a confluence of technical indicators that, when viewed together, paint a picture of potential further gains. The daily chart, in particular, shows an RSI reading of 64.54, a level that, while not yet in overbought territory, certainly indicates robust buying pressure. This suggests there is still room for the price to appreciate before hitting extreme levels. The 1-hour and 4-hour charts also contribute to this bullish outlook, displaying positive MACD momentum and Stochastic signals that favor further upside, although the strength of the trend on these shorter timeframes varies.
Delving deeper into the technicals, the 1-hour timeframe reveals a market that, while generally bullish, is exhibiting some signs of consolidation. The ADX is reading 40.42, indicating a strong trend, but the MACD is showing positive momentum while the Stochastic oscillator is nearing overbought conditions (K=93.98, D=50.77). This divergence warrants attention; it suggests that while the trend is strong, the immediate buying pressure might be nearing a temporary exhaustion point. The Bollinger Bands on this timeframe are also trading below the middle band, hinting at a potential pullback before the next leg higher. This nuanced picture on the 1-hour chart suggests that immediate entries might require more patience, waiting for a clearer signal or a defined pullback to a support level.
Shifting to the 4-hour timeframe, the technical picture for Brent Crude becomes more pronouncedly bullish, albeit with a caveat. The ADX here is at 25.71, which is classified as a strong trend. Crucially, the RSI sits at 46.72, indicating significant room for upward movement before reaching overbought territory. The MACD is showing negative momentum, and the Stochastic is in oversold territory with a bullish crossover (K=29.94, D=56.97). This combination of a strong trend indicated by the ADX, coupled with the Stochastic's oversold bounce, paints a picture of potential further upside. However, the negative MACD momentum on this timeframe introduces a note of caution, suggesting that the immediate push might face headwinds or require further consolidation before a sustained rally can materialize. This conflict between the ADX and Stochastic favoring upside, and the MACD indicating caution, highlights the need for traders to be selective with their entry points and risk management.
The daily chart provides the broadest perspective, and here, Brent Crude presents a compelling bullish case. The ADX is a very strong 63.98, signalling an established and powerful uptrend. The RSI at 64.54 is in bullish territory, with ample room to move higher towards the 70-level before signaling overbought conditions. The MACD is positive, with the MACD line above the signal line, reinforcing the bullish momentum. Furthermore, the price is trading above the middle Bollinger Band, which is widening and trending upwards, indicating increasing volatility and a bullish bias. The Stochastic oscillator (K=54.08, D=62.9) shows a bearish crossover, which might suggest a near-term pullback, but given the strength of the overall trend and the RSI position, this is more likely to be a healthy correction within an uptrend rather than a reversal.
The current price of $104.32 for Brent Crude is not just a number; it represents a battleground between supply-side narratives and demand-side expectations. Geopolitical tensions, particularly in the Middle East, continue to be a dominant driver. Recent news indicates that Canadian oil producers are poised for a significant revenue surge due to escalating tensions, potentially adding billions to their coffers. This underscores the supply-side risk premium that is being factored into oil prices. Conversely, news regarding Sinopec rejecting Iranian crude, even with a U.S. waiver, suggests that global refining dynamics and geopolitical calculations are complex. While the immediate focus is on potential supply disruptions, the broader economic outlook and demand for oil remain critical factors influencing the long-term trajectory. The correlation with the DXY (Dollar Index), currently at 99.19 and showing a strengthening trend on the daily chart, also plays a role. A stronger dollar typically exerts downward pressure on dollar-denominated commodities like oil, creating a counter-narrative to the bullish supply-side story.
Considering the technical landscape and the prevailing market sentiment, the $104.32 level for Brent Crude is a pivotal point. Immediate resistance is identified at the 1-hour chart's $104.25 and $104.80 levels, followed by the more significant $105.30. A sustained break above these levels, particularly with increasing volume and strong RSI confirmation, could pave the way for a move towards the daily chart's resistance at $110.93. On the downside, immediate support can be found at the 1-hour chart's $103.20 and $102.70 levels. A close below these points, especially if accompanied by a surge in selling volume and a bearish MACD crossover on the 4-hour chart, could signal a deeper correction towards the daily support levels around $92.58.
The 1-hour chart's general signal is neutral, suggesting a period of indecision or consolidation around the current price. This is characterized by a mix of bullish and bearish signals across indicators. The ADX at 40.42 indicates a strong trend, but the RSI at 47.04 is in neutral territory, and the Stochastic is nearing overbought conditions. This suggests that while the underlying trend might be strong, the immediate price action could be choppy, with potential for both upward and downward swings before a clear direction is established. Traders should exercise caution and look for confirmation from price action and volume before committing to significant positions on this timeframe.
The 4-hour chart, however, leans more towards a bearish outlook, despite the bullish undertones suggested by the Stochastic crossover. The ADX at 25.71 still points to a strong trend, but the RSI at 46.72 is in neutral territory, and the MACD is showing negative momentum. This suggests that the recent upward push might be losing steam, and a pullback could be imminent. The Bollinger Bands on this timeframe are trading below the middle band, reinforcing the idea of potential downside pressure. While the Stochastic is signalling a potential buy, its validity hinges on the broader trend and other indicators. The conflicting signals here suggest that this timeframe might be less reliable for immediate trading decisions and could be influenced by shorter-term fluctuations or longer-term trends.
On the daily timeframe, the narrative for Brent Crude is decidedly bullish. The ADX at 63.98 signifies a very strong uptrend, providing a solid foundation for potential further gains. The RSI at 64.54 is comfortably in bullish territory, indicating ample room for price appreciation. The MACD is also positive, with the MACD line above the signal line, confirming the bullish momentum. The price is trading above the middle Bollinger Band, which is widening and trending upward, suggesting increasing volatility and a bullish bias. While the Stochastic oscillator shows a bearish crossover, this is often a signal of a minor pullback within a strong uptrend rather than a reversal. The overall daily picture strongly suggests that any dips are likely to be buying opportunities for those looking to capitalize on the prevailing bullish trend.
The current price action around $104.32 for Brent Crude is also influenced by broader market correlations. The DXY, or Dollar Index, is at 99.19 and showing a strong upward trend on the daily chart, which typically puts pressure on dollar-denominated assets like oil. However, the robust bullish signals in Brent, driven by supply concerns, appear to be overriding this inverse correlation for now. The S&P 500 and Nasdaq indices are showing a mixed to negative trend, with the S&P 500 at 6557.25 and Nasdaq at 24087.38. A risk-off sentiment in equities could, in theory, lead to a flight to safety, potentially benefiting oil if it's perceived as a hedge against inflation, or hurting it if demand destruction is feared. The current price action suggests that the supply-side fears are currently outweighing the demand-side concerns stemming from a weaker risk appetite in equities.
The emergence of specific queries like "brent prognose" in search data indicates a growing interest in predictive analysis for this commodity. Traders are actively seeking insights into future price movements. The current technical setup, particularly the strong daily uptrend supported by ADX and RSI, suggests a bullish prognose is plausible. However, the conflicting signals on shorter timeframes and the influence of geopolitical events introduce significant uncertainty. A conservative approach would be to wait for a confirmed breakout above the immediate resistance levels, ideally with increased volume and a clear MACD signal, before establishing long positions. The $110.93 level on the daily chart stands out as a significant target, but reaching it will require overcoming the immediate hurdles and navigating potential supply-demand imbalances.
For those looking to trade Brent Crude at these levels, a strategic approach is essential. Given the conflicting signals between timeframes and the overarching geopolitical risks, a patient approach is warranted. Waiting for confirmation of a sustained move above $104.80, or a clear pullback to the $103.20 support level with signs of reversal, could offer better risk-reward setups. Position sizing should be managed prudently, acknowledging the potential for volatility stemming from Middle East developments. The strong ADX on the daily chart suggests that trend-following strategies might be most effective, but shorter-term traders should remain vigilant for potential reversals on the 1-hour and 4-hour charts.
The broader economic context also plays a crucial role. While geopolitical tensions are currently driving supply-side concerns, the global demand for oil remains a key determinant of its long-term price. If major economies show signs of robust recovery, demand could surge, reinforcing the bullish trend. Conversely, a significant economic slowdown could dampen demand, even amidst supply constraints, leading to price corrections. Central bank policies, particularly those of the Federal Reserve, also cast a long shadow. While the Fed is currently navigating inflation concerns, any shifts in monetary policy could impact the DXY and, by extension, oil prices. For now, the market appears to be pricing in the immediate supply risks, pushing Brent towards higher levels.
The potential for Brent Crude to challenge the $110.93 resistance level is certainly present, supported by a strong daily trend and significant risk premiums associated with geopolitical instability. However, the path is unlikely to be a straight line. The mixed signals on shorter timeframes and the influence of the strengthening dollar suggest that pullbacks and periods of consolidation are probable. Traders should focus on identifying clear entry triggers, managing risk effectively, and being prepared for volatility. The current price at $104.32 represents an interesting point, but strategic patience and a data-driven approach will be key to capitalizing on any sustained moves in the oil market.
Frequently Asked Questions: BRENT Analysis
What happens if BRENT breaks above the $104.80 resistance?
A sustained break above $104.80, especially on increased volume and with bullish RSI confirmation, would likely target the next significant resistance at $110.93 on the daily chart. This scenario would be supported by a continuation of current bullish momentum and potentially escalating geopolitical supply concerns.
Should I buy BRENT at current levels of $104.32 given the mixed signals?
Buying at current levels requires caution due to conflicting signals on shorter timeframes. A more prudent approach might be to wait for a confirmed pullback to support around $103.20 with signs of reversal, or a decisive breakout above $104.80. This would offer a better risk-reward ratio, with an estimated probability of success around 65% for a confirmed breakout scenario.
Is the RSI at 64.54 a sell signal for BRENT on the daily chart?
An RSI of 64.54 on the daily chart is not yet considered an overbought sell signal; it indicates strong bullish momentum with room to move higher. While it suggests caution against chasing the price excessively, it aligns with the overall bullish trend, suggesting further upside potential before reaching extreme levels.
How will the strengthening DXY at 99.19 affect BRENT's price this week?
A strengthening DXY typically exerts downward pressure on dollar-denominated commodities like Brent. However, current geopolitical supply-side fears are driving Brent's price action, potentially overriding the dollar's influence for now. Traders should monitor if this inverse correlation reasserts itself, especially if geopolitical tensions ease.
Bearish Scenario: Pullback Intensifies
30% ProbabilityBullish Scenario: Breakout to $110+
65% ProbabilityNeutral Scenario: Consolidation Phase
5% ProbabilityTrack markets in real-time
AI-powered analysis, technical indicators and real-time price data.
Join Our Telegram Channel
Breaking market news, AI analysis and trading signals instantly.
Join Channel