EURUSD Dips to $1.1578: Key Support Tested Amidst Mixed Signals
EURUSD struggles below $1.16, testing critical support at $1.1577. Mixed indicators and DXY strength point to caution. Technical breakdown looms if support fails.
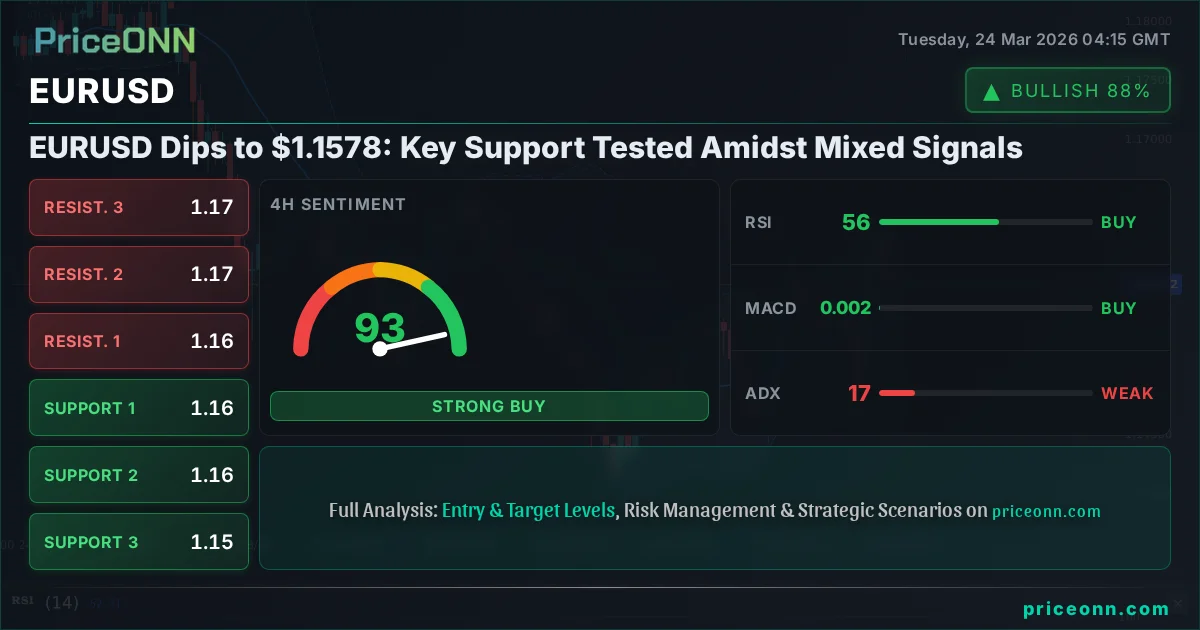
EURUSD is currently trading at $1.1578, having dipped below the $1.16 handle and testing a crucial support level. The pair has seen a notable decline, driven by a strengthening US Dollar Index (DXY) and mixed technical signals across multiple timeframes. This price action warrants a closer look at the underlying drivers and what the charts are telling us about the potential for further downside or a much-needed bounce.
- EURUSD is trading at $1.1578, testing the $1.1577 support level.
- The Dollar Index (DXY) is showing strength, currently at 99.21, pressuring the Euro.
- Technical indicators present a mixed picture: 1H and 4H suggest caution, while the 1D chart shows oversold conditions potentially offering a floor.
- ADX readings indicate weak to strong trends across timeframes, suggesting choppy conditions or the potential for a committed move.
- Geopolitical news regarding Iran and energy prices is adding a layer of complexity to currency markets.
The daily chart for EURUSD paints a picture of persistent bearish pressure. With the price currently hovering around $1.1578, it's flirting with the first key support level at $1.1577. This isn't just a random number; it represents a significant area where buyers have historically stepped in. However, the overall trend on the daily timeframe is firmly bearish, with an ADX of 35.48 indicating a strong trend is in play. The RSI(14) sits at 45.39, firmly in neutral territory but leaning towards a bearish sentiment, suggesting there's still room for downward momentum without immediately signalling an oversold condition. MACD is showing positive momentum on the daily, but it's still below the signal line, which can sometimes precede a trend reversal or continuation. The Bollinger Bands are also positioned below the middle band, reinforcing the bearish tilt on the daily perspective. This suggests that while a bounce might be tempting, the larger trend is still down.
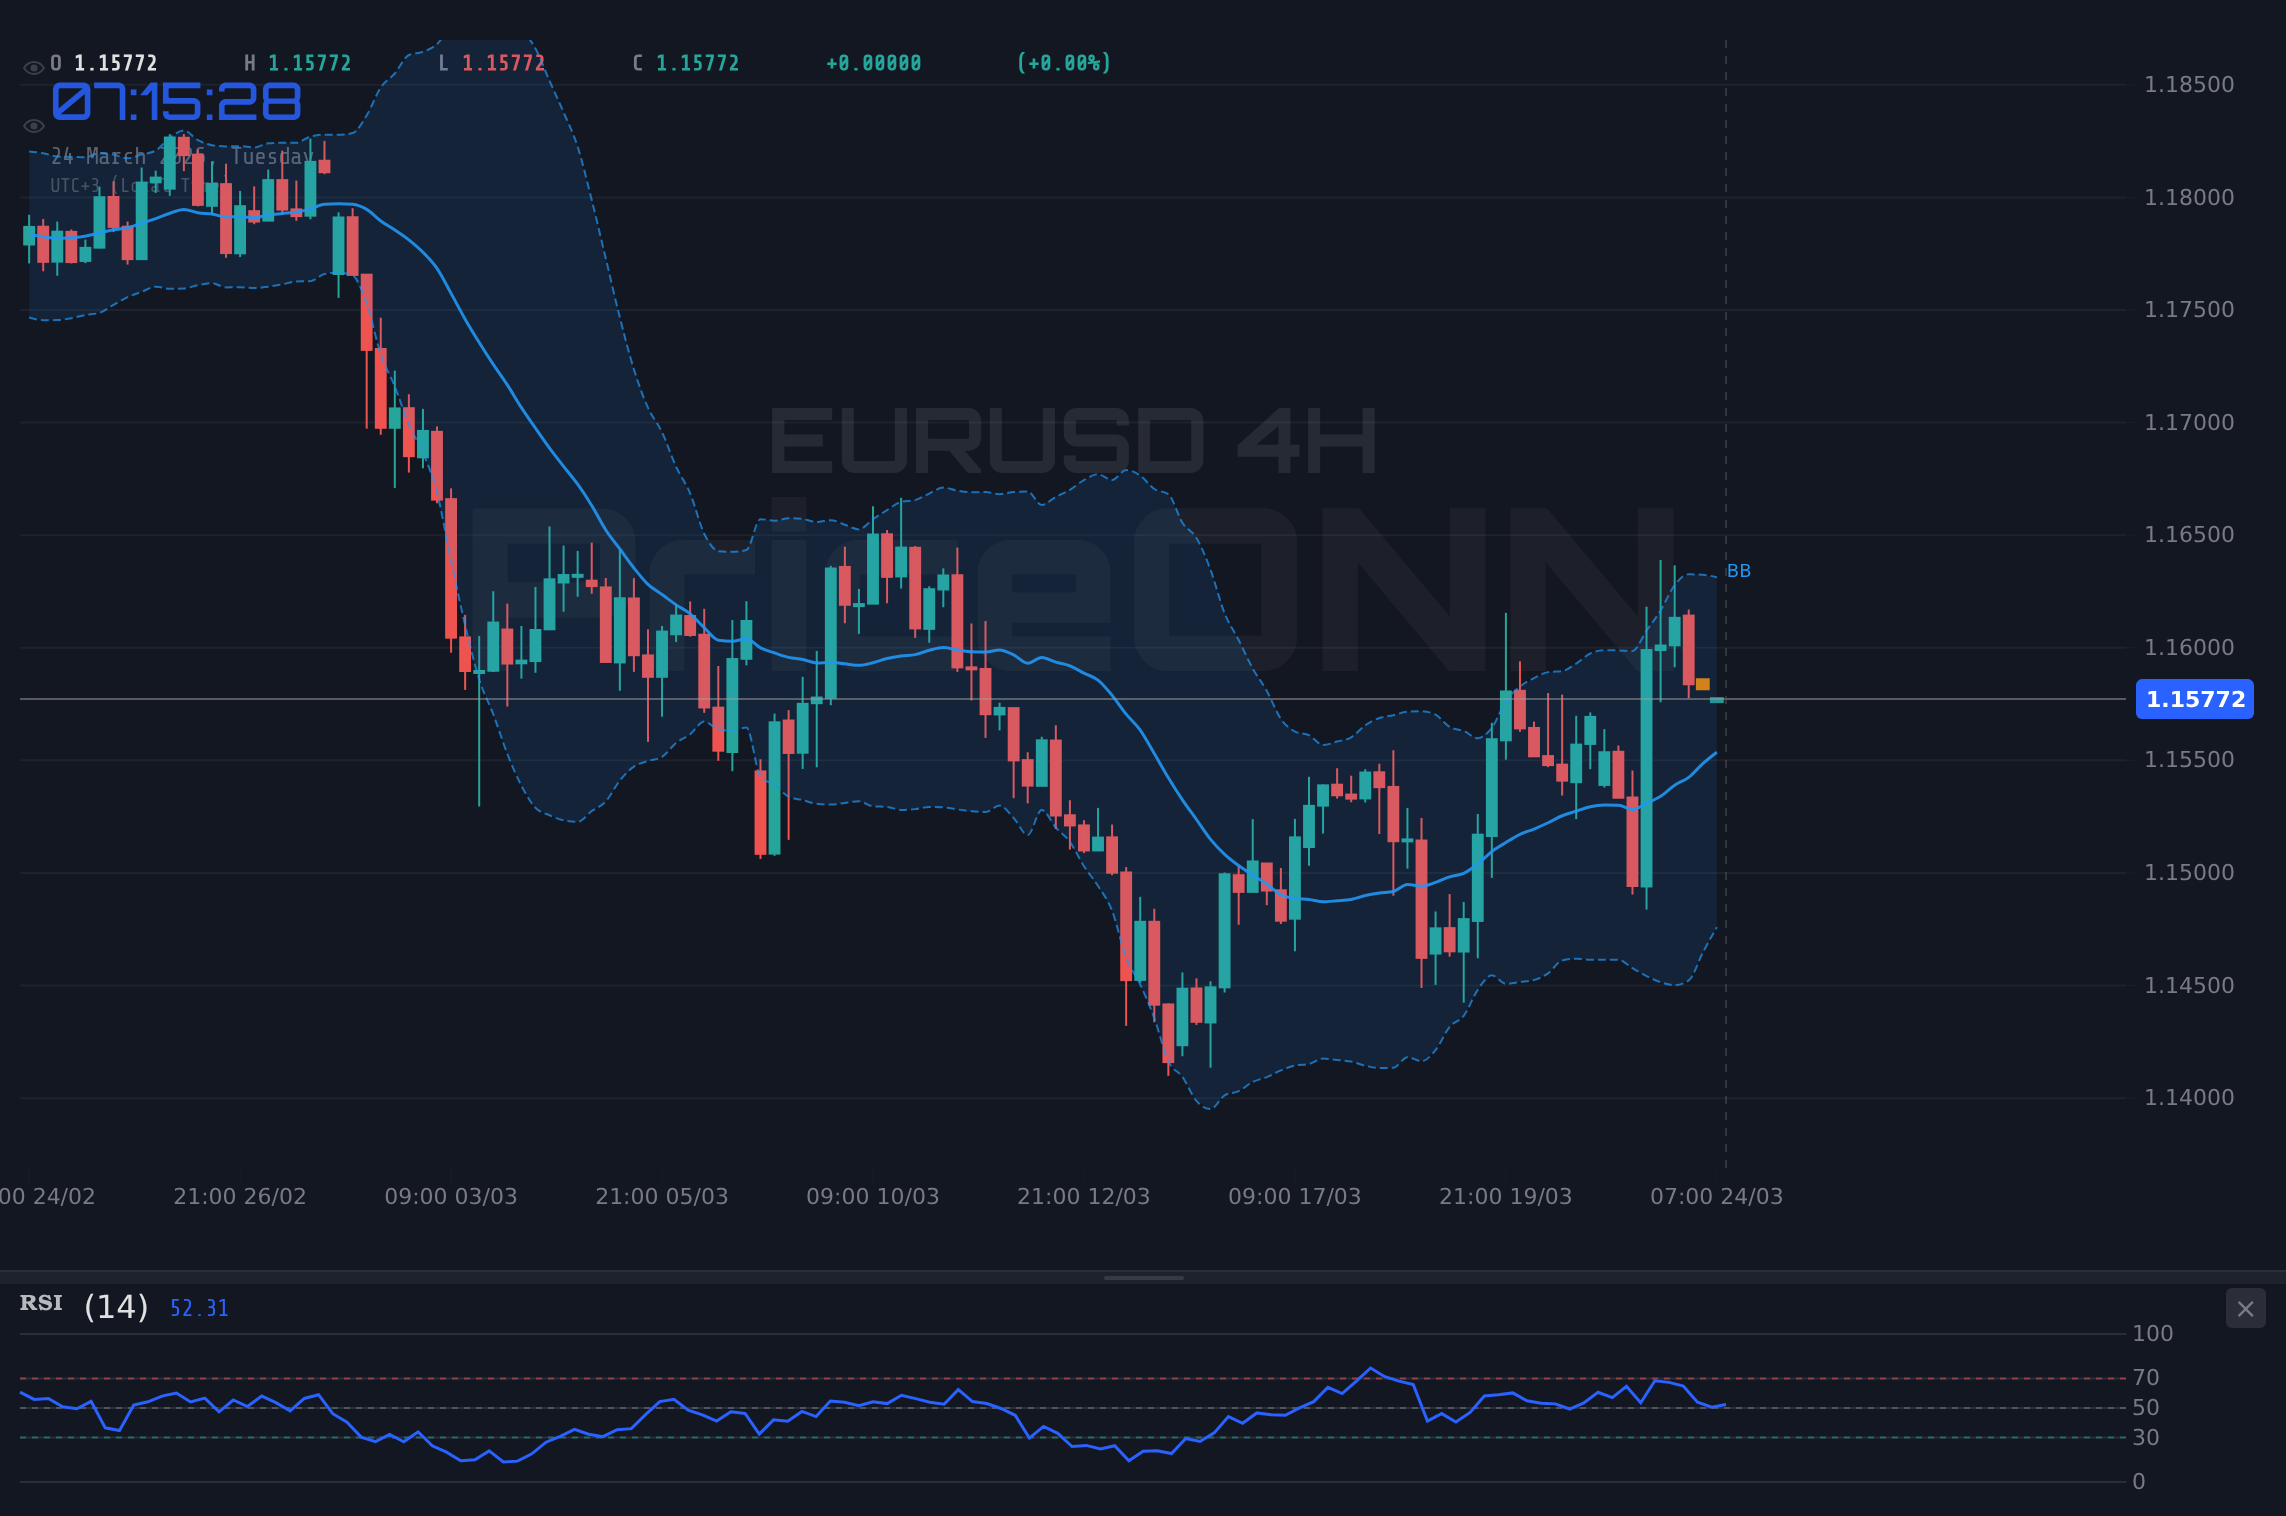
Zooming into the 4-hour chart, the picture becomes slightly more nuanced, though still favouring caution. EURUSD is trading at $1.1578, and the identified support is at $1.15909, with further levels at $1.15684 and $1.15456. Resistance is seen at $1.16362. The RSI(14) is at 56.05, indicating a more neutral to slightly bullish leaning, which contrasts with the daily view. MACD shows positive momentum and is above the signal line, a sign that short-term buying pressure might be emerging. Stochastic is also showing a bullish signal with K at 74.46 and D at 51.21, suggesting upward movement is possible from current levels, especially since it's moving out of the oversold zone. However, the ADX at 16.63 signifies a weak trend, implying that any upward move might lack conviction and could easily reverse. This choppy condition on the 4-hour chart means that while buyers might try to push, the overall trend still dictates a cautious approach.
On the 1-hour chart, the picture is even more mixed. EURUSD is currently at $1.1578, with immediate resistance at $1.15903 and support at $1.1581. The RSI(14) is hovering around 50.29, perfectly neutral, offering no clear directional bias. The MACD, while showing negative momentum and below the signal line, is close to crossing over, hinting at potential short-term volatility. Stochastic is deeply oversold at K=10.38 and D=36.06, flashing a strong sell signal but also indicating that the market is technically due for a bounce if buyers step in. The ADX at 24.88 suggests a moderately strong trend, but given the conflicting signals from other indicators, it's more likely reflecting short-term noise rather than a committed directional move. The general signal for the 1-hour timeframe leans towards 'SELL' (Al: 3, Sat: 5, Nötr: 0), indicating that despite potential intraday fluctuations, the immediate pressure remains to the downside.
The US Dollar Index (DXY) is a critical piece of the EURUSD puzzle. Currently trading at 99.21, it has seen a significant daily gain of 0.45%, pushing higher from 98.79 to 99.07. This strengthening dollar is a major headwind for the Euro. When the DXY strengthens, it typically puts pressure on major currency pairs like EURUSD, as the Euro becomes relatively more expensive for holders of dollars. The DXY's daily trend is classified as 'Uptrend' with 91% strength, supported by an ADX of 32.74. While the 1-hour chart shows a neutral trend, the daily chart's upward trajectory is undeniable. This continued dollar strength reinforces the bearish outlook for EURUSD, suggesting that any rallies might be short-lived unless there's a significant shift in market sentiment or a change in the DXY's trend.
Recent news flow adds another layer of complexity. Reports suggest that the Euro saw a notable rebound against the US Dollar earlier, climbing to near 1.1613 following news of a truce related to Iran. However, the current price action shows EURUSD has retreated from those highs, now trading at $1.1578. This suggests that the geopolitical 'relief rally' may have been short-lived, or that the strengthening dollar and broader risk-off sentiment are overriding these specific news events. San Francisco Fed President Mary Daly also indicated that geopolitical tensions are complicating the inflation outlook, which could influence Fed policy and, by extension, the dollar's strength. The conflicting narratives – a potential de-escalation in the Middle East versus persistent inflation concerns and a strong dollar – create an environment of uncertainty.
Looking at the broader market context, the S&P 500 and Nasdaq are both showing signs of weakness, trading down 0.39% and 0.44% respectively. This decline in major US equity indices typically correlates with a 'risk-off' sentiment in the markets. When investors become more risk-averse, they tend to move capital away from riskier assets like equities and emerging market currencies, often flocking to safe-haven assets such as the US dollar, US Treasuries, and sometimes gold. While gold prices are also down today (-1.27% for XAUUSD), the general risk-off tone observed in equities reinforces the demand for the dollar, further contributing to the pressure on EURUSD. This correlation underscores the interconnectedness of global markets; weakness in one area often spills over into others.
The commodity markets are also providing context. Brent crude oil prices are up significantly today (4.38%), and WTI crude is also showing a strong upward move (3.46%). This rise in oil prices is often linked to geopolitical tensions, particularly in the Middle East, and can fuel inflation expectations. While higher oil prices might typically support commodity-linked currencies, they can also indirectly strengthen the dollar if they contribute to broader inflation concerns that lead to expectations of tighter monetary policy from the Federal Reserve. For EURUSD, the immediate impact of rising oil prices is less direct than the impact of dollar strength, but it adds to the overall global economic uncertainty.
Let's delve into the specific technical indicators and their implications. On the 1-hour chart, the RSI is 50.29, a perfect neutral reading, offering no directional clues. However, the Stochastic indicator is deeply oversold at K=10.38, suggesting a potential bounce is due, though the D value at 36.06 means it's not yet in a clear reversal pattern. The MACD shows negative momentum, but is hovering near the signal line, indicating potential for a crossover. The ADX at 24.88 suggests a moderate trend is active. The overall signal is 'SELL', highlighting the short-term bearish bias despite the oversold Stochastic.
The 4-hour timeframe presents a slightly more constructive picture for potential buyers, although caution is still advised. The RSI is at 56.05, moving towards overbought territory but still with room to run. The Stochastic is bullishly configured, with K=74.46 and D=51.21, indicating upward momentum. The MACD is positive and above the signal line. However, the ADX at 16.63 is a major red flag, signalling a very weak trend. This means that any upward move could be easily reversed, and the market is likely to remain range-bound or choppy. The general signal for the 4-hour chart is 'BUY' (Al: 7, Sat: 1, Nötr: 0), but this strength is tempered by the weak ADX reading.
On the daily chart, the indicators lean more towards a potential reversal or at least a pause in the downtrend. The RSI is at 26.2, deep in oversold territory, historically a strong signal for a potential bottom or at least a significant bounce. The Stochastic is also oversold, with K=17.67 and D=12.8, further reinforcing this idea. The MACD is negative and below the signal line, but the histogram is narrowing, which could precede a bullish crossover. The ADX at 25.72 indicates a strong downtrend is present, but when combined with oversold oscillators, it can sometimes signal that the trend is exhausting itself. The general signal on the daily chart is 'SELL' (Al: 3, Sat: 5, Nötr: 0), but the extreme oversold readings on RSI and Stochastic suggest that sellers might be losing control.
Considering the interplay between these timeframes and indicators, the EURUSD pair is at a critical juncture. The daily chart is oversold, hinting at a potential bounce, while the 1-hour and 4-hour charts show mixed signals with a slight bearish bias on the 1-hour and a weak bullish bias on the 4-hour, complicated by a weak ADX. The overarching influence of the strengthening DXY at 99.21 cannot be ignored, as it continues to put downward pressure on the Euro. Geopolitical news has provided fleeting support, but the fundamental strength of the dollar and the bearish technical setup on longer timeframes seem to be dominant factors currently.
The key levels to watch are paramount. Immediate support is found at $1.1577 on the 1-hour chart, followed by $1.15717. A break below these levels could open the door towards the 4-hour support at $1.15684 and potentially down to $1.15456. On the upside, immediate resistance is seen at $1.15903, with a more significant level at $1.15996 on the 1-hour chart. A sustained move above these resistance levels, particularly breaking through the 4-hour resistance at $1.16362, would be required to invalidate the current bearish outlook and signal a potential trend change.
Bearish Scenario: Downside Momentum Continues
70% ProbabilityNeutral Scenario: Range-Bound Consolidation
20% ProbabilityBullish Scenario: Oversold Bounce
10% ProbabilityFrequently Asked Questions: EURUSD Analysis
What happens if EURUSD breaks below the $1.1577 support level?
If EURUSD closes below $1.1577 on the 1-hour chart, the bearish scenario becomes more probable. This could lead to further declines targeting the next support levels at $1.15684 and potentially $1.15456, driven by sustained dollar strength and risk-off sentiment.
Should I consider buying EURUSD at current levels of $1.1578 given the oversold daily RSI?
While the daily RSI at 26.2 suggests oversold conditions, the immediate trend remains bearish, and the DXY is strong. A buy decision at current levels carries significant risk. A more prudent approach would be to wait for confirmation, such as a clear break above immediate resistance at $1.15903 or a sustained move above $1.16362, indicating a shift in momentum.
Is the MACD signal on the 4-hour chart a reliable buy signal for EURUSD at $1.1578?
The MACD on the 4-hour chart is positive and above the signal line, which is a bullish signal. However, it's accompanied by a very weak ADX of 16.63, suggesting the trend lacks strength. Therefore, while it indicates potential upward momentum, it should not be solely relied upon as a buy signal without further confirmation from price action or other indicators.
How will the ongoing geopolitical tensions impact EURUSD this week, given the current price action?
Geopolitical tensions, particularly concerning Iran, have created volatility. While initial news of a truce briefly boosted EURUSD, the pair has since retreated, suggesting that broader market drivers like dollar strength and Fed policy expectations are currently more influential. Any escalation or de-escalation in these tensions could introduce significant volatility, but for now, the focus remains on technical levels and dollar dynamics.
| Indicator | Value | Signal | Interpretation |
|---|---|---|---|
| RSI (14) | 45.39 | Neutral | Daily RSI in neutral zone, leaning bearish. |
| MACD Histogram | -0.0015 | Bearish | Daily MACD below signal line, negative momentum. |
| Stochastic | K:17.67 D:12.80 | Bearish | Daily Stochastic in oversold zone, potential bounce. |
| ADX | 35.48 | Strong Trend | Daily ADX confirms a strong downtrend. |
| Bollinger Bands | Close below Middle Band | Watch | Daily price below middle band, bearish pressure. |
The market is a dance between fear and greed. Right now, fear seems to be dictating the steps for EURUSD, but the oversold daily indicators suggest a potential shift in rhythm could be imminent. Patience and discipline will be key for traders navigating these choppy waters.
Track markets in real-time
AI-powered analysis, technical indicators and real-time price data.
Join Our Telegram Channel
Breaking market news, AI analysis and trading signals instantly.
Join Channel