BTCUSD Trades Near $69,850; Support Holds at $69,434
Bitcoin hovers around $69,850 as traders eye key support at $69,434. The 1H chart shows mixed signals, with ADX indicating a weak trend, suggesting potential for consolidation or a breakout.
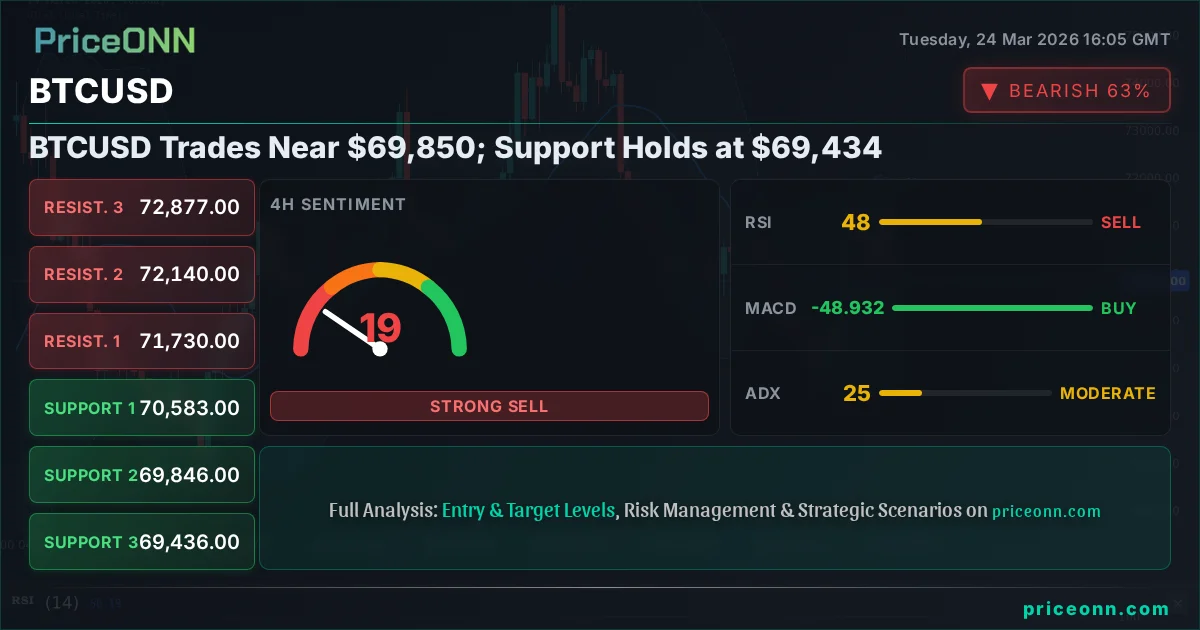
Bitcoin is currently consolidating near the $69,850 mark, a critical juncture where bulls and bears are locked in a tense standoff. Having recently tested the $71,344 resistance and subsequently pulled back, the market sentiment appears to be shifting, with a focus now on immediate support levels. The technical indicators paint a complex picture, hinting at a market that’s waiting for a decisive catalyst. This is precisely where you need to pay attention; the next move could set the tone for weeks to come.
- RSI at 42.52 on the 1H chart signals bearish momentum, but remains above oversold territory.
- The immediate support level to watch is $69,434, a level that has seen price interaction multiple times on the 1H chart.
- ADX at 21.47 suggests a weak trend on the 1H timeframe, indicating a lack of strong directional conviction.
- The correlation with the DXY, currently at 99.25, shows a potential headwind for BTCUSD if the dollar continues its ascent.
Navigating the Choppy Waters: BTCUSD's Current Technical Landscape
The 1-hour chart for BTCUSD presents a fascinating, albeit indecisive, technical setup. We're seeing the price action dance around the $69,850 level, a zone that has acted as both a pivot and a point of contention in recent trading sessions. The ADX, a measure of trend strength, sits at a somewhat unimpressive 21.47 on this timeframe. This reading tells us that while there might be price movement, it lacks the conviction of a strong, established trend. Think of it like a tug-of-war where neither side is gaining significant ground – plenty of effort, but not much progress. This weak trend environment often precedes a more significant move, but it makes short-term trading a game of patience and precise execution.
The Relative Strength Index (RSI) on the 1-hour chart is currently hovering around 42.52. This figure firmly places it in the neutral territory, leaning slightly towards bearish momentum. It's not screaming 'oversold' by any means, but it does suggest that the recent downward pressure has some legs, or at least hasn't been fully absorbed by buyers yet. Coupled with this, the Stochastic Oscillator is showing %K at 15.23 and %D at 58.04. This divergence, with %K well below %D and in the oversold region, offers a bearish signal on this shorter timeframe. However, it's crucial to remember that short-term indicators can be noisy. The real question is whether this bearish lean on the 1H chart aligns with the broader picture.
Looking at the Bollinger Bands on the 1-hour chart, BTCUSD is currently trading below the middle band. This often indicates a bearish bias in the short term. The bands themselves haven't widened dramatically, suggesting that volatility hasn't spiked to extreme levels, but the price's position implies it’s struggling to regain upward momentum. This technical picture on the 1H chart points towards caution. While there's no outright panic sell signal, the confluence of a weak ADX, a bearish-leaning RSI and Stochastic, and price action below the middle Bollinger band suggests that the path of least resistance, at least in the very short term, might be downwards, or at best, sideways.
The MACD indicator on the 1-hour timeframe is also flashing a negative momentum signal, with the MACD line below its signal line and the histogram in negative territory. This reinforces the short-term bearish sentiment. However, traders know that these shorter timeframes can whipsaw quickly. The real conviction will come from how these indicators behave on higher timeframes and whether key support levels hold. The immediate support level to watch, as provided in the market data, is $69,434. A decisive break below this level would certainly add weight to the bearish narrative we're seeing unfold on the 1-hour chart.
While the 1-hour indicators lean bearish, the lack of strong trend (ADX 21.47) suggests this could be a temporary pullback rather than a full reversal. Traders should be wary of shorting into immediate support without further confirmation.
The 4-Hour Perspective: Mixed Signals Amidst Shifting Trends
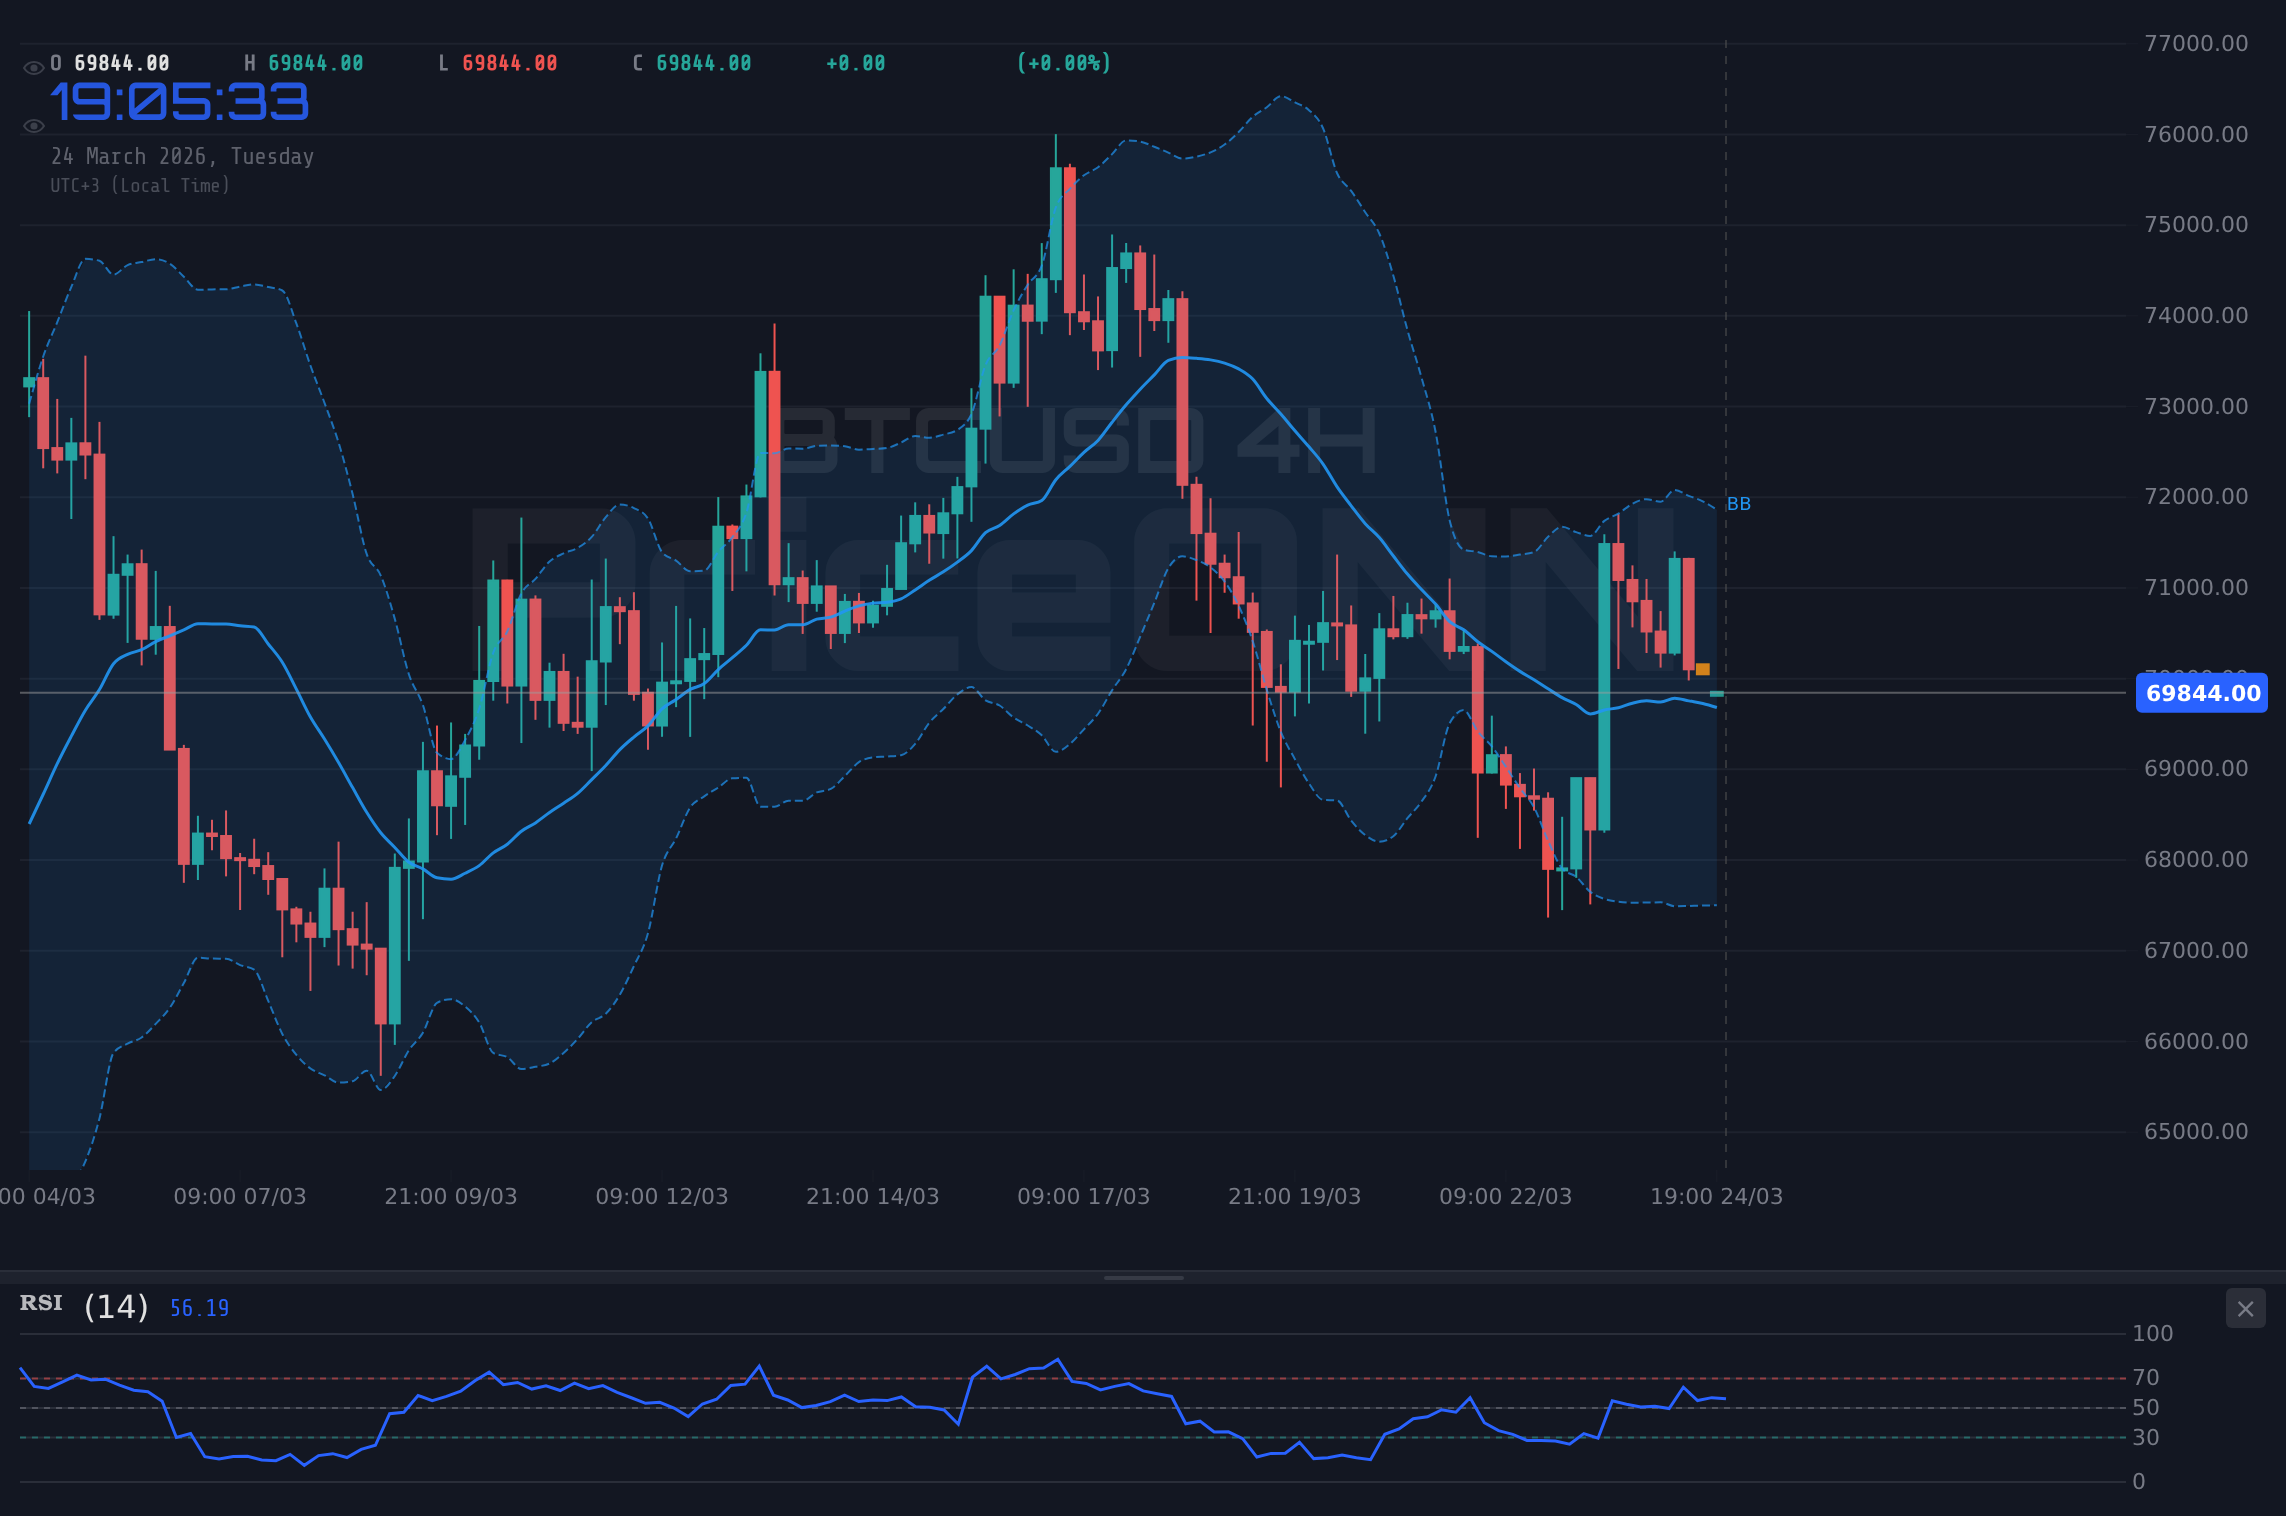
Stepping back to the 4-hour timeframe, the narrative for BTCUSD becomes more nuanced, highlighting the complexity of current market conditions. Here, the ADX stands at 24.86, which is still considered a moderate trend strength reading. It’s stronger than the 1-hour ADX, but not yet indicative of a powerful, sustained move. This suggests that while there's more directional conviction than on the 1-hour chart, it's still not a 'full commitment' kind of trend. This intermediate timeframe often captures the sentiment of active traders and swing players, and its reading implies a market that is on the cusp of something, but hasn't quite decided which way to break.
On the 4-hour chart, the RSI is reading 47.87. This places it squarely in neutral territory, showing a slight bearish tilt but far from oversold conditions. It indicates that sellers have had some influence recently, but buyers haven't been completely overwhelmed. The MACD indicator on this timeframe is showing positive momentum, with the MACD line above its signal line. This is a counterpoint to the 1-hour MACD and suggests that, despite the short-term pullback, underlying buying pressure might still be present on this intermediate timeframe. This is where the market starts to get interesting – conflicting signals between timeframes.
The Bollinger Bands on the 4-hour chart are positioned with the price currently above the middle band, which typically signals a bullish bias. This contradicts the price action seen on the 1-hour chart and adds to the confusion. The Stochastic Oscillator on the 4-hour chart presents K=69.59 and D=75.28. This shows a bearish signal, as %K is below %D and both are in the upper range, suggesting potential for a pullback from current levels. This bearish signal from the Stochastic on the 4-hour chart, despite the price being above the middle Bollinger band and MACD showing positive momentum, underscores the indecision.
The overall signal for the 4-hour timeframe leans towards 'SAT' (Sell) based on the provided data (Al: 3, Sat: 5). This suggests that the bearish signals, particularly from the Stochastic and the overall trend strength leaning towards a moderate trend that might be reversing, are carrying more weight. It paints a picture of a market that is perhaps topping out in the short to medium term, or at least consolidating before its next major move. The key support levels on this timeframe are $69,846 and $69,436. A close below these levels would solidify the bearish outlook from this chart perspective.
The conflicting signals between the 1H and 4H charts highlight a potential 'trap' scenario. A bearish lean on the 1H could lure short sellers, while the 4H's positioning above the middle band might tempt dip buyers. This is classic 'watch and wait' territory.
The Daily Chart: A Wider Lens on Potential Reversals
When we zoom out to the daily chart, the longer-term trend for BTCUSD appears to be in a neutral state, with a 50% trend strength. This is perhaps the most telling timeframe, as it reflects the sentiment of longer-term investors and the overall health of the market cycle. The ADX on the daily chart is at 18.75, indicating a weak trend. This reinforces the idea that Bitcoin might be in a period of consolidation or accumulation rather than a strong directional move. Such weak trend environments can be frustrating for trend followers but can present opportunities for range-bound traders or those anticipating a significant breakout.
The RSI on the daily chart is currently 48.47, sitting comfortably in neutral territory. This suggests neither extreme bullishness nor bearishness is dominating the longer-term sentiment. It implies that the market is balanced, with buyers and sellers in a relative equilibrium. This neutrality is often a precursor to a more significant price move, as energy builds up on either side. The MACD indicator on the daily chart is showing negative momentum, with the MACD line below its signal line. This is a bearish signal on the daily timeframe, suggesting that while the overall trend strength is weak, the immediate momentum is tilted towards the downside.
The Bollinger Bands on the daily chart are positioned with the price below the middle band. This is a bearish indication on the daily timeframe, suggesting that the longer-term trend might be under pressure. However, the bands themselves haven't expanded significantly, which aligns with the weak ADX reading and suggests that this isn't a period of high volatility or panic selling. The Stochastic Oscillator on the daily chart shows K=25.12 and D=27.53. Both are in the oversold region and exhibiting a bearish signal (%K < %D), which could suggest that further downside might be limited, or that a potential reversal could be brewing if these levels hold.
The overall signal for the daily timeframe, according to the provided data, is 'SAT' (Sell), with 1 'AL' (Buy), 7 'SAT' (Sell), and 0 'NÖTR' (Neutral). This overall bearish signal on the daily chart, despite the weak trend strength indicated by the ADX, warrants attention. It suggests that while a strong trend isn't in play, the prevailing momentum and positioning are leaning towards sellers. The key support levels on this longer timeframe are $68,263, $65,673, and $63,898. A break below these levels would signal a more significant downturn, potentially invalidating any short-term bullish hopes.
It's important to reconcile these daily signals with the shorter timeframes. The bearish momentum on the daily MACD, combined with the price below the middle Bollinger band, paints a cautious picture. However, the weak ADX and the neutral RSI suggest that this isn't a confirmed downtrend yet. This could be a period of distribution or consolidation before a potential move higher, especially if longer-term support levels hold firm. The market is clearly at a crossroads, and the interplay between these different timeframes will be critical in determining the next direction.
The daily chart's bearish MACD and price below the middle band are concerning. However, the weak ADX (18.75) and neutral RSI (48.47) suggest caution is warranted. A sustained move above the $70,389 resistance on the 1H chart would be the first sign of a potential shift.
Correlation Analysis: The Dollar's Shadow Over Bitcoin
In the current market climate, understanding the correlation between Bitcoin and traditional assets is more crucial than ever. The US Dollar Index (DXY) is currently trading at 99.25, and its movement often acts as a significant headwind or tailwind for risk assets like Bitcoin. As the DXY shows a strong upward trend on the daily timeframe (ADX 32.74) and is currently trading above its daily middle Bollinger band, it suggests underlying strength in the dollar. Historically, a strengthening dollar tends to put pressure on assets priced in dollars, including Bitcoin, as it becomes relatively more expensive for holders of other currencies.
The DXY's daily RSI is at 56.22, indicating a bullish leaning sentiment. This aligns with the overall 'AL' (Buy) signal for the DXY on the daily chart. If the dollar continues to gain strength, it could exacerbate the bearish pressure we're seeing on BTCUSD, especially if Bitcoin fails to hold its key support levels. The correlation isn't always perfect, as Bitcoin can sometimes decouple from traditional markets, but when the dollar is showing such clear directional strength, it's a factor that cannot be ignored by traders.
Furthermore, the performance of major equity indices like the S&P 500 and Nasdaq provides context for risk appetite. The S&P 500 is showing a bearish trend on the daily chart (ADX 45.34), currently trading below its middle Bollinger band, with an RSI of 36.51. Similarly, the Nasdaq 100 is also in a clear downtrend on the daily chart (ADX 39.41), with its RSI at 39.61. This broad risk-off sentiment in the equity markets suggests that investors might be reducing their exposure to riskier assets, which typically includes cryptocurrencies like Bitcoin. A sustained selloff in equities often correlates with a decline in Bitcoin, as both are perceived as higher-risk investments compared to safe-haven assets like the dollar or gold.
The Brent crude oil price is currently at $103.88, showing a strong upward trend on the daily chart (ADX 63.98) and trading above its middle Bollinger band, with an RSI of 64.22. Rising oil prices can signal increasing inflation expectations, which could put pressure on central banks to maintain or even increase interest rates. Higher interest rates generally make risk assets less attractive by increasing borrowing costs and offering higher yields on safer investments. While oil's direct correlation with Bitcoin is debated, its impact on inflation and monetary policy expectations is undeniable and can indirectly influence Bitcoin's price action.
"The interplay between the dollar's strength, equity market performance, and oil prices creates a complex macro backdrop for Bitcoin. Traders must monitor these correlations closely as they can significantly influence risk appetite and capital flows into digital assets."
Trade Scenarios: What Happens Next for BTCUSD?
Bearish Scenario: Testing the Depths
65% ProbabilityNeutral Scenario: Consolidation Phase
25% ProbabilityBullish Scenario: Reclaiming the Highs
10% ProbabilityWhat Needs to Happen for a Clear Setup?
The current technical setup for BTCUSD is best described as a 'watch zone.' The conflicting signals across different timeframes and the weak trend strength readings suggest that the market is hesitant. For a clear trading setup to emerge, we need to see one of the key levels decisively broken and confirmed. On the bearish side, a sustained close below the $69,434 support on the 1-hour chart, ideally followed by a similar break on the 4-hour chart, would signal a move towards lower targets, potentially reaching $68,479 or even the daily support at $65,673.
Conversely, for a bullish setup to materialize, Bitcoin needs to overcome the immediate selling pressure and break through the $70,389 resistance on the 1-hour chart. A successful retest of this level as support, followed by a move towards the next 1-hour resistance at $70,905 and then the 4-hour resistance at $71,344, would indicate that the bulls are regaining control. Confirmation would ideally come from higher timeframe indicators starting to align bullishly, such as the daily RSI moving back above 50 or the daily MACD showing signs of turning positive.
The neutral scenario, which currently holds a significant probability given the indecision, involves Bitcoin trading within a defined range. This could be the $69,434 to $70,389 range on the 1-hour chart, or a slightly wider band if volatility remains subdued. In such a scenario, traders might look for range-bound strategies, buying near support and selling near resistance, although the weak trend strength makes breakouts a constant threat. Patience is paramount here; forcing trades in a choppy market often leads to losses.
The influence of macroeconomic factors cannot be overstated. With the DXY showing strength and equity markets exhibiting weakness, any positive news for the dollar or further risk aversion could quickly push BTCUSD lower. Conversely, a sudden shift in risk sentiment, a dovish surprise from the Federal Reserve, or positive developments in Bitcoin-specific news (like regulatory clarity or significant institutional adoption) could spark a bullish breakout. Until then, the market is likely to remain in this tense equilibrium, with traders on high alert for the catalyst that breaks the stalemate.
Watch the $69,434 support level very closely. A failure to hold this level on a 4-hour closing basis would be the primary signal to consider bearish scenarios, targeting $68,479 initially. Conversely, a confirmed break above $70,389 on the 1H chart, followed by a 4H close above it, would suggest a potential move higher.
Frequently Asked Questions: BTCUSD Analysis
What happens if BTCUSD breaks below the $69,434 support level on the 4-hour chart?
A break below $69,434 on the 4-hour chart would likely trigger further selling pressure, potentially targeting the next daily support at $68,263. This would invalidate short-term bullish hopes and reinforce the bearish sentiment seen across shorter timeframes.
Should I consider buying BTCUSD at current levels around $69,850 given the mixed signals?
Buying at current levels carries significant risk due to the conflicting indicators and the proximity to the $69,434 support. A more prudent approach would be to wait for a clear signal, such as a confirmed break above $70,389 resistance or a decisive rejection at support with bullish confirmation.
Is the RSI at 47.87 on the 4-hour chart a sell signal for BTCUSD?
An RSI of 47.87 is in neutral territory, leaning slightly bearish. While not an immediate sell signal on its own, it indicates a lack of strong buying momentum. It suggests that sellers have some influence, but a confirmed bearish trend would require additional corroborating signals.
How will the current DXY strength around 99.25 affect BTCUSD's price this week?
The strengthening DXY, currently showing bullish momentum on daily charts, typically exerts downward pressure on risk assets like BTCUSD. If the dollar continues its ascent, it could contribute to further downside for Bitcoin, especially if key support levels fail to hold.
The market is currently a tug-of-war, with Bitcoin hovering around $69,850. While shorter timeframes show bearish leanings, the overall trend strength remains weak, suggesting indecision. Patience is key; waiting for a decisive break above $70,389 or a confirmed fall below $69,434 will provide a clearer path forward. Remember, managing risk and waiting for high-probability setups are the cornerstones of successful trading, especially in these choppy conditions.
| Indicator | Value | Signal | Interpretation |
|---|---|---|---|
| RSI (14) | 42.52 | Bearish | Neutral, leaning bearish momentum on 1H. |
| MACD Histogram | -1003 | Bearish | Negative momentum on 1H and Daily. |
| Stochastic | K:15.23, D:58.04 | Bearish | Oversold on 1H, bearish cross on 4H. |
| ADX | 21.47 | Neutral | Weak trend strength on 1H; moderate on 4H (24.86). |
| Bollinger Bands | Middle Band | Bearish | Price below middle band on 1H and Daily. |
Track markets in real-time
AI-powered analysis, technical indicators and real-time price data.
Join Our Telegram Channel
Breaking market news, AI analysis and trading signals instantly.
Join Channel