AUDUSD Tests $0.70 Amidst Choppy Forex Markets: What's Next?
AUDUSD hovers around $0.70 as mixed signals emerge. With a weak trend and key levels in focus, traders await clearer direction. Explore the technicals.
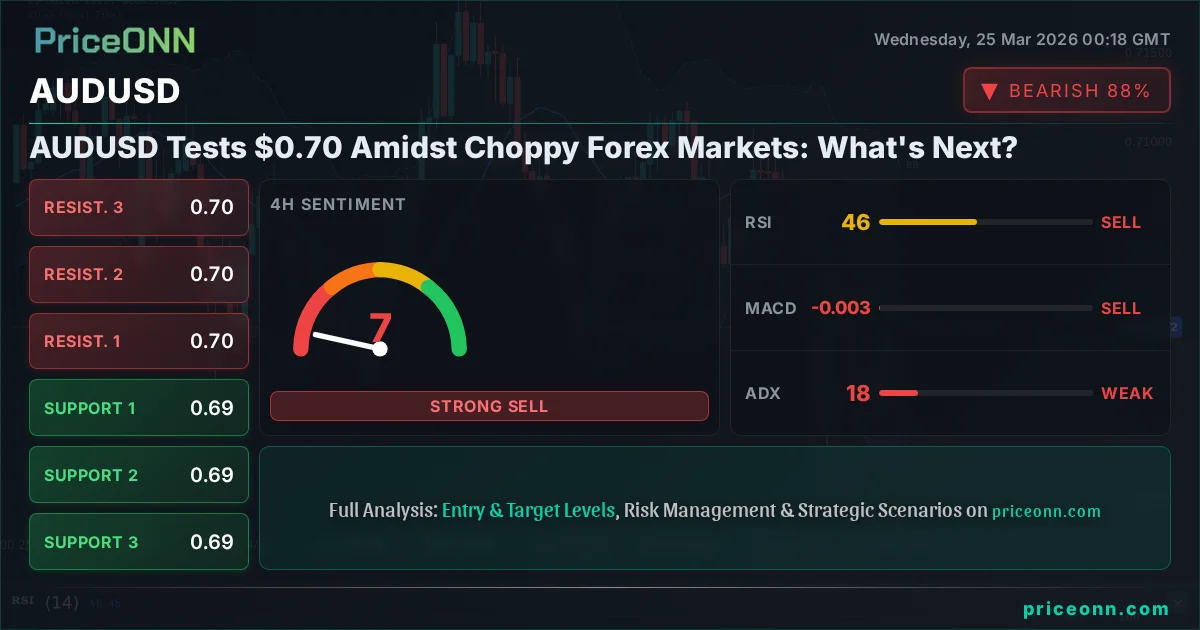
The Australian Dollar is currently dancing around the significant psychological level of $0.70 against the US Dollar, a price point that’s drawing considerable attention from traders and analysts alike. As of the latest data, AUDUSD is trading at precisely $0.69999, a figure that encapsulates the current indecision and consolidation within the pair. This isn't a moment of dramatic volatility; rather, it's a period of careful observation, where the market seems to be holding its breath, waiting for a catalyst to break the current stalemate. The 1-hour chart shows a bullish trend with a strength of 77%, suggesting short-term buying interest, but this is immediately contrasted by the 4-hour and daily timeframes, which paint a more neutral to bearish picture with ADX readings indicating weak or consolidating trends. This divergence is the core tension right now: is the recent uptick a precursor to a more sustained move, or is it merely a temporary pause before further downside?
- AUDUSD is currently trading at $0.69999, near a critical psychological level.
- The 1-hour trend is bullish (77% strength), but 4H and 1D timeframes show neutral to weak trends (ADX 18.28 on 1D).
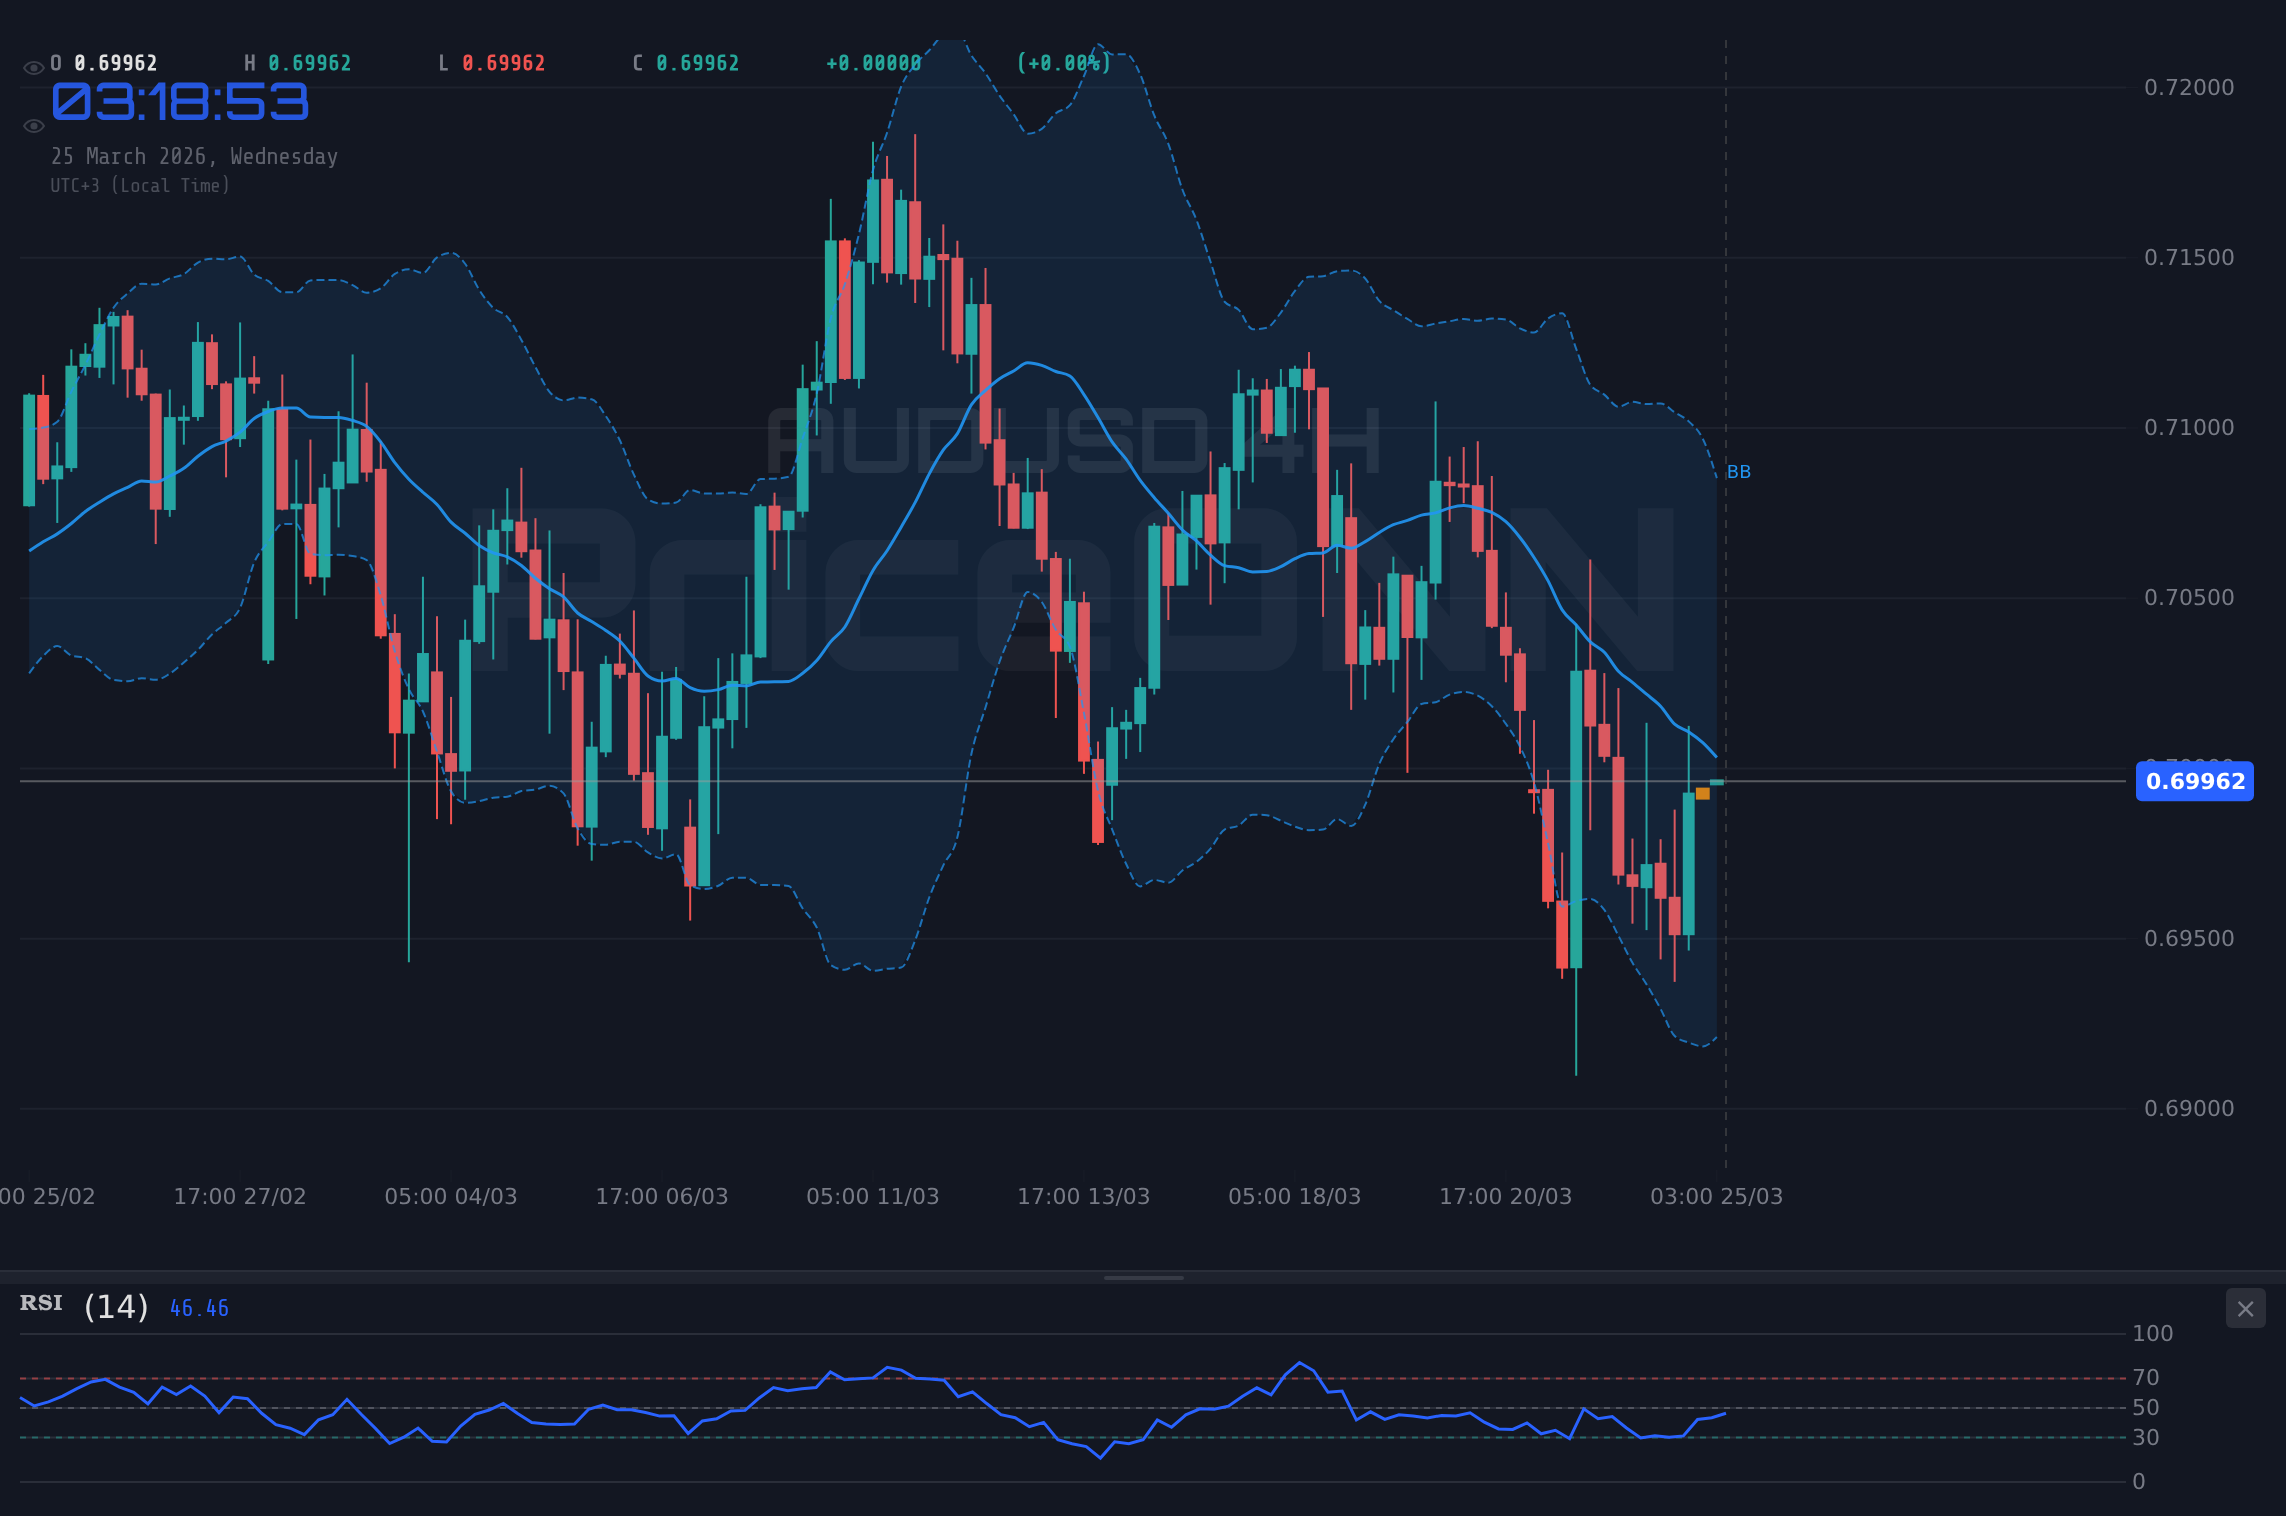
- RSI(14) on the daily chart sits at 46.1, indicating bearish momentum, while Stochastic shows a potential buy signal.
- Key support is at $0.6993, with resistance eyed around $0.7008. A decisive break above resistance is needed for bullish conviction.
- Upcoming US economic data and global risk sentiment will be crucial drivers for AUDUSD's next move.
The technical landscape for AUDUSD is a complex tapestry woven with conflicting signals across different timeframes. On the immediate 1-hour chart, the picture appears somewhat constructive. The trend is identified as bullish with a strength of 77%, and a 'BUY' signal dominates the aggregate of shorter-term indicators. Here, the RSI(14) stands at 66.53, firmly in the neutral zone but leaning towards bullish momentum, while the MACD shows positive momentum with its histogram above the signal line. The Stochastic oscillator, with K at 95.31 and D at 66.75, is in overbought territory, suggesting buyers are dominant, if perhaps a bit aggressive. The ADX at 14.82, however, is a notable caveat, signaling a weak trend despite the bullish indicators. This suggests that while there's short-term buying pressure, it lacks the conviction to drive a strong, sustained move.
As we zoom out to the 4-hour timeframe, the narrative shifts significantly. The trend strength halves to 50%, indicating a neutral market posture. The RSI(14) drops to 48.66, now showing a bearish eğilim, a stark contrast to the 1-hour reading. The MACD remains positive, but the Stochastic, with K at 79.41 and D at 61.5, still leans bullish but is entering overbought territory from below. The most significant divergence appears in the ADX, which jumps to 53.35, indicating a very strong trend, but in the context of the neutral overall trend, this likely reflects the strong intraday moves rather than a commitment to a new direction. The aggregate signal here is neutral, reflecting the market's uncertainty. This timeframe suggests that the immediate bullish impulse might be facing headwinds.
The daily chart offers the broadest perspective, and here, the picture darkens further for the bulls. The trend strength is again at 50%, signaling neutrality, but the RSI(14) at 34.86 clearly indicates bearish momentum, well into the oversold or near-oversold territory. This is a crucial point: while the RSI is low, it doesn't necessarily mean 'buy now.' It signifies that selling pressure has been dominant recently. The MACD is in negative territory, with its histogram below the signal line, reinforcing the bearish sentiment on this longer timeframe. The Stochastic, however, presents a potential buy signal with K at 23.45 and D at 13.77, indicating it's in oversold territory and potentially poised for a bounce. The ADX at 25.69 suggests a strong trend, but given the bearish RSI and MACD, it points to a strong downtrend that might be losing steam or consolidating. The overall signal for the daily chart is 'SELL', highlighting the dominant bearish bias over the longer term.
Navigating the $0.70 Threshold: Key Levels and Market Sentiment
The immediate price action revolves around the $0.70 mark. On the 1-hour chart, the first line of resistance is identified at $0.7008, followed by $0.7032 and $0.7080. For the bulls to gain any meaningful traction, a sustained break and hold above these levels would be necessary. Conversely, the immediate support on the 1-hour chart is found at $0.69855, $0.6973, and $0.6950. A breakdown below these levels would likely accelerate selling pressure, especially given the bearish undertones on the longer timeframes. The 4-hour support levels are at $0.69804, $0.6950, and $0.69298, while resistance is seen at $0.70094, $0.7031, and $0.7070. The daily support sits at $0.69218, $0.68399, and $0.67701, with resistance levels at $0.70735, $0.71433, and $0.72252. The current price of $0.69999 is precariously balanced between the near-term bullish signals and the longer-term bearish outlook, making these levels critical for defining the next directional move.
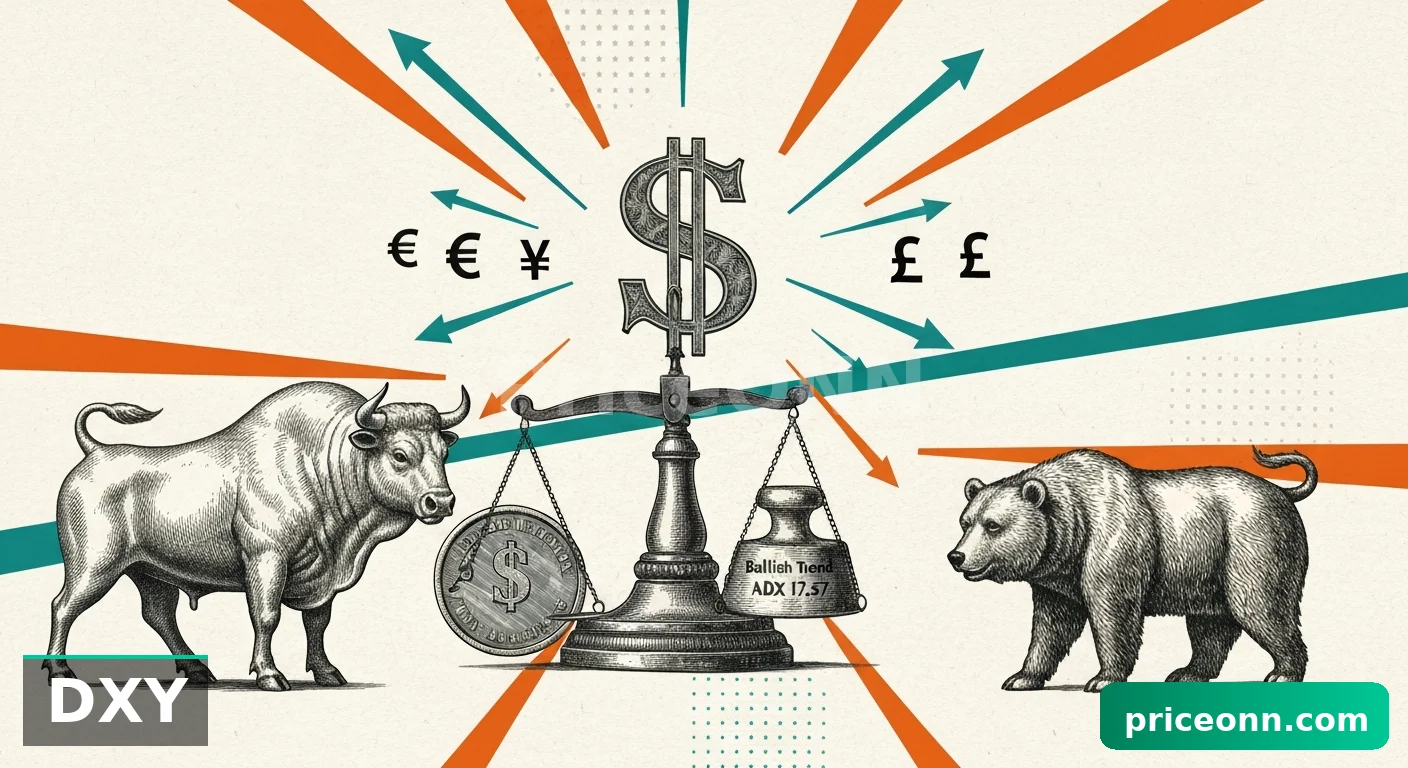
The broader market context, particularly the movement of the US Dollar Index (DXY) and global risk appetite, plays a pivotal role in shaping the AUDUSD's trajectory. The DXY is currently showing strength, trading around 98.92 and exhibiting a strong 1D uptrend. This dollar strength typically acts as a headwind for risk-sensitive currencies like the Australian Dollar. When the dollar strengthens, it often implies a 'risk-off' sentiment in the market, where investors flock to the perceived safety of the US currency. This dynamic is further amplified by the performance of major stock indices like the SP500, which, despite a recent 1H bullish trend, shows a strong 1D downtrend. The conflict between short-term equity gains and the longer-term bearish trend in the SP500 mirrors the indecision seen in AUDUSD. If the DXY continues its upward march and risk aversion intensifies, AUDUSD could face significant downward pressure, potentially testing its daily support levels.
Adding to the complexity are the recent economic data releases and upcoming events. Australia's CPI data, anticipated to hold steady at 3.8% year-over-year, offers a glimpse into inflationary pressures Down Under. While stability might seem reassuring, any deviation from this forecast could trigger sharp moves in AUDUSD. Globally, market participants are closely watching US economic indicators. The US ISM Manufacturing PMI, for instance, showed a reading of 52.4, slightly above the forecast of 51.5, suggesting some resilience in the US manufacturing sector. However, the ISM Services PMI came in at 51.1, below the forecast of 52, indicating a potential slowdown in the services sector. These mixed signals from the US economy contribute to the overall uncertainty, making it difficult for AUDUSD to establish a clear directional bias. The market is in a delicate balance, weighing the strength of the US economy against the performance of other major economies and geopolitical developments.
The interplay between commodity prices, particularly oil, and currency pairs like AUDUSD cannot be overlooked. Brent crude is experiencing significant price action, currently trading around $99.65. While the 1H and 4H charts suggest a bearish trend, the 1D timeframe shows a strong 100% bullish trend. This contradiction highlights the volatility in energy markets, often driven by geopolitical tensions. The recent news of escalating Middle East tensions and the surge in oil prices past $100 per barrel, as reported by various sources, underscores the potential for supply disruptions. Higher oil prices can sometimes correlate with increased inflation expectations, which could indirectly influence central bank policies and, consequently, currency valuations. For AUDUSD, a sustained spike in oil prices, if coupled with broader risk aversion, might not necessarily benefit the Australian Dollar due to its correlation with global growth sentiment and the strength of the US Dollar.
The current technical setup for AUDUSD, characterized by conflicting signals across timeframes and a weak trend indicated by the ADX, places it in a 'Watch Zone'. This is not a period for aggressive trading but rather for careful observation and waiting for confirmation. The ADX value on the daily chart is 21.67, suggesting a moderate trend, but the conflicting RSI and MACD readings on different charts mean that a clear directional signal is absent. For a bullish setup to materialize, we would need to see AUDUSD decisively break and hold above the immediate resistance levels, particularly the 1-hour resistance at $0.7008 and the daily resistance at $0.70735. This would need to be accompanied by a shift in momentum indicators, such as the RSI moving clearly above 50 on the daily chart and the MACD histogram turning positive across multiple timeframes. Until then, the risk of ranging or even downward movement remains significant.
Conversely, a bearish scenario would be confirmed if AUDUSD fails to hold the current support levels and breaks decisively below the 1-hour support at $0.69855. A daily close below the 4-hour support at $0.69804 would further solidify this bearish outlook. Such a move would likely be catalyzed by continued dollar strength, a deterioration in global risk sentiment, or weaker-than-expected Australian economic data. In this scenario, the pair could retest the daily support levels, potentially targeting $0.69218 and even lower. The weak trend signals on the shorter timeframes suggest that any downside move could be gradual rather than a sharp crash, unless a major risk event triggers a flight to safety.
Given the current indecision, a neutral or consolidation scenario is also highly probable. This would involve AUDUSD continuing to trade within a defined range, likely between the key support at $0.69855 and resistance at $0.7008 on the 1-hour chart, or a wider range defined by the daily support and resistance. This type of environment often occurs when markets are digesting mixed economic data, awaiting major central bank policy shifts, or reacting to geopolitical uncertainty without a clear resolution. In such a range-bound market, traders might look for opportunities to fade extremes – buying near support and selling near resistance, albeit with tight stop-losses due to the underlying trend weakness.
The keyword intelligence highlights 'aud usd 0.7200 target' as a rising star query. While currently distant, this level represents a significant upside potential if broader market conditions shift favorably. It suggests that some market participants are looking for a strong bullish reversal. Similarly, 'audusd fundamentals' is an area of interest, indicating a need for deeper dives into the economic drivers. The current price action, however, does not support such an optimistic target in the immediate term. The fundamentals, as reflected in the mixed US economic data and the strong DXY, lean against a rapid ascent to $0.7200 without significant shifts in global risk sentiment or Australian economic performance.
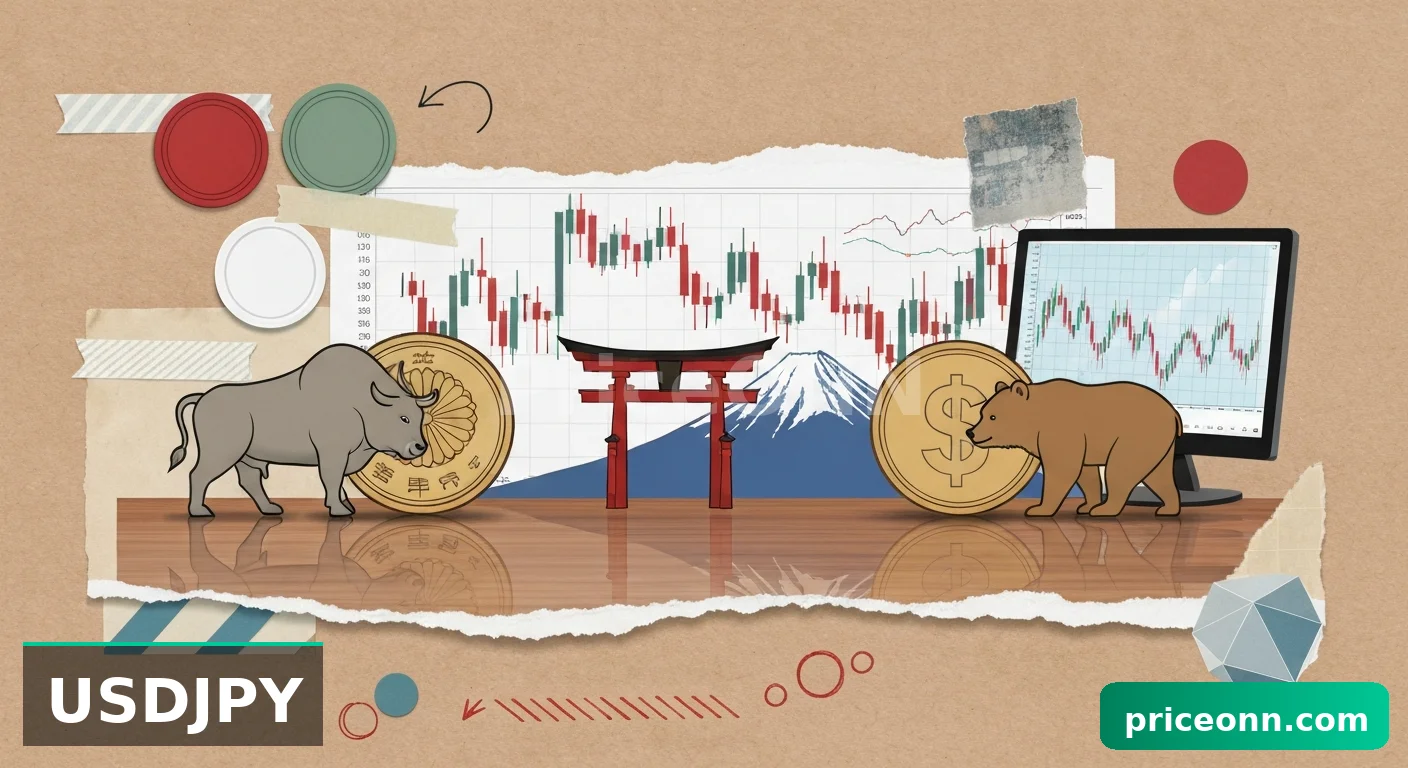
Looking at the broader forex landscape provides further context. The USDJPY pair is trading at 158.765, showing a rising trend on the daily chart, further underscoring the strength of the US Dollar. Similarly, GBPUSD is at 1.3425, and EURUSD is at 1.16218, both showing short-term strength but facing longer-term headwinds from the stronger dollar. This overall forex environment suggests that the US Dollar remains the preferred currency, making it challenging for AUDUSD to mount a sustained rally without significant positive catalysts specific to the Australian economy or a broad weakening of the USD.
The energy markets add another layer of complexity. With WTI crude oil trading around $87.95 and Brent around $99.65, there's a clear bearish sentiment on the 1-hour and 4-hour charts, despite a strong bullish trend on the daily chart for both. This suggests significant intraday volatility and potential for sharp reversals. Geopolitical tensions in the Middle East are a primary driver, and any escalation could lead to a sudden surge in oil prices. While higher oil prices can sometimes be seen as a risk-on signal benefiting commodity-linked currencies like the AUD, the current correlation seems more tied to inflation fears and the USD's safe-haven appeal. Therefore, even if oil prices spike, the impact on AUDUSD might be muted or even negative if it coincides with increased risk aversion and dollar strength.
The technical indicators present a mixed bag, making a definitive call difficult. The daily RSI at 46.1 suggests bearish momentum, while the daily Stochastic offers a potential buy signal from oversold levels. The ADX on the daily chart at 21.67 indicates a moderate trend, but its direction is unclear given the conflicting signals from other indicators. The 1-hour chart's bullish trend and 'BUY' signals are attractive for short-term traders, but the longer-term daily chart's 'SELL' signal and bearish momentum cannot be ignored. This confluence of conflicting signals necessitates a cautious approach. A breakout above the immediate daily resistance at $0.70735 would be required to invalidate the bearish outlook and open the door for further upside, potentially targeting the $0.71433 level. Until then, the path of least resistance appears to be sideways or slightly lower.
The current market condition for AUDUSD is best described as a 'Watch Zone'. The ADX reading of 21.67 on the daily chart signifies a trend that is present but not overwhelmingly strong, allowing for potential range-bound trading or sharp reversals. This environment is risky for aggressive entries. A valid setup for a bullish trade would emerge only after a clear and decisive break above the $0.7008 resistance on the 1-hour chart, ideally confirmed by a daily close above $0.70735. Such a move would need to be supported by improving market sentiment and a weakening US Dollar. Conversely, a breakdown below the $0.69855 support on the 1-hour chart, followed by a daily close below $0.69218, would signal a continuation of the bearish trend, presenting a riskier but potentially more rewarding short-selling opportunity.
Bearish Scenario: Dollar Strength Dominates
65% ProbabilityNeutral Scenario: Range-Bound Consolidation
25% ProbabilityBullish Scenario: Risk-On Shift
10% ProbabilityFrequently Asked Questions: AUDUSD Analysis
What happens if AUDUSD breaks below the $0.69855 support level?
A break below $0.69855 on the 1-hour chart would invalidate the short-term bullish bias and likely lead to a test of the daily support at $0.69218. This scenario is more probable if the US Dollar Index (DXY) continues to strengthen towards 99.18.
Should I buy AUDUSD at current levels of $0.69999 given the mixed signals?
Entering a trade at $0.69999 is not recommended due to the conflicting indicators and weak trend signals. A more prudent approach would be to wait for confirmation: either a decisive break above $0.70735 resistance for a bullish entry, or a breakdown below $0.69218 support for a bearish entry.
Is the daily RSI at 46.1 a sell signal for AUDUSD?
An RSI reading of 46.1 indicates bearish momentum on the daily chart, suggesting that selling pressure has been dominant. However, it's not a direct sell signal on its own. It needs to be confirmed by other indicators and price action, such as a break below key support levels, to be considered a strong sell signal.
How will upcoming US economic data affect AUDUSD this week?
Mixed US data, like the ISM Manufacturing PMI exceeding forecasts while the Services PMI fell short, creates uncertainty. Stronger-than-expected US data would likely boost the DXY and pressure AUDUSD downwards, potentially towards $0.69218. Conversely, weaker data could weaken the dollar and offer support to AUDUSD.
| Indicator | Value | Signal | Interpretation |
|---|---|---|---|
| RSI (14) | 46.1 | Bearish | Daily momentum is subdued. |
| MACD Histogram | -0.00038 | Bearish | Sellers showing control on daily. |
| Stochastic | K=28.71, D=40.14 | Bearish | Oversold, but %K < %D suggests downside. |
| ADX | 21.67 | Neutral | Moderate trend strength, lacks clear direction. |
| Bollinger Bands | Middle Band | Below | Price is below the daily middle band. |
The path forward for AUDUSD hinges on its ability to decisively break through key resistance levels or succumb to the pressure from a strengthening US Dollar and broader risk aversion. The current indecision, reflected in the mixed technical signals and weak trend indicators, suggests that immediate aggressive trades are ill-advised. Patience is paramount. Traders should watch for a clear confirmation signal – either a sustained move above $0.70080 resistance, supported by positive momentum shifts, or a decisive break below $0.69855 support, signaling a continuation of the bearish undertones seen on the daily chart. Until then, the market remains a 'Watch Zone', where careful observation and disciplined risk management will be key to navigating the choppiness.
Track markets in real-time
AI-powered analysis, technical indicators and real-time price data.
Join Our Telegram Channel
Breaking market news, AI analysis and trading signals instantly.
Join Channel