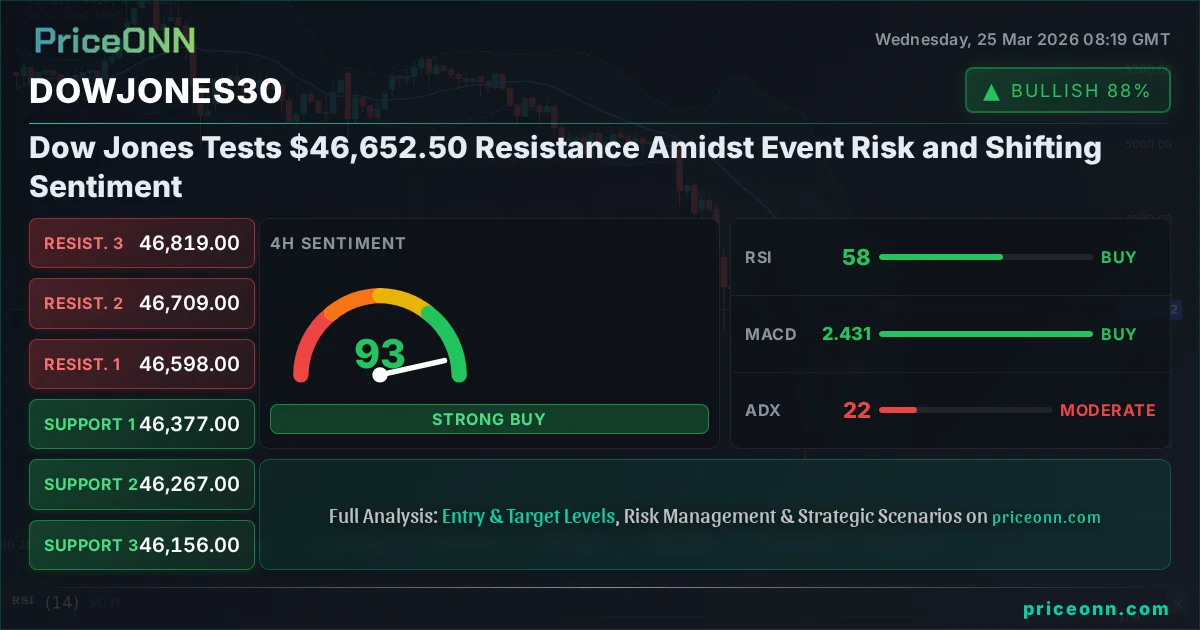
Dow Jones Tests $46,652.50 Resistance Amidst Event Risk and Shifting Sentiment
Dow Jones at $46,652.50 approaches key resistance. Technical indicators show mixed signals, highlighting the critical juncture for the index.
The Dow Jones Industrial Average is currently dancing with a significant resistance level, perched at $46,652.50 as of this morning's session. This isn't just another trading day; it's a moment where the confluence of technical indicators, ongoing geopolitical undercurrents, and the ever-present influence of central bank policy expectations creates a complex tapestry for traders. Having tracked the Dow Jones through its recent price action, it's clear that while bulls have managed to push the index higher, the path forward is fraught with potential headwinds. The question on every trader's mind right now isn't just *if* the index can break higher, but *what conditions* need to be met for such a move to be sustainable, and conversely, what signals a potential reversal.
- The Dow Jones Industrial Average is testing resistance at $46,652.50, with its 4-hour trend showing a potential reversal signal from a strong bullish trend.
- Critical resistance sits at $46,652.50, with key levels above at $46,709 and $46,819; support is identified at $46,377 and $46,267.
- RSI at 64.03 on the 1-hour chart indicates overbought pressure, while the 1D ADX at 41.52 confirms a strong downtrend, suggesting caution.
- The correlation with the DXY at 99.01 and the broader equity market sentiment, including SP500's struggle at 6629.1, are crucial factors influencing the index's next move.
From a technical standpoint, the 4-hour chart presents a fascinating dichotomy. While the 1-hour trend is showing strong bullish momentum with an ADX of 18.22, the longer-term 4-hour and daily charts paint a more cautious picture. The 4-hour trend strength is currently neutral at 50%, but the daily trend is decidedly bearish with a strength of 96%. This divergence across timeframes is precisely what creates trading opportunities, but it also demands a nuanced approach. Traders are looking for confirmation, a clear signal that the current push is more than just a temporary bounce within a larger downtrend. The ADX on the daily chart at 41.52 is particularly noteworthy; it signifies a strong, established downtrend that is difficult to break without significant fundamental catalysts or a clear technical pattern break.
Navigating the Resistance Zone
The current price of $46,652.50 is not just a random number; it represents a confluence of historical price action and potential algorithmic triggers. On the 4-hour chart, this level is nearing the resistance of $46,598, $46,709, and $46,819. Breaking decisively above these levels would require a substantial shift in market sentiment or a clear bullish catalyst. The fact that the Stochastic Oscillator on the 1-hour chart is showing a %K < %D signal, indicating a potential pullback, adds another layer of caution. This isn't a situation where one simply buys the breakout; it requires careful risk management and an understanding of the underlying market forces.
The DXY, or Dollar Index, currently trading at 99.01, plays a crucial role here. A strengthening dollar often acts as a headwind for US equities, as it can signal tighter financial conditions or a flight to safety that pulls capital away from riskier assets like stocks. While the DXY's 1-hour trend is neutral, its daily trend is showing bullish signs, which could put additional pressure on the Dow Jones if it continues to climb. Similarly, the SP500, trading at 6629.1, and the Nasdaq 100 at 24310.25, are also showing mixed signals, with daily trends indicating weakness despite intraday gains. This broader equity market correlation suggests that any move higher in the Dow Jones might face headwinds from its tech-heavy counterparts.
The Indicator Conundrum
Diving deeper into the technical indicators on the 1-hour chart, the RSI at 64.03 hovers in overbought territory, suggesting that the recent upward momentum might be losing steam. While not an immediate sell signal, it warrants attention, especially when juxtaposed with the Stochastic Oscillator's %K < %D crossover. This combination often precedes a short-term retracement. The MACD, however, remains positive on the 1-hour chart, indicating bullish momentum is still present, but the ADX at 18.22 signals a weak trend, meaning the current move might lack conviction and could be prone to reversal.
The 4-hour chart offers a slightly different perspective. The RSI at 57.67 is in neutral territory, suggesting more room for upward movement, and the Stochastic Oscillator is showing a bullish %K > %D signal. The MACD is also positive, and the ADX at 22.05 indicates a moderate trend. This is where the 'moderate trend' aspect of the ADX becomes crucial; it suggests that while there's some directional conviction, it's not yet a runaway trend, making the resistance levels even more significant. The Daily chart, however, remains the dominant force in terms of trend direction. With an RSI at 39.86 and a powerful ADX of 41.52, the daily picture screams caution. This strong downtrend on the daily timeframe suggests that any intraday gains might be opportunities for sellers to enter the market at better prices.
Fundamental Undercurrents and Event Risk
Beyond the charts, the macroeconomic landscape is a significant driver. Upcoming economic data releases, particularly those related to inflation and employment from the US, will be critical. If inflation proves to be more persistent than expected, it could reignite hawkish sentiment from the Federal Reserve, potentially leading to higher interest rates and increased pressure on equities. Conversely, signs of cooling inflation or a weakening labor market could be interpreted as paving the way for potential rate cuts later in the year, which would typically be bullish for equities. The market is currently pricing in a certain probability for Fed actions, and any deviation from these expectations could trigger significant volatility.
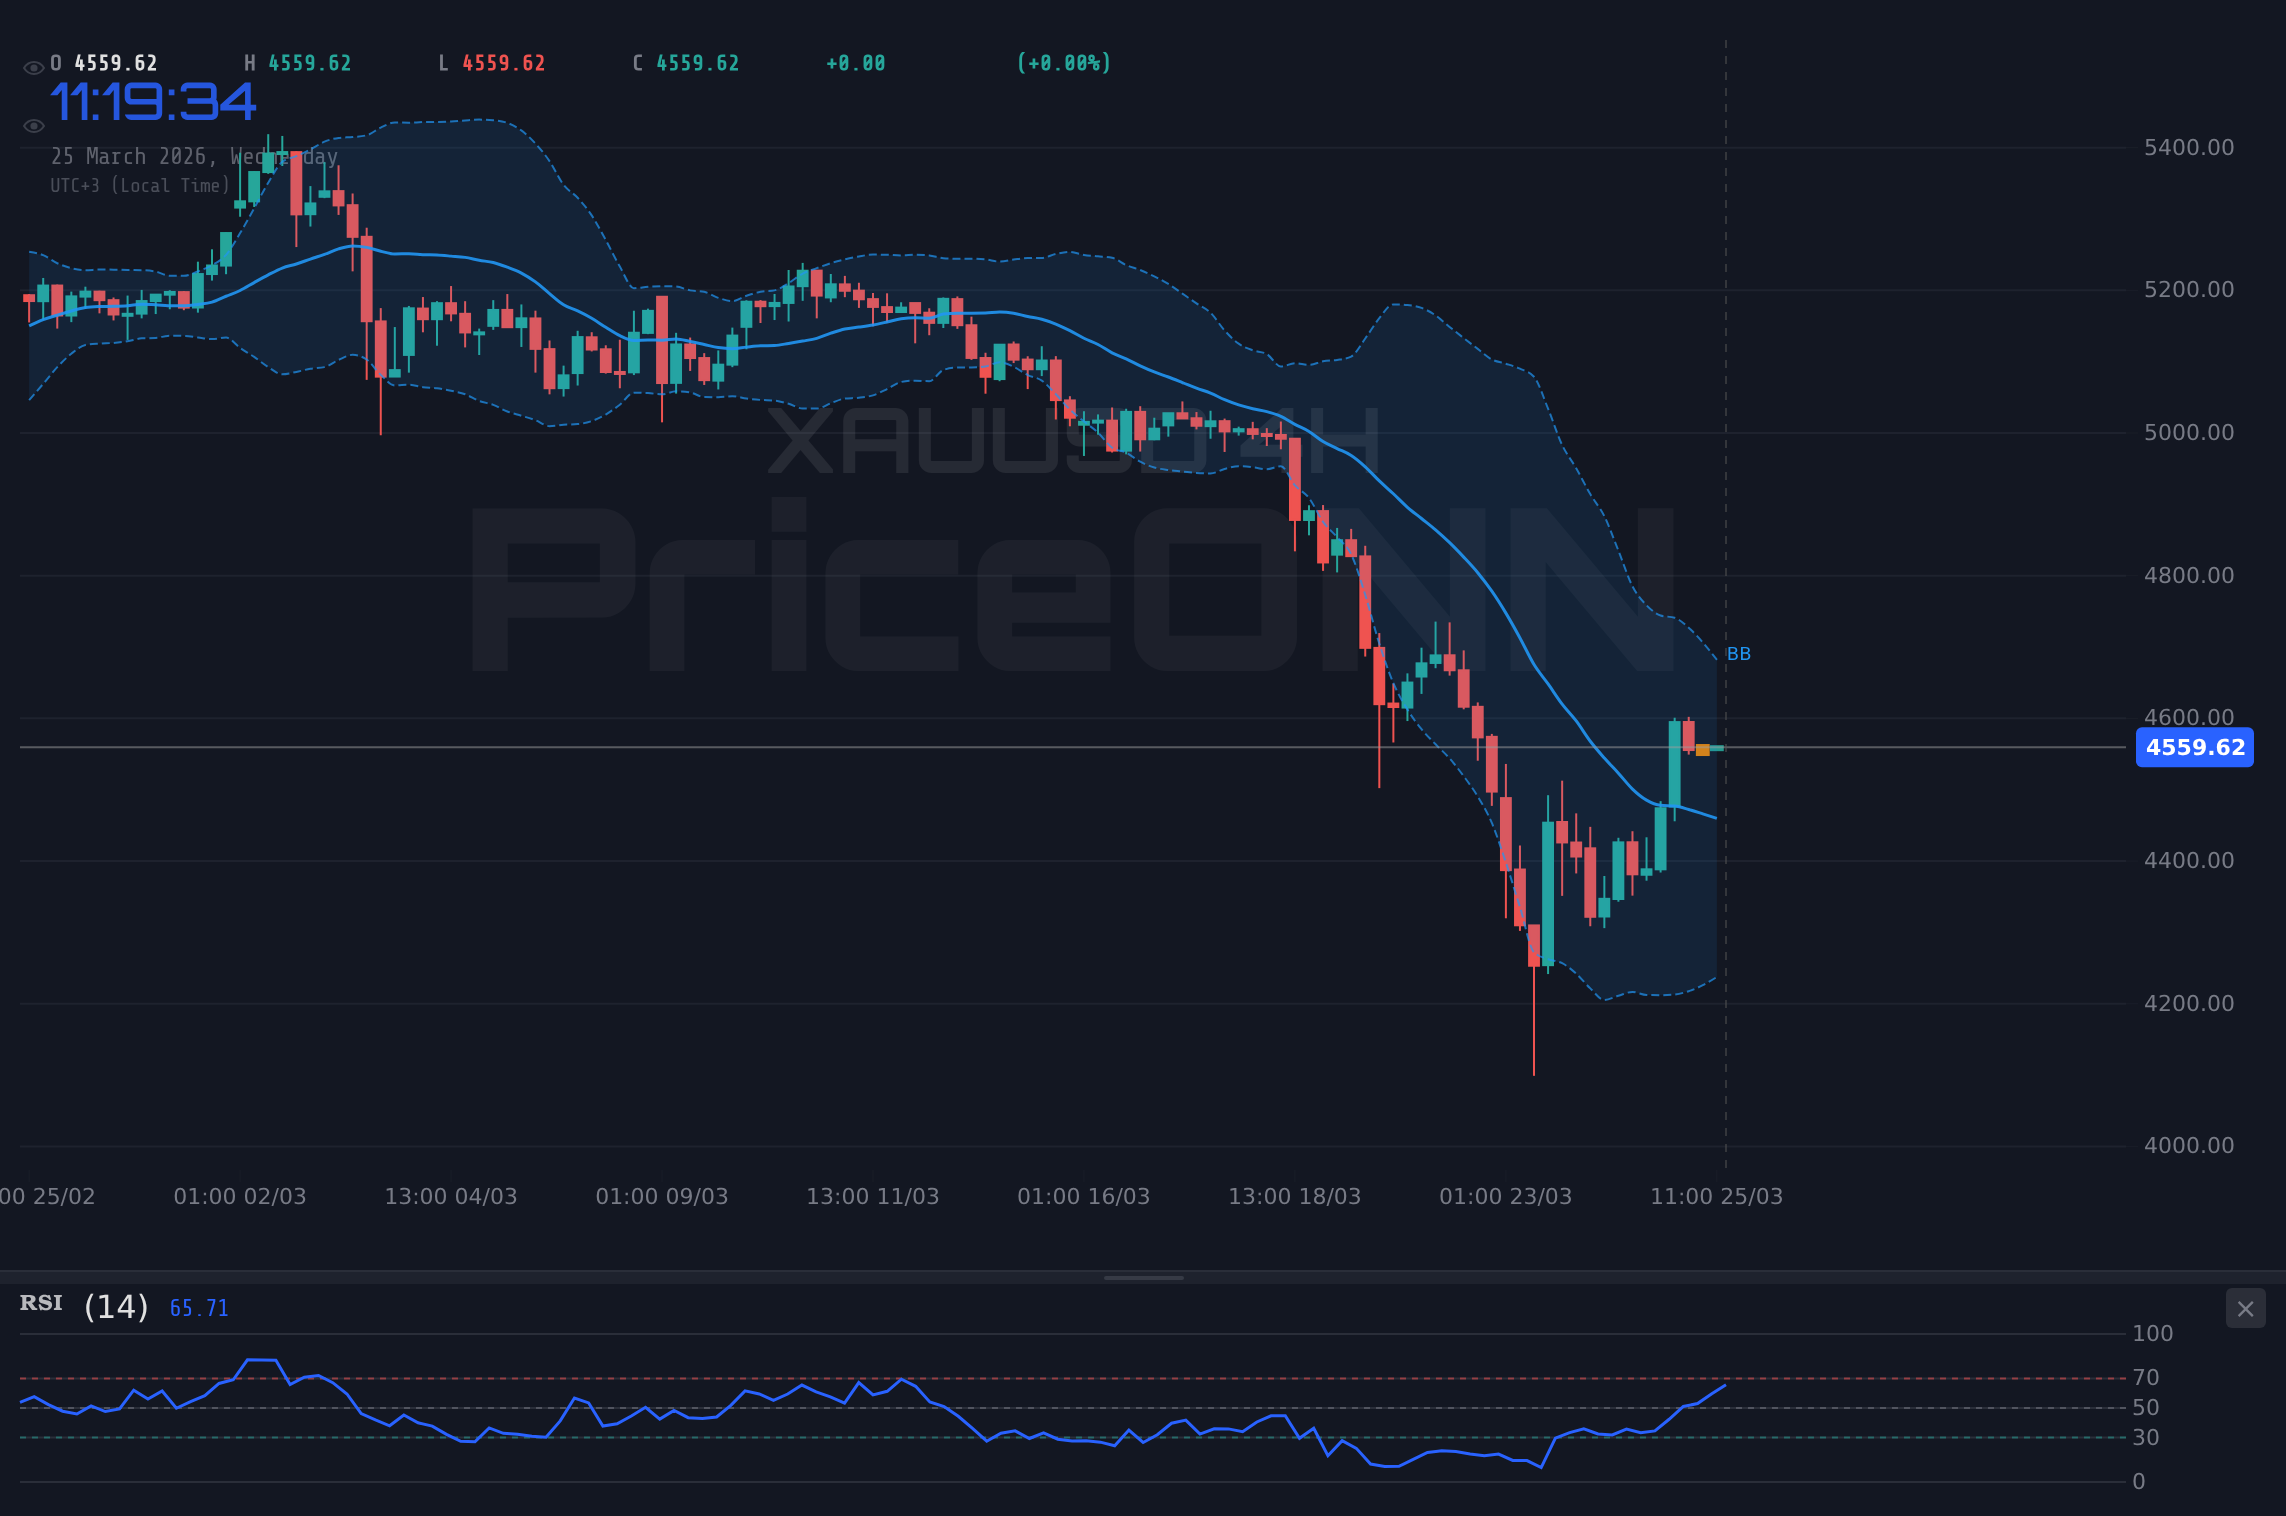
The geopolitical situation also cannot be ignored. The recent surge in oil prices, with WTI at $88.01 and Brent at $98.61, adds an inflationary component that central banks are closely monitoring. While oil prices have seen some correction, the underlying geopolitical tensions in key regions remain a source of potential supply disruptions and upward price pressure. Any escalation of these tensions could lead to a flight to safety, benefiting assets like gold (currently at $4562.76) and potentially weighing on riskier assets like the Dow Jones. The correlation between oil prices, inflation expectations, and central bank policy is a complex feedback loop that investors must navigate carefully.
The news flow also provides context. Reports of falling oil prices dampening Canadian Dollar sentiment, or concerns about Europe's reliance on US LNG, highlight the interconnectedness of global markets and the potential for energy shocks to ripple through various economies and asset classes. While these might not directly impact the Dow Jones minute-by-minute, they contribute to the overall market sentiment and risk appetite, which are crucial for indices like the Dow Jones. The recent sell-off in Asian stocks, for instance, underscores a broader risk-off sentiment that could spill over into US markets.
Trade Scenarios and Risk Management
Given the current technical and fundamental backdrop, it's essential to outline potential scenarios. The primary challenge for the bulls is to overcome the resistance around $46,652.50. A sustained move above $46,819 would be a strong bullish signal, potentially opening the door for further upside. However, the prevailing daily downtrend suggests that failure at resistance is a more probable outcome in the short term. If the index fails to break higher, we could see a move back towards the support levels identified on the 4-hour chart, starting with $46,377 and then potentially $46,267. The key invalidation level for a bearish scenario would be a decisive close above the upper resistance targets, while for a bullish scenario, a close below the key support levels would signal a failure of the upward move.
The ADX reading is particularly telling here. On the daily timeframe, the ADX at 41.52 indicates a strong trend. When such a strong trend is in place, breakouts tend to be more decisive, and reversals are harder to come by. However, the weaker ADX readings on the intraday charts suggest that the current upward push might be more of a counter-trend move or a consolidation phase before the next leg of the larger trend. This means that traders should be patient, waiting for clear confirmation before committing to a direction. Scalpers might look for short-term opportunities within the intraday ranges, while swing traders will likely wait for a clear break of the key support or resistance levels identified.
Managing risk is paramount in such a choppy environment. The fact that multiple timeframes are showing conflicting signals means that stop-loss orders should be placed judiciously. For bullish positions, stops might be placed below the nearest 4-hour support level, such as $46,377. For bearish positions initiated on a rejection of resistance, stops could be placed just above the current resistance, perhaps around $46,819. The probability of a move higher hinges on breaking through these resistance levels convincingly, ideally with increasing volume and positive fundamental news. Conversely, a failure to do so, coupled with negative economic data or geopolitical escalation, could quickly send the index lower.
Bearish Scenario: Resistance Holds Firm
65% ProbabilityNeutral Scenario: Consolidation Around Resistance
25% ProbabilityBullish Scenario: Breakout Confirmation
10% ProbabilityFrequently Asked Questions: DowJones30 Analysis
What happens if the Dow Jones30 fails to break above the $46,652.50 resistance level?
If the Dow Jones30 fails to break above $46,652.50, a retracement is likely, targeting the 4-hour support at $46,377. The daily chart's strong downtrend (ADX 41.52) supports this bearish outlook, suggesting sellers may step in at current levels.
Should I consider buying DowJones30 at current levels of $46,652.50 given the mixed signals?
Buying at current levels ($46,652.50) is risky due to strong daily downtrend signals and resistance nearby. A more prudent approach would be to wait for a clear break above $46,819 with confirmation, or a pullback to tested support levels like $46,377, depending on your risk tolerance and timeframe.
Is the RSI at 64.03 on the 1-hour chart a sell signal for the DowJones30 right now?
An RSI of 64.03 on the 1-hour chart suggests overbought conditions and potential waning bullish momentum, but it's not a definitive sell signal on its own. It warrants caution, especially when coupled with Stochastic's bearish crossover and the stronger daily downtrend.
How will the upcoming economic data releases potentially affect the Dow Jones30's move this week?
Upcoming US inflation and employment data are critical. Better-than-expected inflation or weak jobs data could reinforce hawkish Fed expectations, pressuring the Dow Jones. Conversely, signs of cooling inflation or a softening labor market might lead to a risk-on rally, especially if the DXY at 99.01 falters.
Track markets in real-time
AI-powered analysis, technical indicators and real-time price data.
Join Our Telegram Channel
Breaking market news, AI analysis and trading signals instantly.
Join Channel