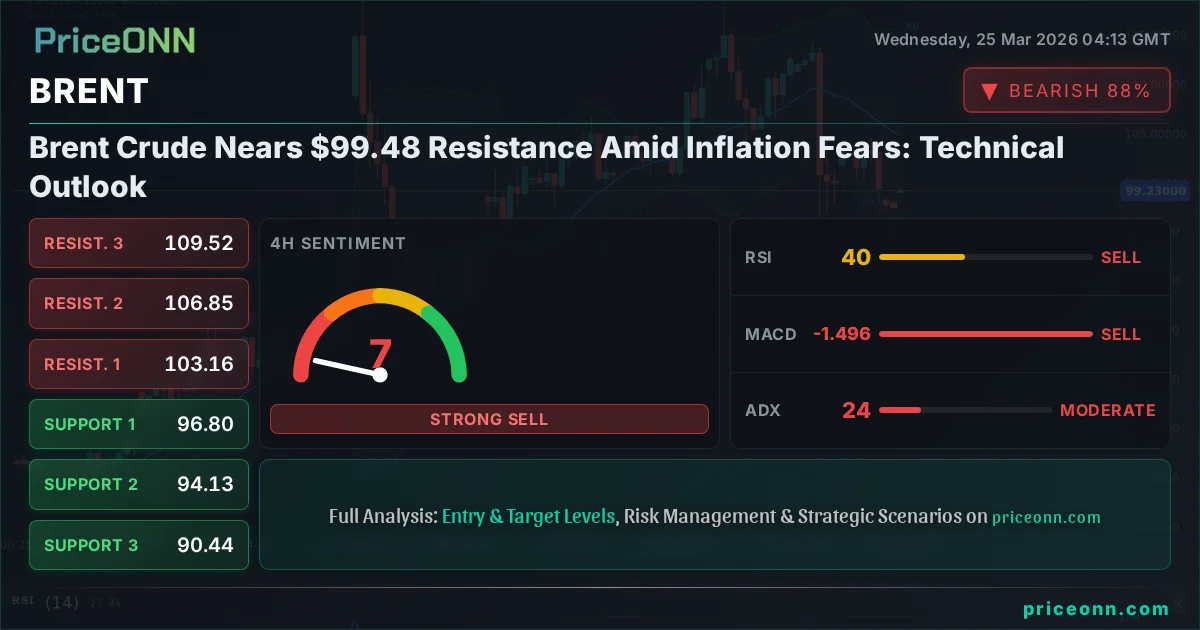
Brent Crude Nears $99.48 Resistance Amid Inflation Fears: Technical Outlook
Brent Crude hovers near $99.48, facing key resistance as inflation concerns mount. Technical indicators show a mixed picture, with a strong downtrend on the daily chart battling short-term bullish signals.
Brent crude oil is currently hovering at the critical $99.48 mark, a price point that demands attention as it approaches significant resistance levels. The market is grappling with a complex interplay of factors, from persistent inflation fears to geopolitical undercurrents, creating a challenging landscape for traders. While the daily chart paints a bearish picture, shorter timeframes offer glimpses of bullish momentum, suggesting a potential battle for control is underway. Understanding the nuances of these conflicting signals is paramount for navigating the choppy waters of the energy market.
- RSI at 39.06 on the 1H chart signals bearish pressure, while the 1D RSI at 60.44 shows potential for upward movement.
- Key resistance sits at $100.24 (R1 on 1H), with a more significant hurdle at $103.43 (R1 on 1D).
- The ADX at 37.91 on the 1H chart indicates a strong downtrend, contradicting the bullish signals from Stochastic.
- Fed rate expectations and Middle East tensions are driving Brent's correlation with the DXY, currently at 99.09.
The energy market is at a pivotal juncture. Brent crude, trading at $99.48, finds itself consolidating near a level that has historically acted as a springboard for both significant rallies and sharp pullbacks. The underlying narrative is dominated by inflation concerns. As central banks worldwide continue to wrestle with elevated price pressures, the demand for commodities like oil remains a key focus. Higher inflation often translates to increased hedging demand for tangible assets, potentially providing a floor under oil prices. However, the flip side is the risk of aggressive monetary tightening, which could stifle economic growth and, consequently, oil demand.
Diving into the technicals, the 1-hour chart presents a somewhat conflicting view. The Relative Strength Index (RSI) at 39.06 suggests bearish momentum is in play, indicating that sellers might be gaining an upper hand in the short term. This is further supported by the MACD histogram, which is currently negative, and the Stochastic oscillator showing a bearish crossover with %K at 26.18 and %D at 40.77, firmly in oversold territory but signaling a potential downturn. The ADX reading of 37.91 on this timeframe reinforces the idea of a strong prevailing trend, leaning towards the downside. Yet, the Bollinger Bands are positioned below the middle band, indicating price action is favoring the lower half of the range, but not necessarily a full breakdown yet.
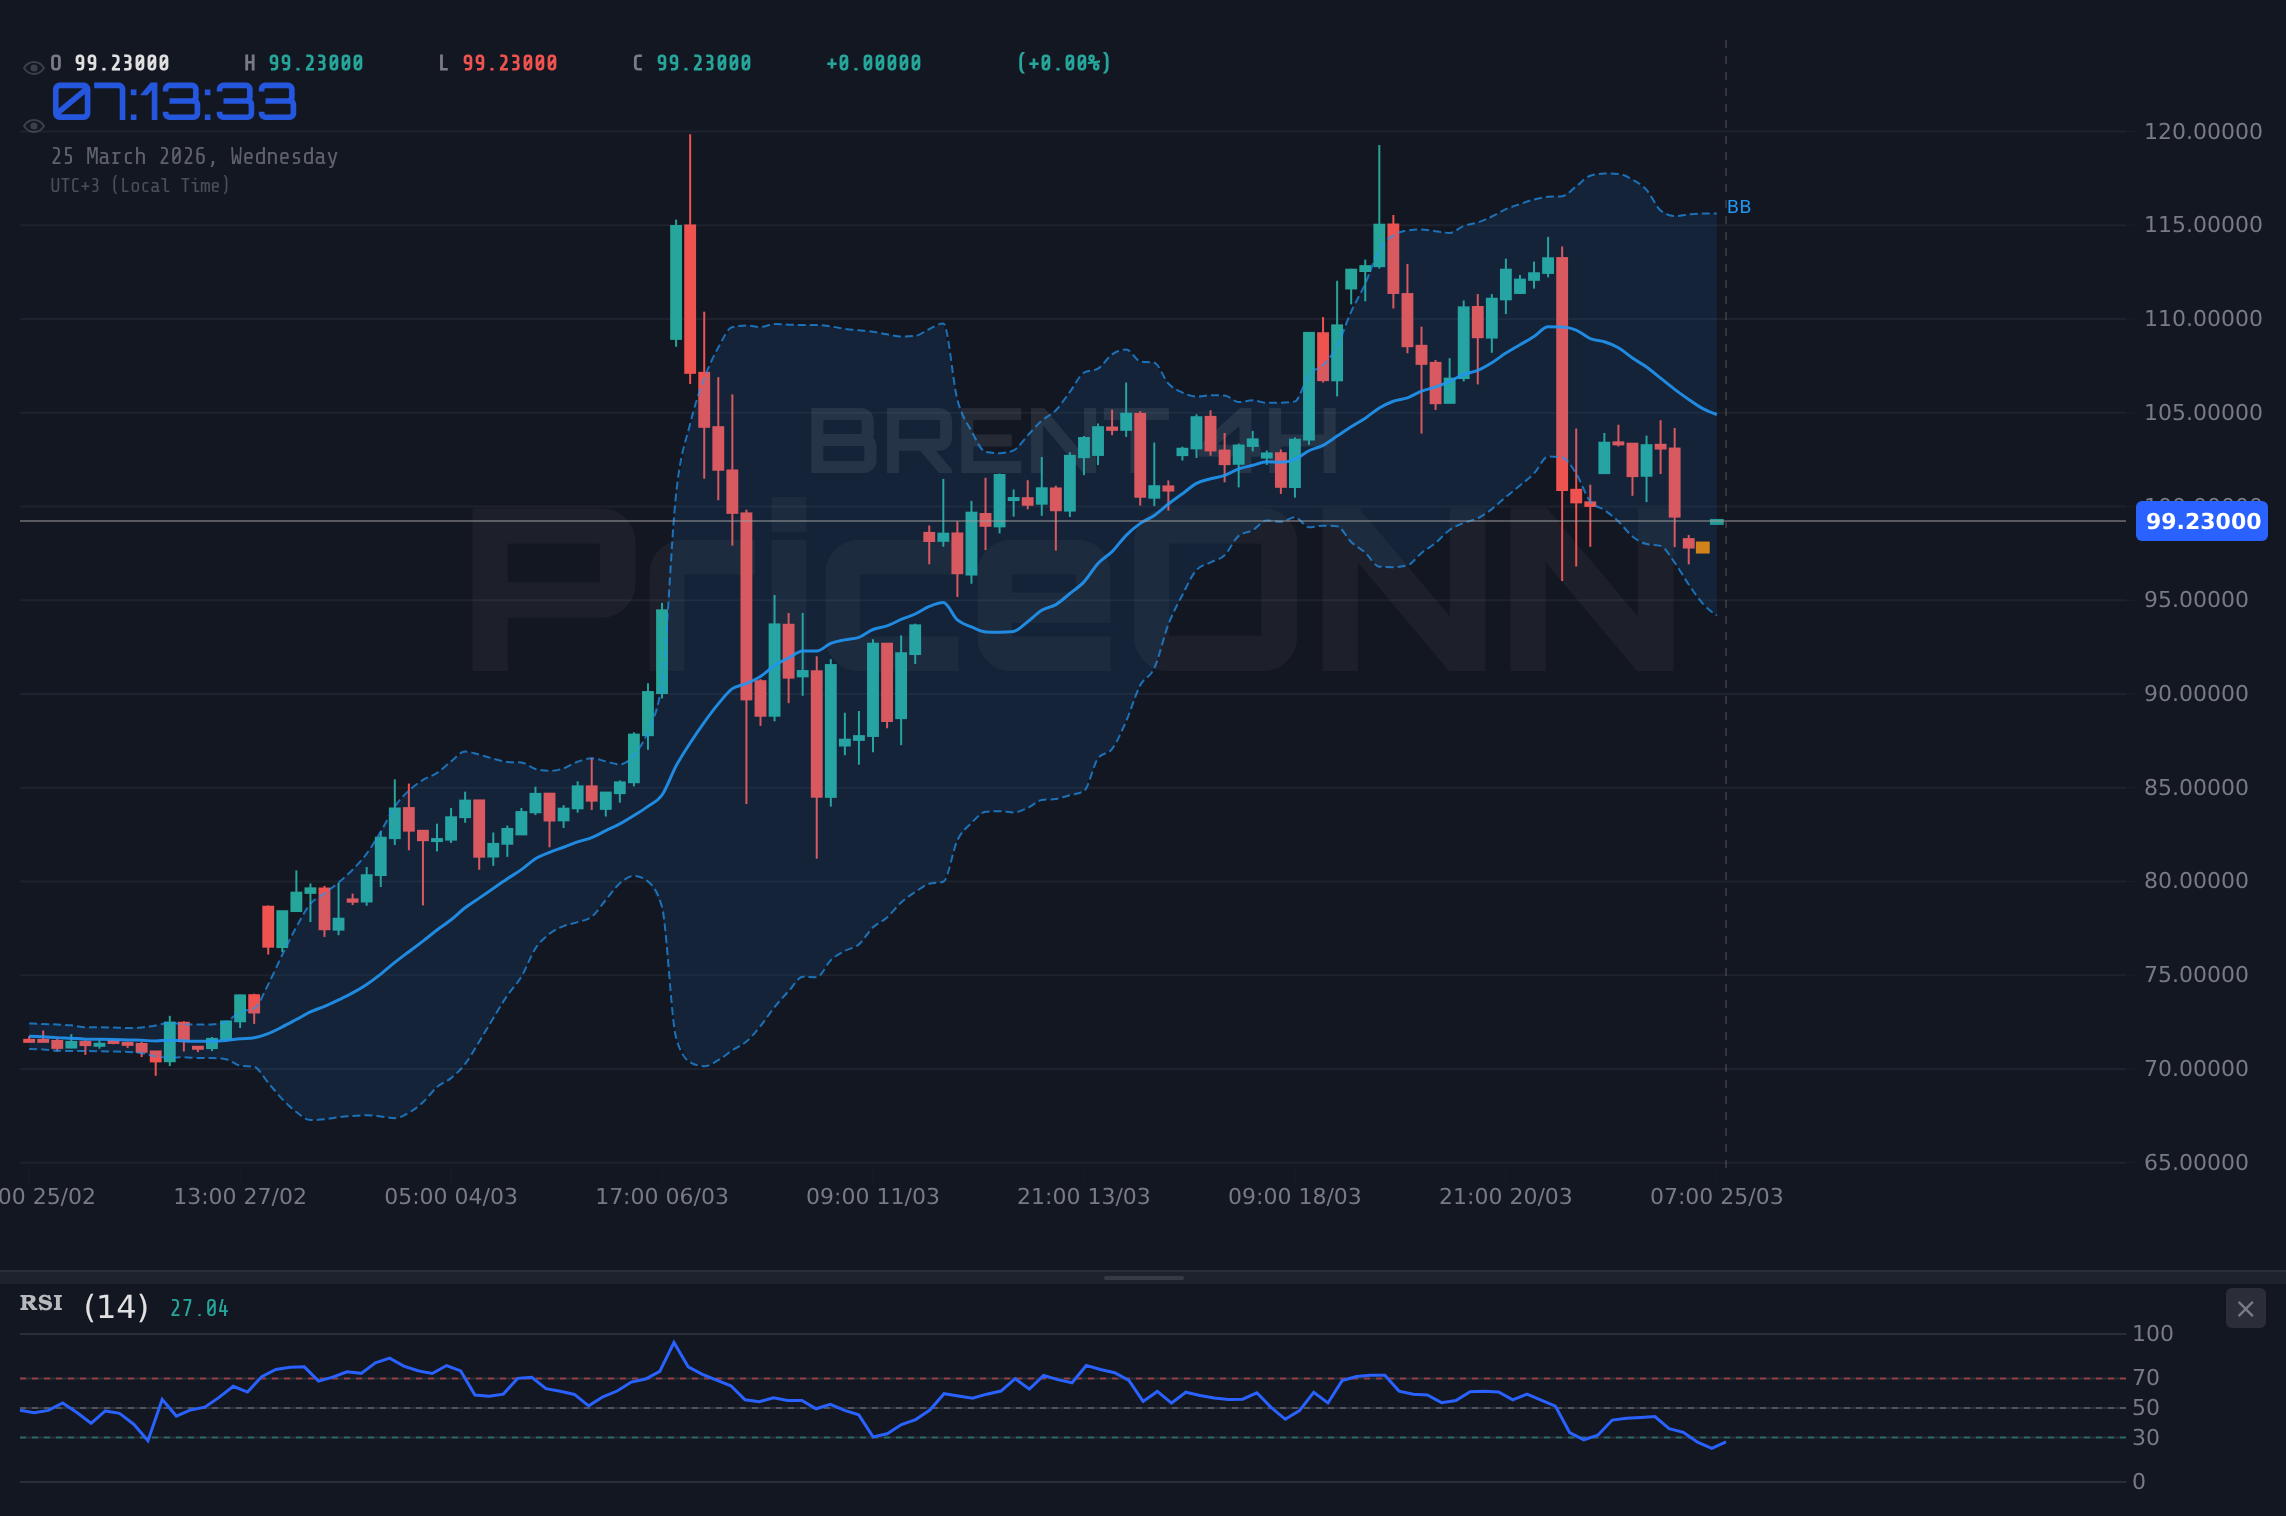
However, shifting focus to the 4-hour timeframe reveals a slightly different story. While the ADX remains strong at 24.43, indicating a moderate trend, the RSI is at 39.82, still suggesting bearish pressure but less intense than on the hourly. More importantly, the Stochastic indicator shows %K at 30.69 and %D at 34.44, which, while still in oversold territory, suggests a potential for a rebound as %K is approaching %D from below. The MACD histogram remains negative, but the proximity to the signal line warrants attention. The Bollinger Bands are also below the middle band, hinting at bearish sentiment, but the overall picture across these shorter to medium-term frames suggests that while the bears have some footing, the conviction might be wavering.
The daily timeframe, however, presents the most compelling technical picture for Brent crude. Here, the trend is decidedly bullish, with an impressive 100% strength rating. The RSI stands at 60.44, comfortably in neutral territory and exhibiting an upward trajectory, suggesting room for further gains. The MACD, although the histogram is negative, shows momentum building, with the MACD line above the signal line. Crucially, the price is trading above the middle Bollinger Band, which is also trending upwards, indicating a solid bullish bias. The Stochastic oscillator, with %K at 24.8 and %D at 56.46, shows a strong upward signal as %K is significantly below %D and rising rapidly from oversold conditions. This divergence between the daily bullish trend and the shorter-term bearish signals on the hourly chart is where the real trading opportunity lies.
The current price of $99.48 for Brent crude is situated just below the first resistance level on the 1-hour chart at $100.24. A decisive breach of this level, especially with increasing volume, could signal a short-term bullish continuation. However, the more significant resistance lies on the daily chart. The first daily resistance (R1) is at $103.43, followed by $107.40 (R2) and $110.20 (R3). These levels represent formidable barriers that will require substantial fundamental catalysts to overcome. On the downside, the immediate support on the 1-hour chart is at $98.11, followed by $96.73 and $95.98. The daily support levels are much lower, starting at $96.66, then $93.86, and finally $89.89. The wide gap between the current price and the daily support levels suggests that while a short-term dip is possible, the overall trend structure on the daily chart provides a strong bullish bias.
The correlation with the US Dollar Index (DXY) cannot be overstated. With the DXY currently trading at 99.09 and showing mixed signals across timeframes, its influence on Brent is complex. Generally, a strengthening dollar puts downward pressure on dollar-denominated commodities like oil, as they become more expensive for holders of other currencies. Conversely, a weakening dollar can boost oil prices. The DXY's daily chart shows a bullish trend with RSI at 55.17, suggesting potential for dollar strength. This could act as a headwind for Brent, especially if it pushes above key resistance levels. The interplay between the Fed's monetary policy stance – which, according to recent news, suggests rates may remain unchanged due to sticky inflation – and geopolitical tensions is crucial here. Hawkish Fed expectations could strengthen the dollar, while escalating Middle East tensions, as highlighted by recent news, tend to support oil prices, creating a tug-of-war.
Recent market developments add another layer of complexity. News reports indicate a significant oil price plunge of over 5% in early Asian trade for both WTI and Brent, driven by emerging geopolitical easing or perhaps a shift in market sentiment. This contradicts the bullish signals on the daily chart and the current price action. If this plunge is indicative of a broader sentiment shift, then the bullish outlook on the daily chart might be invalidated sooner rather than later. Furthermore, Europe's energy security concerns, highlighted by its reliance on US LNG, could influence global demand dynamics, though this is a longer-term structural factor rather than an immediate price driver for Brent at $99.48.
The economic calendar also presents potential catalysts. While specific high-impact events for USD and EUR on the date of the data fetch are not detailed with actual outcomes, the mention of Australia's February CPI forecast to hold at 3.8% year-over-year is a data point to watch for its potential impact on the AUD and, by extension, broader commodity sentiment. The persistent inflation above target mentioned in relation to the Fed is a key driver. If upcoming inflation data continues to surprise to the upside, it could force the Fed into a more hawkish stance, potentially strengthening the USD and pressuring Brent. Conversely, any sign of cooling inflation could embolden a more dovish Fed, supporting risk assets and potentially oil.
Considering the technical divergences and the fundamental backdrop, a multi-faceted approach is warranted. The strong bullish trend on the daily chart at $99.48 offers a compelling risk/reward for long positions, provided key supports hold. However, the immediate bearish signals on the hourly chart and the recent news of a price plunge cannot be ignored. Traders must remain vigilant, adhering strictly to risk management principles. The $100.24 level on the 1H chart and the $103.43 level on the daily chart are the immediate hurdles that bulls must clear to confirm a sustained upward move. Failure to do so, especially on a break below the $96.66 daily support, could signal a deeper correction.
The 'brent prognose' keyword analysis from SEO intelligence suggests a rising interest in future price predictions. With the current technical setup showing conflicting signals across timeframes, any 'brent prognose' must be heavily qualified. The strong daily uptrend versus the hourly bearish indicators creates a scenario where a breakout is highly anticipated, but the direction is uncertain. The ADX at 37.91 on the 1H chart indicates a strong trend, but its direction is debatable given the conflicting signals. A true breakout above $100.24, confirmed by increasing volume and positive momentum across multiple timeframes, would be a strong bullish signal. Conversely, a decisive break below $96.66 could invalidate the daily bullish thesis and open up further downside.
The interplay of technicals and fundamentals paints a picture of cautious optimism for Brent crude, but with significant short-term risks. The daily chart's bullish bias, supported by an RSI at 60.44 and price above the middle Bollinger Band, suggests underlying strength. However, the immediate hourly indicators flashing bearish signals, coupled with recent negative news and the psychological barrier around $100.00, indicate potential for a near-term pullback. Traders looking to enter long positions should ideally wait for confirmation of a break above $100.24, with stops placed below the $96.66 daily support. Alternatively, a break below $96.66 could signal a shorting opportunity towards the next support at $93.86.
The current price action around $99.48 is crucial. It represents a test of the market's resolve. Will the bullish sentiment from the daily chart prevail, pushing Brent towards the $103.43 resistance, or will the short-term bearish signals and potential macro headwinds drag it lower towards the $96.66 support? The answer likely lies in the evolving inflation data and geopolitical landscape. A clear break above $100.24, sustained by positive economic data or escalating geopolitical risks, could ignite a rally. Conversely, a failure to hold $96.66, exacerbated by hawkish central bank rhetoric, could see prices drift lower. The market is at an inflection point, and careful observation of price action around these key levels will be critical.
The volatility analysis suggests that while a trend is present on the daily chart (ADX 63.2), the shorter timeframes exhibit weaker trend strength (ADX 37.91 on 1H). This indicates potential for choppy price action in the near term. A true breakout confirmation will require not just a price breach but also increasing volume and momentum across multiple timeframes. The market sentiment appears cautiously optimistic on the daily, but wary on the hourly. For those looking to trade Brent, patience will be key. Waiting for a clear signal - either a confirmed breakout above $100.24 or a decisive break below $96.66 - will offer a much better risk/reward setup than trying to guess the turning point here.
| Indicator | Value | Signal | Interpretation |
|---|---|---|---|
| RSI (1H) | 39.06 | Bearish | Momentum weakening |
| MACD (1H) | - | Bearish | Negative momentum |
| Stochastic (1H) | K: 26.18, D: 40.77 | Bearish Crossover | Oversold, potential rebound |
| ADX (1H) | 37.91 | Strong Trend | Downward pressure |
| RSI (4H) | 39.82 | Bearish | Further room to fall |
| MACD (4H) | - | Bearish | Negative momentum |
| Stochastic (4H) | K: 30.69, D: 40.44 | Oversold | Potential for bounce |
| ADX (4H) | 24.43 | Moderate Trend | Trend strength present |
| RSI (1D) | 60.44 | Bullish | Room to run higher |
| MACD (1D) | - | Bullish | Positive momentum building |
| Stochastic (1D) | K: 24.8, D: 56.46 | Bullish Crossover | Strong upward signal |
| ADX (1D) | 63.2 | Very Strong Trend | Uptrend confirmed |
Bearish Scenario: Breakdown Below Support
60% ProbabilityNeutral Scenario: Consolidation Around $99.48
30% ProbabilityBullish Scenario: Resistance Breakout
10% ProbabilityFrequently Asked Questions: BRENT Analysis
What happens if BRENT breaks above the $100.24 resistance level?
A sustained break above $100.24, particularly on the 1-hour chart and confirmed by increasing volume, could signal the start of a bullish move. This scenario, though currently carrying a lower probability (10%), would target the daily resistance levels at $103.43 and potentially $107.40.
Should I consider selling BRENT at current levels near $99.48 given the bearish 1H signals?
Selling at current levels carries risk due to the strong bullish trend on the daily chart. While the 1H indicators show bearish pressure, a more prudent approach would be to wait for a confirmed break below the $96.66 daily support level (60% probability bearish scenario) before initiating short positions, targeting $93.86.
Is the RSI at 39.06 on the 1H chart a strong sell signal for BRENT?
The RSI at 39.06 on the 1-hour chart indicates bearish momentum, but it's not an immediate sell signal on its own, especially when considering the stronger bullish trend on the daily chart (RSI 60.44). This hourly reading suggests potential for a near-term dip, but confirmation from other indicators and price action near key support levels is crucial.
How will upcoming Fed rate expectations affect BRENT prices around $99.48 this week?
Persistent inflation above target could lead the Fed to maintain a hawkish stance, potentially strengthening the USD (currently at 99.09) and pressuring Brent crude prices. Conversely, any sign of cooling inflation might ease rate hike fears, supporting oil prices. Traders should monitor upcoming economic data releases closely for shifts in Fed policy expectations.
Track markets in real-time
AI-powered analysis, technical indicators and real-time price data.
Join Our Telegram Channel
Breaking market news, AI analysis and trading signals instantly.
Join Channel