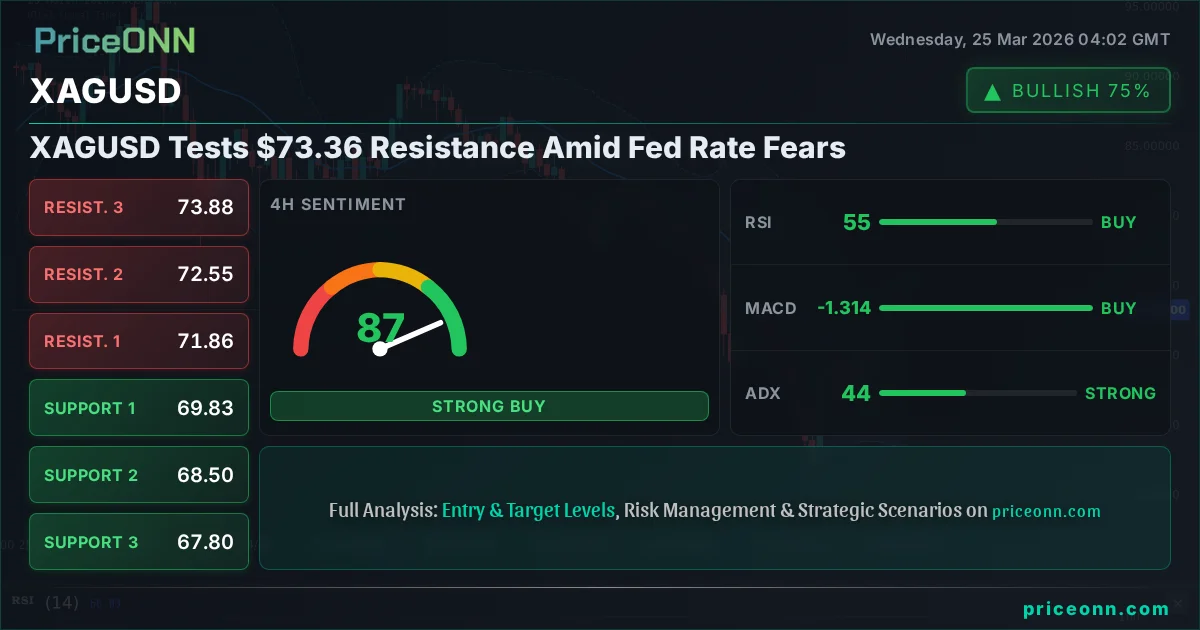
XAGUSD Tests $73.36 Resistance Amid Fed Rate Fears
Silver at $73.36 faces resistance as Fed rate uncertainty lingers. Technicals show mixed signals across timeframes, highlighting critical levels to watch.
The narrative surrounding the Federal Reserve's next move on interest rates is casting a long shadow over global markets, and precious metals are no exception. Silver, currently trading at $73.36, finds itself at a crucial juncture, testing resistance levels that could dictate its short-term trajectory. While the allure of gold often overshadows its shimmering cousin, silver's price action offers a compelling case study in how macroeconomic anxieties and technical undercurrents converge. Today, we delve into the intricate dance between Fed policy expectations and the technical landscape of XAGUSD, exploring whether the current bullish momentum can overcome the headwinds of potential rate stagnation.
- RSI at 67.58 signals a neutral-to-bullish leaning, indicating room for upward movement but approaching overbought territory on the 1-hour chart.
- Critical support for XAGUSD sits at $72.37, a level that has held firm in recent trading sessions, while resistance looms at $74.79.
- The MACD histogram on the 1-hour chart shows positive momentum, suggesting bulls are in control in the immediate term, but ADX readings across timeframes present a complex picture of trend strength.
- The DXY at 99.06 is showing strength, which typically pressures silver, but strong demand for silver is currently challenging this inverse correlation.
The global economic backdrop is a complex tapestry woven with threads of persistent inflation and cautious central bank signaling. Federal Reserve officials have been increasingly vocal about maintaining interest rates at current levels for an extended period, a stance driven by the stubbornness of inflation. This hawkish undertone from the Fed, even if passive, tends to strengthen the US Dollar (DXY currently at 99.06) and can put a lid on riskier assets. Historically, a stronger dollar and higher rates create headwinds for silver, a non-yielding asset. However, the narrative isn't always straightforward. Silver has shown remarkable resilience, even surging above $86 in recent memory due to strong investment demand, a testament to its dual nature as both an industrial metal and a safe-haven asset.
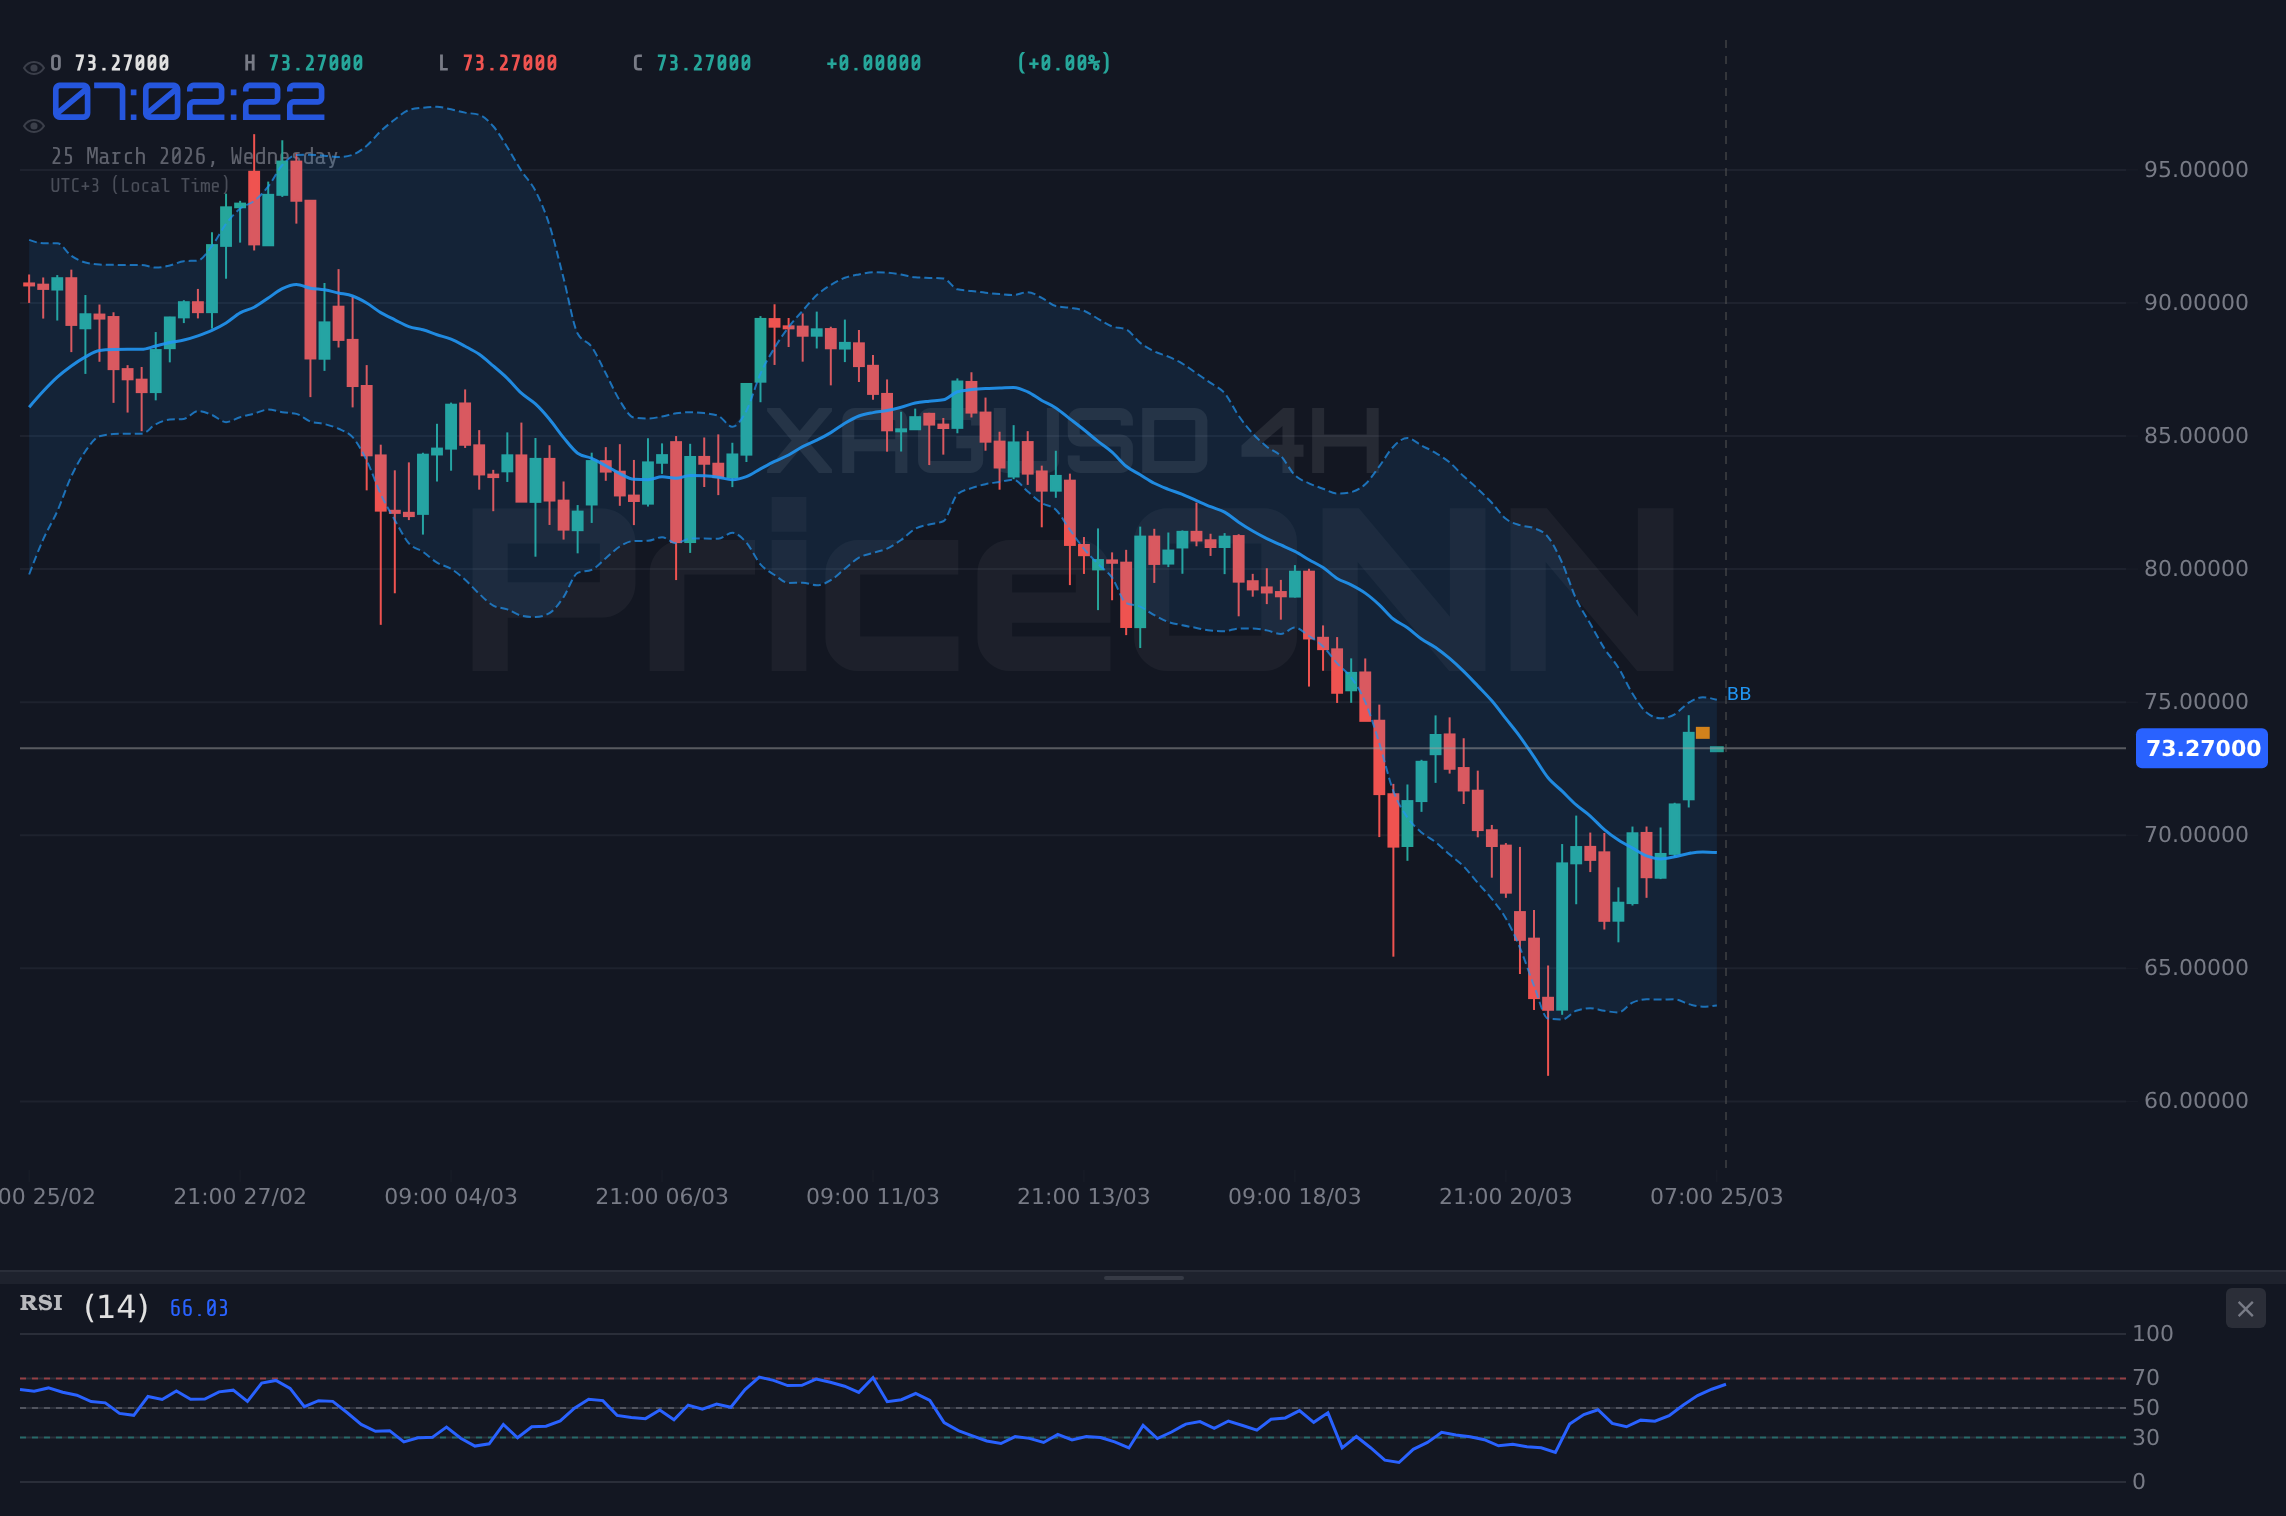
Looking at the 1-hour chart for XAGUSD, the trend is decidedly bullish, with a strong momentum reading of 90%. The price is comfortably above the middle Bollinger Band, and the MACD is showing positive momentum with the MACD line above the signal line. This paints a picture of immediate buying interest. The RSI at 67.58, while in the neutral zone, leans towards the higher end, suggesting that while there's room to run, traders should be mindful of approaching overbought conditions. The Stochastic Oscillator, with %K at 91.35 and %D at 93.2, is firmly in overbought territory, often signaling a potential pullback or consolidation. The ADX at 20.49 indicates a medium-strength uptrend, suggesting that the current upward move has some legs, but it's not yet a runaway train. Support is found at $73.17 and $72.85, levels that buyers are likely to defend if any profit-taking emerges.
Navigating the Cross-Currents: 4-Hour and Daily Perspectives
Shifting our focus to the 4-hour timeframe, the picture for XAGUSD becomes more nuanced, moving into a neutral trend with 50% strength. The price is still holding above the middle Bollinger Band, and the MACD continues to show positive momentum. However, the Stochastic Oscillator, while showing %K above %D, is at 81.62 and 66.22 respectively, indicating a strong upward move that is nearing overbought territory. The ADX here jumps to 50.69, which is a stark contrast to the 1-hour reading, signaling a very strong trend, but this is in the context of the 4H chart's overall neutrality. This divergence in ADX strength across different timeframes often suggests a market in transition, where short-term momentum might be battling longer-term consolidation. Support levels on this timeframe are significantly lower, around $71.86 and $70.21, highlighting the areas where a more substantial correction would need to find its footing.
The daily chart, however, presents a decidedly bearish trend, with a high strength of 94%. This longer-term perspective shows XAGUSD trading below its middle Bollinger Band, with negative MACD momentum and the MACD line below the signal line. The RSI at 36.62 is firmly in the lower half of the neutral zone, leaning towards oversold conditions, which could be interpreted as a contrarian bullish signal if buyers step in decisively. The Stochastic Oscillator, surprisingly, shows a bullish signal with %K (35.78) crossing above %D (17.48), indicating a potential upward move from oversold levels. The ADX at 27.45 suggests a strong downtrend is in place. This conflict between the daily bearish trend and the short-term bullish signals, coupled with the Stochastic's contrarian cue, creates a complex trading environment. It suggests that while the longer-term sentiment might be negative, there's potential for short-term rallies, especially if immediate buy-side pressure continues.
The divergence across these timeframes is precisely where sophisticated traders find opportunities. The bullish signals on the 1-hour and 4-hour charts, particularly the positive MACD momentum and the RSI's room to move higher, suggest that the immediate path of least resistance might still be upwards. However, the strong bearish trend on the daily chart and the elevated Stochastic readings in the overbought zone on the 1-hour chart serve as a cautionary tale. Any significant move higher will likely face stiff resistance as sellers might re-enter the market at higher prices, especially if the Fed's hawkish rhetoric solidifies. The key levels to watch are the immediate resistance at $74.79 and the more significant one at $74.46. A decisive break and hold above these levels on the daily chart would be needed to challenge the broader bearish sentiment.
The divergence in trend signals across different timeframes (bullish 1H/4H vs. bearish 1D) suggests potential for sharp reversals. Traders should exercise caution and utilize strict risk management, especially given the ongoing uncertainty surrounding Federal Reserve policy. A close below the 1-hour support at $73.17 could trigger a rapid move lower.
The Fed Factor and Its Shadow Over Silver
The Federal Reserve's monetary policy remains the most significant macro driver influencing XAGUSD and other risk assets. Recent statements from Fed officials have consistently pushed back against imminent rate cuts, emphasizing the need for more conclusive data showing inflation sustainably returning to the 2% target. The latest USD economic data, showing a mixed picture with some indicators like the Chicago PMI at 52.4 exceeding forecasts while others like the ISM Services PMI at 51.1 fell short, adds to the complexity. This ambiguity allows the Fed to maintain a data-dependent stance, which in practice often translates to a higher-for-longer interest rate environment. The market is pricing in a certain probability of rate cuts later in the year, but any hawkish surprises from the Fed could quickly unwind these expectations, leading to a stronger dollar and renewed pressure on silver.
The correlation between the US Dollar Index (DXY) and silver is a critical aspect to monitor. With the DXY currently at 99.06 and showing signs of strength, we often see inverse pressure on silver. A stronger dollar makes dollar-denominated commodities like silver more expensive for holders of other currencies, potentially dampening demand. However, as noted earlier, silver's recent performance has sometimes defied this typical correlation, indicating that other factors, such as strong industrial demand or safe-haven flows driven by geopolitical tensions, might be playing a more dominant role. The recent news regarding rising oil prices and persistent inflation concerns globally could be acting as a counter-balance to dollar strength, supporting commodities like silver.
Geopolitical risks also continue to be a significant underlying factor for precious metals. While specific geopolitical events are not detailed in the provided market data, the general global tension remains elevated. Events like conflicts in the Middle East or trade disputes can increase demand for safe-haven assets, including silver, even in the face of a strong dollar or rising interest rate expectations. The market is constantly evaluating these risks, and any escalation could provide a significant boost to silver prices, potentially overriding the bearish signals from a hawkish Fed.
The key for traders right now is to watch the confluence of factors. A bullish breakout above $74.79 on the daily chart, coupled with sustained positive momentum on the 1-hour and 4-hour charts, would be a strong signal to consider long positions. However, failure to hold support at $73.17 could signal a swift move back towards the $72.37 level.
Trade Scenarios for XAGUSD
Bearish Scenario: Fed's Shadow Lengthens
65% ProbabilityNeutral Scenario: Consolidation Zone
25% ProbabilityBullish Scenario: Demand Overrides Fed Fears
10% ProbabilityThe technical indicators present a mixed bag across different timeframes. The 1-hour chart leans bullish with positive MACD momentum and RSI at 67.58, though Stochastic is overbought. The 4-hour chart also shows bullish signals with positive MACD and a strong ADX, despite RSI being neutral. However, the daily chart paints a bearish picture with a strong downtrend, negative MACD, and RSI at 36.62. This conflict underscores the importance of risk management. The ADX readings also vary significantly, from a weak 18.72 on the 1-hour to a very strong 50.69 on the 4-hour, and then back to 27.45 on the daily, suggesting trend strength is inconsistent across timeframes.
Frequently Asked Questions: XAGUSD Analysis
What happens if XAGUSD breaks below the $73.17 support level?
If XAGUSD breaks decisively below the $73.17 support on the 1-hour chart, it could trigger further downside. The next key level to watch would be $72.85, with a potential acceleration towards $72.37 if bearish momentum builds.
Should I consider buying XAGUSD at current levels of $73.36 given the mixed signals?
Buying at $73.36 carries risk due to the conflicting signals across timeframes and the looming Fed uncertainty. A more prudent approach might be to wait for confirmation, such as a break above $74.79 resistance or a clear bounce from $73.17 support, with a probability estimate for such a move being around 10-25%.
Is the RSI at 67.58 a sell signal for XAGUSD right now?
An RSI reading of 67.58 on the 1-hour chart is not an immediate sell signal but indicates that the asset is approaching overbought territory. It suggests that bullish momentum might be losing steam and traders should watch for potential consolidation or a minor pullback before considering further upside.
How will the Fed's stance on interest rates affect XAGUSD this week?
If Fed officials maintain a hawkish tone, signaling higher-for-longer rates, it could strengthen the USD (currently at 99.06) and put downward pressure on XAGUSD. Conversely, any hint of a dovish pivot or acknowledgment of slowing inflation could support silver prices by weakening the dollar and increasing risk appetite.
Navigating the current market requires a keen eye on both macroeconomic drivers and technical nuances. While the 1-hour and 4-hour charts suggest potential for further upside, the daily bearish trend and the Fed's persistent inflation concerns cannot be ignored. The $73.36 price point for XAGUSD represents a battleground where short-term optimism clashes with longer-term caution. Patience and disciplined risk management are paramount. Watching for clear breaks of key support at $73.17 or resistance at $74.79 will be crucial in determining the next significant move. Ultimately, the market's ability to digest ongoing inflation data and Fed rhetoric will shape silver's path forward.
Track markets in real-time
AI-powered analysis, technical indicators and real-time price data.
Join Our Telegram Channel
Breaking market news, AI analysis and trading signals instantly.
Join Channel