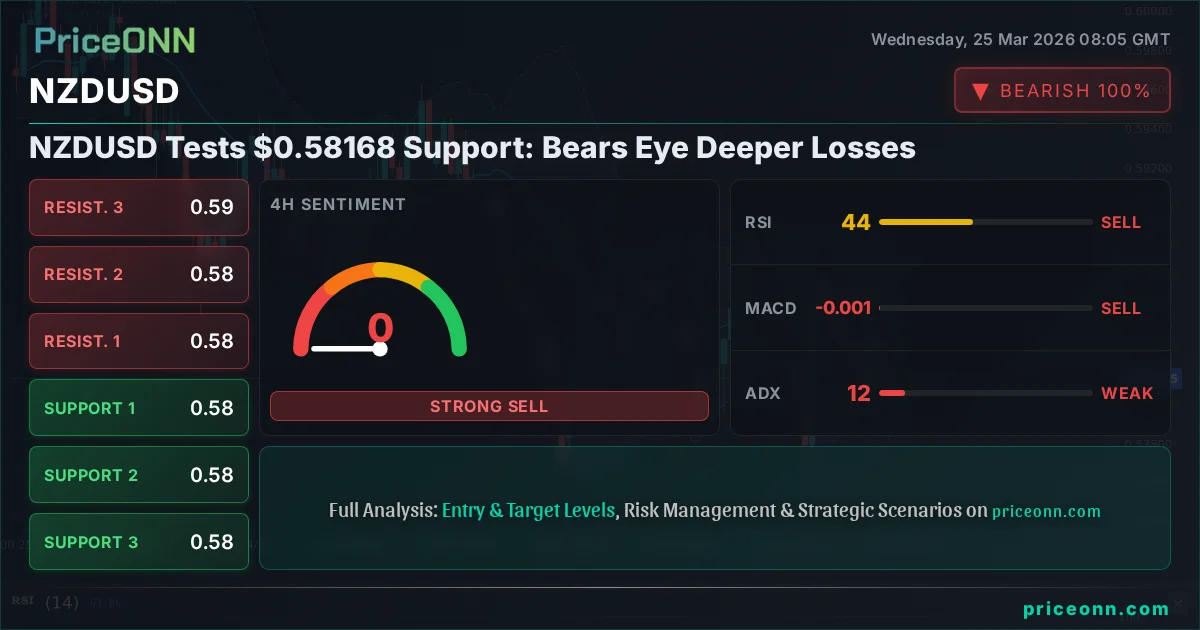
NZDUSD Tests $0.58168 Support: Bears Eye Deeper Losses
NZDUSD weakness persists below $0.58168 as bears target the 0.57955 support level. Technical indicators suggest further downside potential.
The narrative surrounding NZDUSD has taken a decidedly bearish turn, with the pair currently hovering precariously around the $0.58168 mark. This level, while seemingly stable for now, represents a critical juncture where bears are increasingly looking to exert further downward pressure. Recent market action, coupled with a concerning technical setup across multiple timeframes, suggests that a move towards the 0.57955 support level is not just possible, but perhaps probable, if current conditions persist. The confluence of macroeconomic headwinds and a potentially weakening risk appetite globally is painting a challenging picture for the New Zealand Dollar.
- NZDUSD is trading at $0.58168, with bears targeting the 0.57955 support level.
- The 1D chart shows a strong downtrend (Power: 86%), with RSI at 41.76 indicating further downside potential.
- ADX at 25.11 on the daily chart confirms a strong downtrend, suggesting momentum is with sellers.
- The US Dollar Index (DXY) at 99.12 is showing strength, correlating with NZDUSD weakness as per market data.
The broader market sentiment currently favors the US Dollar, as evidenced by the DXY's upward trajectory. With the Dollar Index trading at 99.12, a level indicating renewed strength, the pressure on riskier currencies like the Kiwi is palpable. Historically, a stronger dollar often spells trouble for commodity-linked currencies such as the NZD, and the current technical picture reinforces this correlation. Investors are closely watching how this dynamic plays out, as it could dictate the near-term direction for NZDUSD.
The Daily Downtrend Takes Hold
Looking at the daily chart for NZDUSD, the trend is undeniably bearish, with a reported power of 86%. This isn't just a fleeting dip; it suggests a sustained move lower is in play. The Relative Strength Index (RSI) at 41.76, while not yet in oversold territory, clearly indicates that momentum is favoring sellers. Traders are watching this level closely, as a fall below 40 would typically signal more significant selling pressure. The Average Directional Index (ADX) on the daily timeframe is sitting at a robust 25.11, confirming that a strong downtrend is indeed in motion. This is not a market for the faint of heart, as the trend strength suggests that corrections might be shallow and short-lived.
The MACD indicator on the daily chart also paints a grim picture, showing negative momentum with the MACD line firmly below its signal line. This reinforces the idea that downward pressure is building, and any attempts at a bounce are likely to be met with selling interest. Bollinger Bands, a key tool for volatility and trend assessment, show the price trading below the middle band on the daily chart, further confirming the bearish bias. The Stochastic Oscillator, while showing a crossover indicating a potential short-term bounce (K=30.8, D=38.29), is still in oversold territory from a broader perspective, and the crossover itself is not enough to signal a trend reversal in the face of such strong bearish indicators.
Near-Term Hurdles: The 1-Hour and 4-Hour Perspectives
While the daily chart screams 'sell,' the shorter timeframes offer a slightly more nuanced, though still predominantly bearish, view. On the 1-hour chart, the trend is classified as bearish with a power of 95%, and the RSI at 43.68 continues to reflect downward momentum. The ADX here is weak at 10.34, suggesting that the intraday moves might be choppy and lack sustained directional conviction, which can sometimes precede a larger move. However, the MACD is showing negative momentum, and the price is hugging the lower Bollinger Band, indicating potential oversold conditions on this very short-term timeframe, but not enough to signal a reversal against the daily trend.
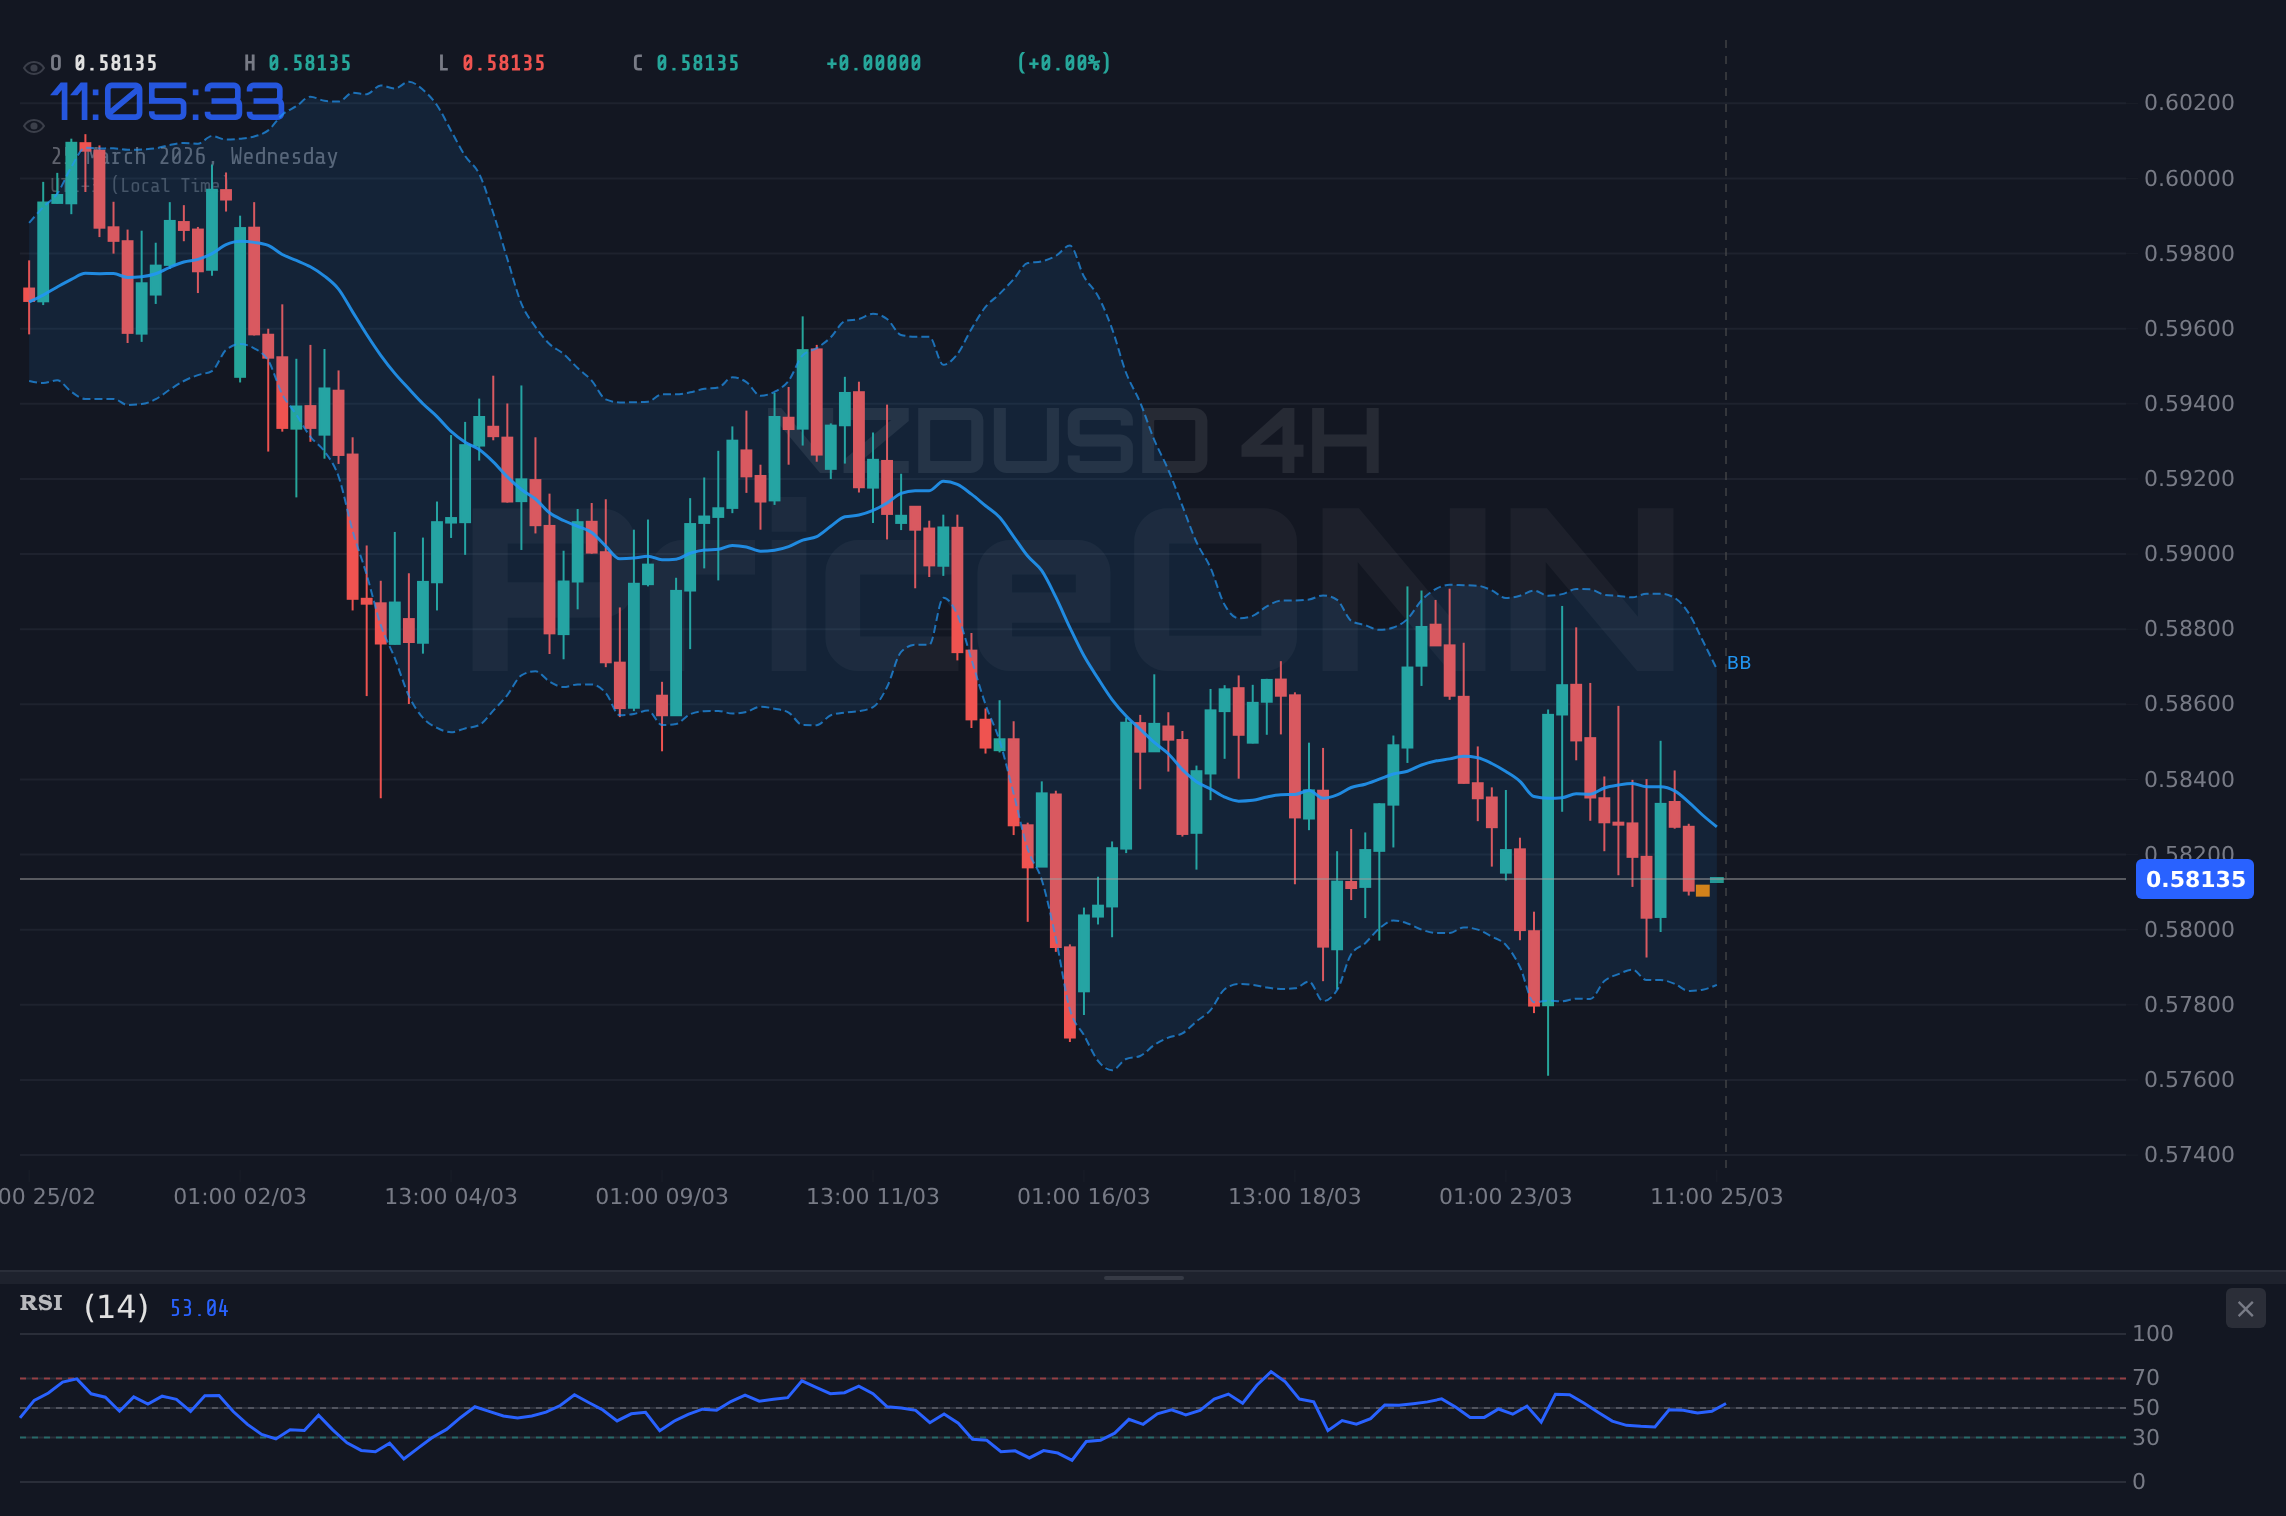
The 4-hour chart presents a slightly mixed bag, albeit still leaning bearish. The trend is noted as bearish with 88% power. The RSI at 42.59 continues the narrative of downward pressure. However, the ADX at 16.1 remains weak, suggesting a lack of strong trending impulse on this timeframe, which could lead to consolidation or a brief pause before the next leg down. The Stochastic Oscillator here shows a bullish crossover (%K: 42, %D: 38.38), which might suggest some short-term buying interest emerging from oversold conditions. Yet, the Bollinger Bands remain below the middle band, and the overall signal is still leaning towards 'SELL' (1 sell, 6 buy, 1 neutral), indicating that this timeframe is not yet offering a strong counter-trend signal against the daily decline.
Correlation with Global Markets: DXY and Risk Appetite
The performance of NZDUSD cannot be viewed in isolation. Its correlation with the US Dollar Index (DXY) and broader market risk appetite is a crucial element in understanding its trajectory. As mentioned, the DXY is currently trading at 99.12, showing strength. This robust dollar environment typically puts downward pressure on currencies like the NZD, which are often perceived as riskier assets. When the dollar strengthens, it becomes more expensive for holders of other currencies to acquire it, potentially dampening demand for assets denominated in USD and, by extension, currencies that move inversely to it.
Furthermore, the performance of major equity indices like the SP500 and Nasdaq provides insight into global risk sentiment. The SP500 is showing a daily uptrend (Power: 100%) but its 1D chart indicates a strong downtrend (ADX: 45.68), suggesting underlying weakness despite intraday gains. Similarly, the Nasdaq 100, despite a bullish 1H and 4H signal, has a strong daily downtrend (ADX: 40.91). This mixed but leaning negative risk-on sentiment in global equities can lead investors to seek refuge in safer assets, often benefiting the US Dollar and commodities like gold, while putting pressure on currencies like the NZD. The conflicting signals between short-term and long-term equity charts create an environment of uncertainty, which generally does not favor high-beta currencies.
The Role of Oil Prices and Geopolitics
While NZDUSD is primarily influenced by global risk sentiment and USD strength, commodity prices, particularly oil, can indirectly impact its movements. Recent news highlights volatility in oil prices, with conflicting signals about potential price jumps and corrections. Although the direct link between oil and NZDUSD is weaker than for other commodity currencies, sustained high oil prices can contribute to global inflation concerns, which in turn influences central bank policy expectations. If inflation remains sticky, central banks might be forced to maintain tighter monetary policies, potentially impacting global growth and risk appetite.
The market has also seen news regarding Europe's energy dependency and potential oil price shocks. While this is more directly linked to EUR and energy commodities, a significant global energy shock could ripple through financial markets, affecting investor sentiment towards all risk assets, including the NZD. Currently, Brent crude is showing a daily uptrend (Power: 100%) but a bearish signal on the 1H and 4H charts, indicating short-term weakness amidst a longer-term bullish trend. WTI crude, on the other hand, shows a daily uptrend (Power: 100%) but bearish signals on shorter timeframes. This oil market volatility adds another layer of uncertainty, making it difficult for risk-sensitive currencies to find stable footing.
Key Levels to Watch: Support at 0.57955
The immediate focus for NZDUSD traders will be the support level at 0.57955. This is not just an arbitrary number; it represents a significant floor on the daily chart. A decisive break below this level, especially with strong volume and conviction, would likely trigger further selling as stops are hit and momentum traders jump in. The next significant support level identified on the daily chart is at 0.57575, followed by 0.57224. These levels represent potential targets for the bears should the initial breakdown occur.
On the resistance side, the current price of $0.58168 acts as immediate resistance. However, looking at the 1-hour chart, key resistance levels are identified at 0.58148, 0.58182, and 0.58222. These are the levels that bulls would need to overcome to even suggest a short-term reprieve. On the 4-hour chart, resistance is seen at 0.58376 and 0.58477. Breaking above these levels would start to question the immediate bearish sentiment, but the strong daily downtrend suggests that these are more likely to act as selling opportunities in the short to medium term.
Economic Calendar Insights: What's Next?
The economic calendar offers crucial context for NZDUSD's potential future movements. While the provided data shows several high-impact events, the lack of specific dates for some USD events makes precise forecasting challenging. However, the presence of a strong USD and the general market sentiment suggest that any positive US economic data could further strengthen the dollar, exacerbating NZDUSD weakness. Conversely, any signs of a US economic slowdown or a shift in Fed policy expectations could provide a reprieve for the Kiwi.
The data shows upcoming US events with actual figures available, such as a figure of 52.4 for a manufacturing index and 51.1 for services PMI. If these come in above forecast, it would reinforce the bullish case for the USD. Conversely, figures below expectations could trigger USD selling and a potential bounce in NZDUSD. Upcoming GBP data, while not directly tied to NZDUSD, can influence broader currency market sentiment. Traders will be looking for any hints from upcoming economic releases that might signal a change in the global economic outlook or central bank policy direction.
Scenario Analysis: Navigating the Path Ahead
Bearish Outlook: The Path of Least Resistance
70% ProbabilityConsolidation Phase: Waiting for Clarity
20% ProbabilityBullish Reversal: A Glimmer of Hope?
10% ProbabilityFrequently Asked Questions: NZDUSD Analysis
What happens if NZDUSD breaks below the $0.57955 support level?
A break below $0.57955 on the daily chart would confirm the strong bearish trend, likely triggering further downside towards the $0.57575 support level. This scenario is supported by the daily RSI at 41.76 and a strong ADX of 25.11.
Should I consider buying NZDUSD at current levels around $0.58168 given the mixed signals?
Buying at current levels around $0.58168 is not advised given the dominant daily downtrend and weak risk appetite. While some short-term technical indicators show minor bullish crossovers, they are insufficient to counter the prevailing bearish momentum. A confirmed break above $0.58376 resistance would be needed for a more confident bullish outlook.
Is the RSI at 41.76 on the daily chart a sell signal for NZDUSD?
An RSI reading of 41.76 on the daily chart is not an outright sell signal, but it indicates that momentum is firmly with the sellers. It suggests there is significant room for further downside before reaching oversold territory, reinforcing the bearish bias for NZDUSD.
How will the rising DXY at 99.12 affect NZDUSD this week?
The rising DXY at 99.12 typically exerts downward pressure on NZDUSD. This strengthens the bearish scenario, as a stronger dollar makes it more expensive for global investors to hold riskier assets like the Kiwi. Expect this correlation to continue weighing on NZDUSD unless key US data surprises negatively.
“Patience is a virtue in trading. Wait for the setup to align with your analysis, manage your risk diligently, and let the market come to you. The trend is your friend until it ends.”
Track markets in real-time
AI-powered analysis, technical indicators and real-time price data.
Join Our Telegram Channel
Breaking market news, AI analysis and trading signals instantly.
Join Channel