GBPUSD Tests $1.34: Navigating Neutral Territory as Traders Eye Key Levels
GBPUSD hovers around $1.34, caught between conflicting signals. With ADX at 16.02, the trend lacks conviction, leaving traders watchful for a decisive move. This analysis explores the technical landscape and macroeconomic undercurrents shaping GBPUSD's immediate future.
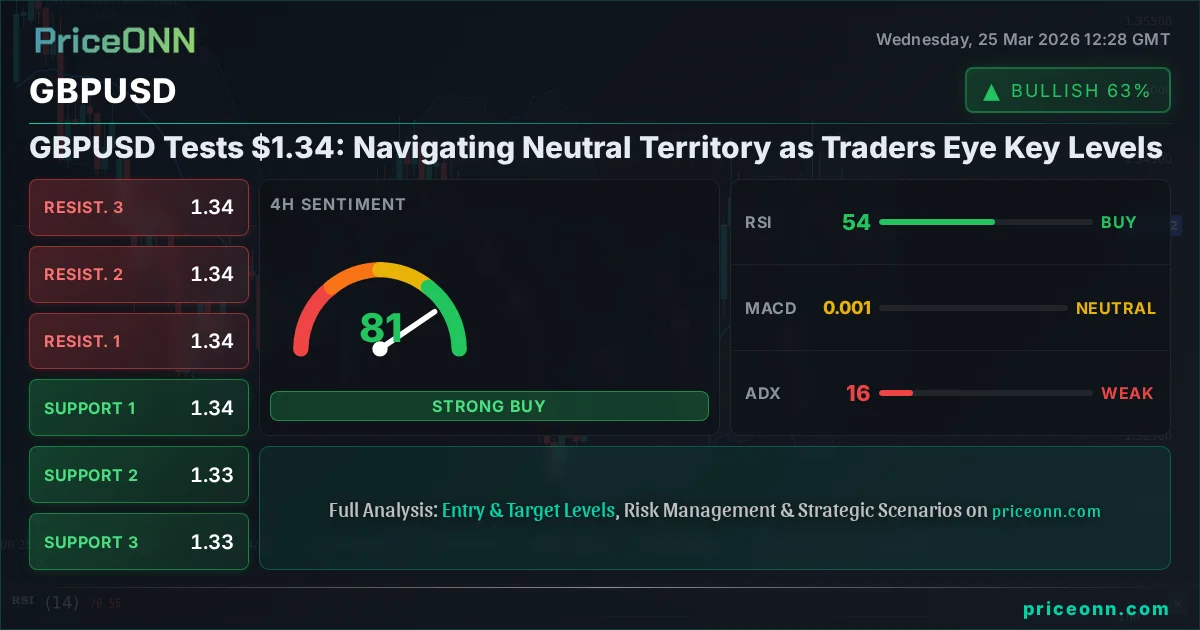
GBPUSD is currently treading water around the $1.34 mark, presenting a classic 'neutral' setup that demands patience and precise observation. Having traded sideways for a considerable period, the pair is exhibiting a distinct lack of directional conviction. The Average Directional Index (ADX) at 16.02 on the 4-hour chart is the clearest signal of this indecision, indicating a weak trend that offers little clarity for aggressive traders. This isn't a market for the impulsive; it's a scenario where careful analysis of key levels, indicator divergences, and the subtle shifts in macroeconomic sentiment will be crucial for identifying any potential breakout opportunities. The question on many traders' minds is whether this consolidation is a prelude to a significant move or simply a prolonged period of choppy trading.
- GBPUSD is trading around $1.34032, reflecting a neutral market sentiment with weak trend strength (ADX at 16.02 on 4H).
- Critical support for GBPUSD is identified at $1.33579 (S1 on 4H), while resistance looms at $1.34029 (R1 on 4H).
- Conflicting signals from indicators like Stochastic (bullish on 4H, bearish on 1H) and RSI (55.63 on 1H, 53.62 on 4H) highlight the current indecision.
- Market participants are closely watching for economic data releases and geopolitical shifts that could provide the catalyst for a decisive move away from current levels.
The recent price action around $1.34032 paints a picture of equilibrium, but equilibrium in financial markets is often a temporary state. On the 1-hour chart, the Sterling shows a slight bearish lean with a daily change of -0.06%, yet the 4-hour chart hints at a more bullish undercurrent. This divergence is exactly what makes the current environment so challenging. The RSI, for instance, sits in neutral territory across both timeframes – 55.63 on the 1-hour and 53.62 on the 4-hour – suggesting neither bulls nor bears have a firm grip. Similarly, the Stochastic oscillator offers conflicting signals: a potential buy signal on the 4-hour (%K at 55.69, %D at 63.7 showing %K < %D, though this is a *bearish cross* in an overbought zone, indicating a potential dip) clashes with a sell signal on the 1-hour (%K at 51.06, %D at 31.57 showing %K > %D, suggesting a move higher).
This ambiguity is amplified when we consider the broader market context. The US Dollar Index (DXY) is currently at 99.11, showing a slight upward bias. Typically, a stronger dollar tends to weigh on pairs like GBPUSD. However, the current DXY trend strength on the daily chart is only moderate (ADX 31.89), suggesting its upward momentum might not be strong enough to dictate a clear direction for GBPUSD on its own. The S&P 500 is trading at 6608.5, showing a modest gain, which usually correlates with higher risk appetite and could be seen as supportive of GBPUSD. Yet, the Nasdaq 100 is also showing a similar picture, trading at 24236.01. This general stability in major equity indices doesn't provide a strong risk-on or risk-off signal to lean on.
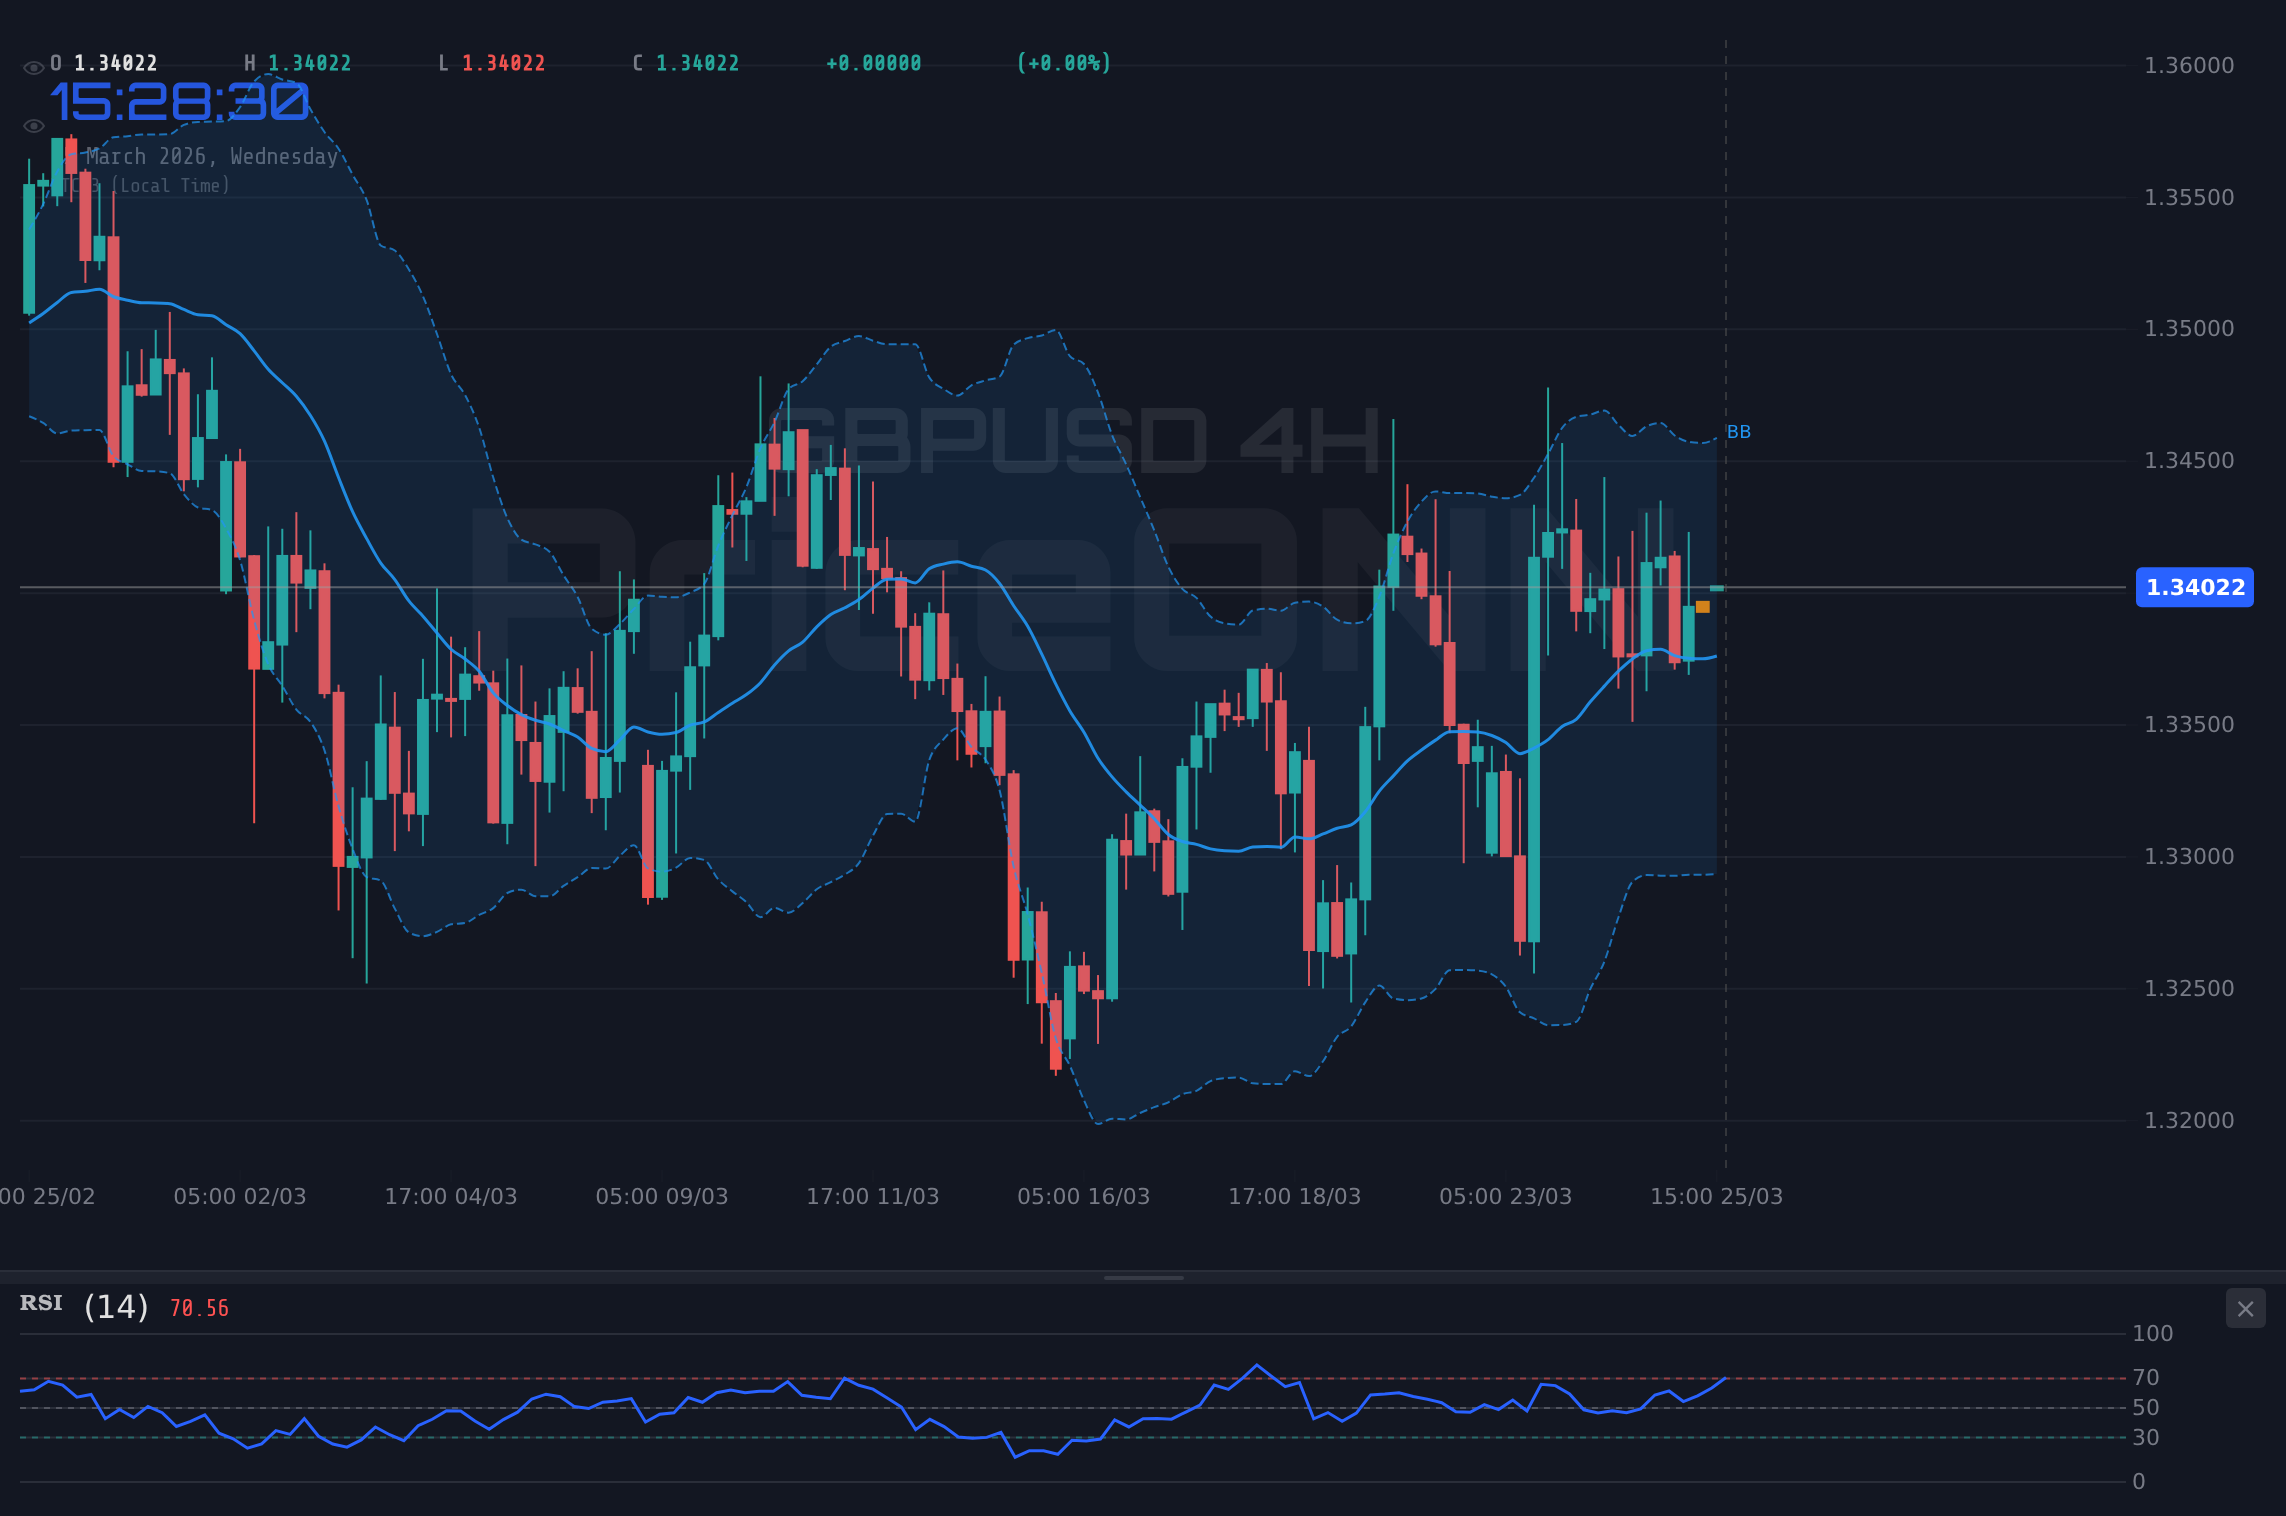
Digging deeper into the technicals, the Bollinger Bands on the 1-hour chart for GBPUSD are currently hugging the lower band, indicating potential oversold conditions or a breakdown in momentum. This is often a precursor to either a sharp reversal or a continuation of the downtrend. However, the ADX reading of 21.32 on this timeframe suggests a lack of strong directional force, making a clean breakout less likely without a significant catalyst. On the 4-hour chart, the Bollinger Bands are trading between the middle and upper band, suggesting a more constructive, albeit weak, upward bias. This conflicting picture across timeframes underscores the neutral stance.
The commodity markets are also playing a role in this complex narrative. Gold is currently priced at $4555.01, showing a significant daily gain of 1.81%. This rise in gold, often seen as a safe-haven asset, might suggest underlying geopolitical or inflation concerns that could indirectly impact currency markets. Silver, at $72.75, is also showing upward momentum. Meanwhile, Brent crude oil is trading at $99.76, and WTI at $89.15. Both are showing modest gains, indicating that energy prices are holding firm, which can contribute to inflationary pressures. Persistent inflation concerns often lead to expectations of higher interest rates, which could theoretically support currencies like the Pound, but the immediate market reaction is muted.
Looking at the macroeconomic calendar, recent data shows mixed signals. The US ISM Manufacturing PMI came in at 52.4, slightly above the forecast of 51.5, which is a positive sign for the US economy. However, the ISM Services PMI was slightly below expectations at 51.1 versus a forecast of 52.0. On the UK side, the Bank of England's interest rate decision remained unchanged at 3%, as expected. The lack of significant surprises from these recent data points means the market is still searching for a clear direction. Upcoming economic events, particularly inflation figures for the UK and employment data from the US, will be critical in shaping the narrative for GBPUSD in the coming days. Any deviation from expectations could easily break the current stalemate.
The Japanese Yen, trading at 158.976 against the USD, is showing a strong upward trend on the 1-hour and 4-hour charts, indicating potential safe-haven demand or carry-trade unwinding. This strength in USD/JPY, despite the overall DXY picture, adds another layer of complexity. The AUD/USD at 0.6956 and NZD/USD at 0.58141 are both showing downward pressure, reflecting broader weakness in commodity-linked currencies. This general risk aversion in the antipodean currencies could be a subtle signal that the overall market sentiment is leaning towards caution, despite the flat performance in US equities.
The narrative around GBPUSD is further complicated by the conflicting signals from different timeframes. While the 1-hour chart might suggest a slight bearish bias due to the Bollinger Bands touching the lower band, the daily chart paints a different picture. The ADX on the daily timeframe is 27.45, indicating a strong downtrend, yet the Stochastic oscillator is showing a potential buy signal (%K at 35.33, %D at 17.41). This is a classic case of indicators giving contradictory signals, meaning traders should be extremely cautious. The RSI at 35.9 on the daily chart is approaching oversold territory, which could suggest a bounce is possible, but the overall trend strength indicated by ADX remains a significant headwind.
The current price of $1.34032 for GBPUSD sits precariously between key support and resistance levels across different timeframes. On the 4-hour chart, the first level of support is at $1.33579, followed by $1.33129. Resistance is seen at $1.34029, $1.34319, and then $1.34479. On the daily chart, the levels become more pronounced: support at $1.33604, $1.33094, and resistance at $1.34532, $1.3495. A clear break above the daily resistance at $1.34532 would be needed to suggest a significant shift in momentum, while a decisive close below the 4-hour support at $1.33579 could trigger further downside. The current price is essentially dancing on the edge of these critical zones.
The geopolitical landscape remains a background hum of uncertainty. While there are reports of potential US-Iran peace talks, which could ease some risk premiums in energy markets and potentially boost risk appetite, the broader geopolitical tensions, including the ongoing conflict in Eastern Europe, continue to cast a shadow. This underlying geopolitical risk often translates into demand for safe-haven assets like gold, as seen by its recent rally. However, the immediate impact on GBPUSD is not straightforward. A surge in risk aversion could weaken Sterling, while a de-escalation might offer it some support, depending on how it influences Fed rate hike expectations.
The technical picture is a tapestry woven with conflicting threads. The MACD on the 1-hour chart shows negative momentum, with the MACD line below the signal line, suggesting selling pressure. However, on the 4-hour chart, the MACD is positive and above the signal line, indicating bullish momentum. This inconsistency highlights the choppy nature of the current market. The Stochastic oscillator on the 1-hour is giving a buy signal, but it’s in the mid-range, not an extreme. On the 4-hour, it’s also giving a buy signal but is nearing overbought territory, which could foreshadow a reversal. The ADX, as mentioned, consistently points to weak trending conditions across most timeframes, making any breakout suspect until confirmed by increased volume and sustained price action.
Considering the overall data, the market sentiment for GBPUSD appears to be in a state of flux. While the Daily chart exhibits a downtrend (ADX 27.45), the shorter timeframes (1H and 4H) show mixed signals with some leaning towards neutral or even slightly bullish. The key levels identified are $1.33579 as a critical support and $1.34029 as immediate resistance on the 4H. A move above $1.34319 could open the door for further upside, while a break below $1.33129 would signal a more significant bearish continuation. Without a clear catalyst from upcoming economic data or a shift in global risk sentiment, GBPUSD is likely to remain range-bound, offering limited opportunities for significant gains but potential for tactical trades within the defined boundaries.
Bearish Scenario: Testing Lower Support
60% ProbabilityNeutral Scenario: Range-Bound Consolidation
30% ProbabilityBullish Scenario: Breakout Above Resistance
10% ProbabilityFrequently Asked Questions: GBPUSD Analysis
What happens if GBPUSD breaks below the 4H support at $1.33579?
A break below $1.33579 would invalidate the neutral stance and likely trigger a move towards the next support level at $1.33129. This scenario gains probability if broader market risk appetite wanes or US dollar strength accelerates.
Should I buy GBPUSD at current levels of $1.34032 given the mixed indicator signals?
Buying at current levels is not advised due to the neutral setup and weak trend strength (ADX 16.02). A more prudent approach would be to wait for a clear break above 4H resistance near $1.34319 or a confirmed reversal signal near 4H support around $1.33579, with probabilities currently favouring a bearish move.
Is the Stochastic buy signal on the 4H chart (K=55.69, D=63.7) a reason to consider buying GBPUSD?
The Stochastic signals are conflicting and near overbought territory on the 4H, making it a questionable buy signal. While %K is below %D, indicating a potential bearish cross, it is in an area that often precedes a dip. Confirmation from other indicators and price action breaking key resistance would be needed for a bullish conviction.
How will upcoming UK CPI data and US Non-Farm Payrolls affect GBPUSD this week?
Stronger-than-expected UK inflation could bolster the Pound by increasing rate hike expectations, potentially pushing GBPUSD towards resistance at $1.34532. Conversely, weak US NFP figures could weaken the dollar, offering support to GBPUSD, while strong NFP might reinforce dollar strength and push the pair towards support at $1.33579.
The path forward for GBPUSD hinges on its ability to break out of this current neutral phase. The confluence of weak trend strength, conflicting indicator signals, and key levels acting as barriers suggests that significant price movement is unlikely without a catalyst. Traders must remain vigilant for shifts in market sentiment, potential economic surprises, and clear technical breakouts. Patience appears to be the most valuable strategy right now; waiting for confirmation rather than forcing trades in this choppy environment will be key to preserving capital and capitalizing on future opportunities. The market is whispering, not shouting, and listening closely to the subtle cues will separate those who navigate these waters successfully from those who get caught in the crosscurrents.
Track markets in real-time
AI-powered analysis, technical indicators and real-time price data.
Join Our Telegram Channel
Breaking market news, AI analysis and trading signals instantly.
Join Channel