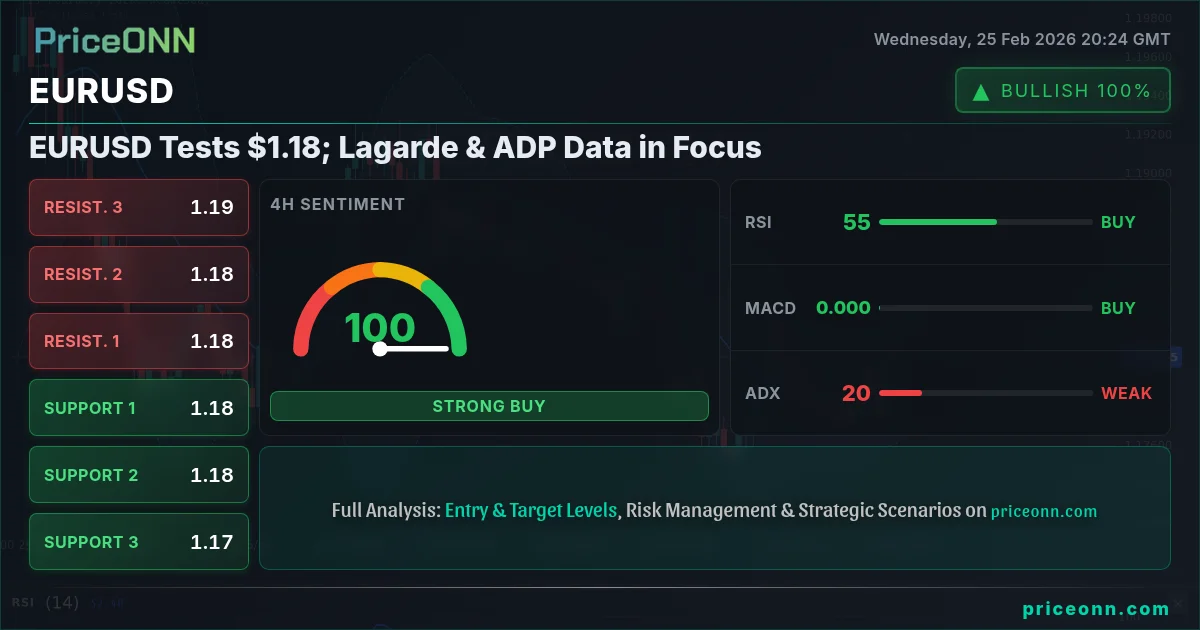
EURUSD is currently trading near $1.18, a level that has acted as a pivotal point in recent sessions. The pair is caught between conflicting forces: a strengthening dollar index (DXY) at 97.37 which typically pressures EURUSD, and a generally positive risk sentiment reflected in rising equity indices like the SP500 at 6946.75 and Nasdaq100 at 25318.27. This tug-of-war sets the stage for potential volatility as traders await key economic data and central bank commentary.
- RSI at 59.45 on the 1H chart indicates building bullish momentum, but not yet in overbought territory.
- Immediate resistance lies at 1.18082, a break above which could trigger further upside.
- Key support at 1.18015 must hold to prevent a retest of lower levels.
- Upcoming ADP employment data and ECB commentary are key catalysts for EURUSD correlation with DXY.
Examining the technical picture, the 1-hour timeframe shows a bullish trend with 85% strength. The RSI(14) sits at 59.45, suggesting increasing buying pressure, but not yet extreme. The MACD is showing positive momentum, reinforcing the bullish sentiment in the short term. However, the ADX is relatively low at 19.13, indicating a weak trend, meaning the current move could easily reverse. The stochastic oscillator, with K=80.82 and D=65.9, signals a potential overbought condition, cautioning against aggressive entries. Looking at Bollinger Bands, the price is testing the upper band, possibly indicating an overbought scenario or a potential breakout. All of this mixed with a generally bullish overall signal.
Stepping back to the 4-hour chart, the trend shifts to neutral, although still bullish. The RSI(14) reads 54.16, also indicating a neutral condition. The MACD is positive, confirming the upward momentum, but the ADX is slightly higher at 20.52, suggesting a moderate uptrend. The stochastic oscillator, with K=51.79 and D=40.62, also signals a bullish setup. The price is currently testing the upper Bollinger Band, suggesting potential overbought conditions. From a multi-timeframe perspective, the short-term bullish momentum is running into a longer-term neutral trend, creating a potential inflection point.
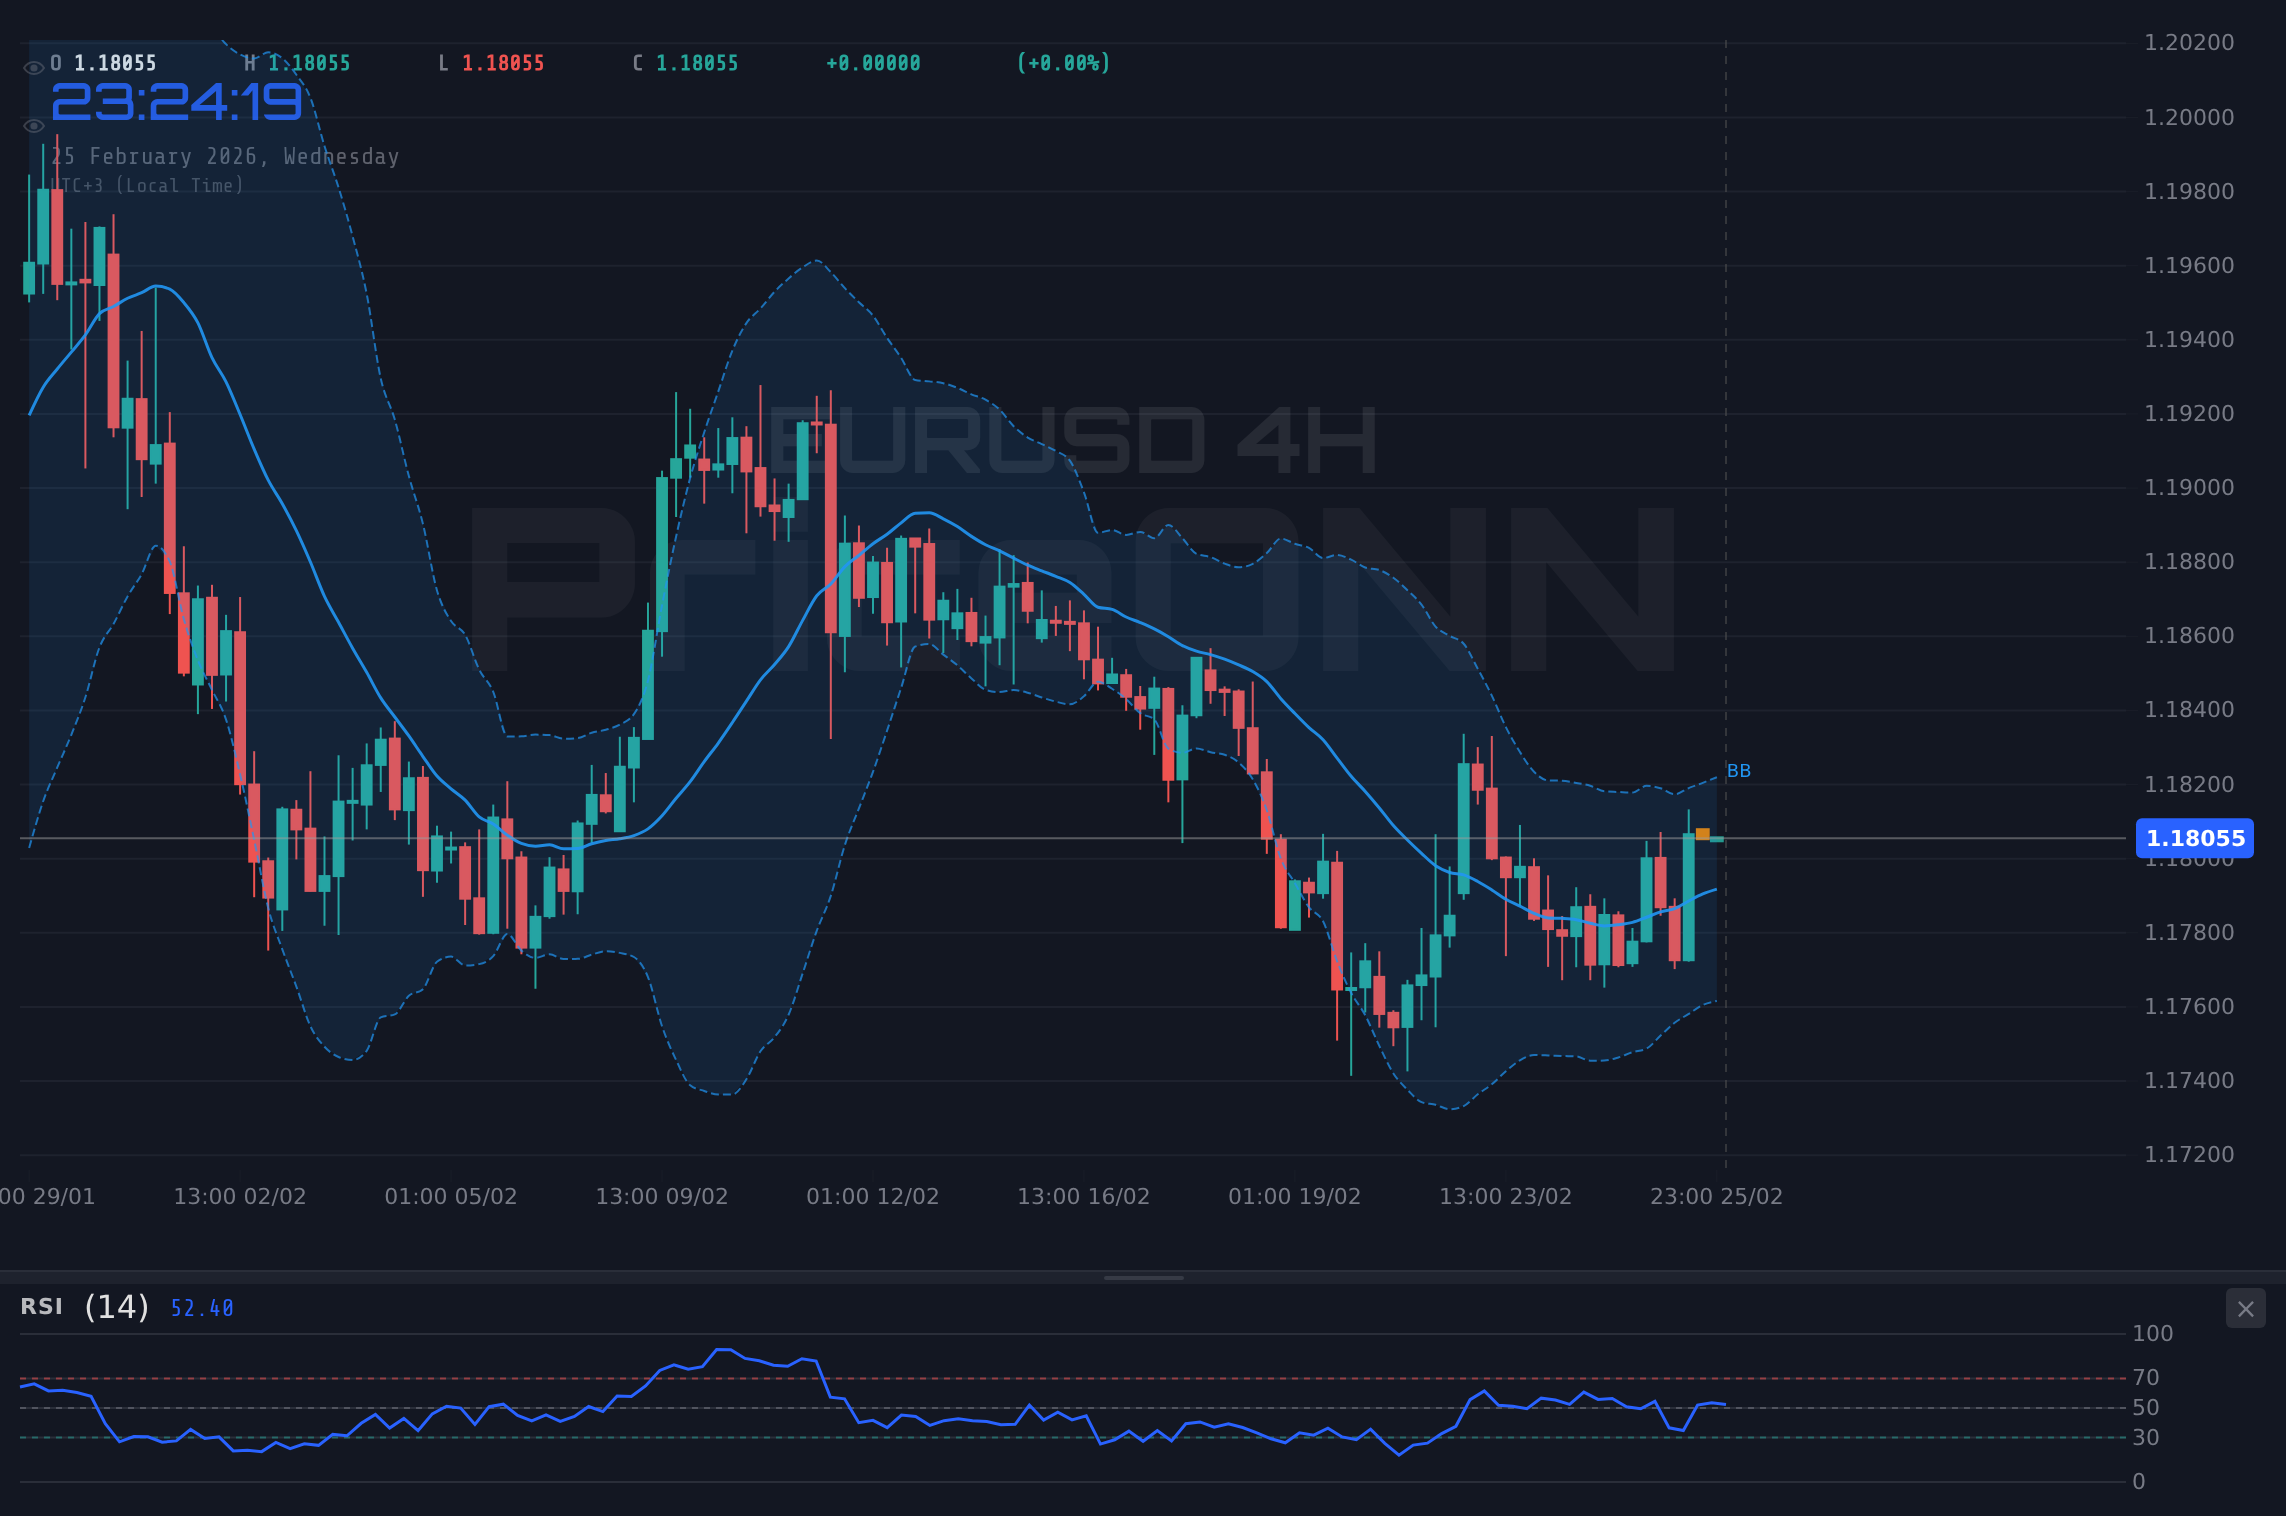
On the daily timeframe, the trend is neutral. The RSI(14) is at 50.15, suggesting a balanced market. The MACD shows negative momentum, signaling a potential bearish reversal. The ADX is at 19.21, indicating a weak trend. The stochastic oscillator, with K=29.35 and D=25.87, signaling a bullish trend. Examining the Bollinger Bands, the price is above the middle band, potentially indicating a bullish trend. The daily chart suggests a longer-term consolidation phase, with the recent bullish momentum potentially being a short-term correction within a broader range.
Key resistance levels to watch are 1.18082, 1.18125, and 1.18149 on the 1-hour chart. These levels represent potential areas where the price could face selling pressure and reverse. On the downside, immediate support lies at 1.18015, with further support at 1.17991 and 1.17948. A break below 1.18015 could trigger a retest of lower levels, potentially leading to a more significant correction. These levels must hold to prevent a bearish breakdown.
Historically, EURUSD has shown a tendency to consolidate around major psychological levels like $1.18, especially during periods of economic uncertainty or conflicting central bank policies. In 2022 and 2023, similar consolidation patterns emerged as the Fed and ECB diverged in their monetary policy approaches. The current setup mirrors that tension, with the market awaiting clarity on future rate decisions. The last time EURUSD traded consistently above 1.20 was in early 2022, before the full impact of the energy crisis and the Fed's aggressive tightening cycle took hold. This historical context reinforces the importance of $1.18 as a key level to watch.
The correlation analysis reveals that the dollar index (DXY) at 97.37 is exerting downward pressure on EURUSD. A stronger dollar typically weighs on the pair, as it makes the euro relatively more expensive. Conversely, the positive risk sentiment reflected in rising equity indices like the SP500 and Nasdaq100 is providing some support to EURUSD. This divergence between the DXY and equity indices is creating a complex dynamic for the pair. Brent crude oil is trading at $65.73, showing a modest increase. Higher oil prices can sometimes lead to increased inflation expectations, which could influence central bank policies and, in turn, impact EURUSD.
From a fundamental perspective, the upcoming ADP employment data and ECB commentary are key catalysts to watch. The ADP data will provide insights into the strength of the US labor market, which could influence the Fed's future rate decisions. Strong ADP data could bolster the dollar and pressure EURUSD, while weak data could have the opposite effect. Similarly, ECB President Lagarde's comments will be closely scrutinized for clues about the central bank's policy outlook. Hawkish comments could support the euro, while dovish comments could weigh on it. The latest EUR data shows a 0.3% increase, inline with expectations. While the latest EUR data shows a 1.7% increase, inline with expectations, a slight decrease compared to the previous 1.9%.
Given the current technical and fundamental backdrop, a short-term bullish trade setup is viable, but with careful risk management. The 1-hour chart shows a bullish trend, but the stochastic oscillator suggests a potential overbought condition. Therefore, waiting for a minor pullback before entering a long position could be prudent. The initial target would be 1.18082, with a stop-loss placed below 1.18015. A more aggressive target could be 1.18125, but this would require a higher risk tolerance.
EURUSD breaks above 1.18082 resistance, fueled by dovish ECB comments or weak ADP data, targeting 1.18125 and potentially 1.18149. Continuation depends on sustained positive risk sentiment and dollar weakness.
EURUSD fails to hold 1.18015 support, pressured by strong dollar and hawkish ECB hints, targeting 1.17991 and potentially 1.17948. Breakdown confirmed by negative risk sentiment.
For scalpers, the 1-hour chart provides the most relevant signals. Look for quick entries and exits around the key levels mentioned above. Swing traders should focus on the 4-hour chart, waiting for a sustained break above 1.18082 or below 1.18015 before committing to a longer-term position. Long-term investors should monitor the daily chart for signs of a broader trend reversal. A sustained break above 1.18149 could signal the start of a new uptrend, while a break below 1.17948 could lead to further downside.
Frequently Asked Questions: EURUSD Analysis
Is EURUSD a good buy right now?
EURUSD at $1.18 presents a mixed picture. The short-term bullish trend suggests a potential buying opportunity, but the stochastic oscillator indicates overbought conditions. Waiting for a minor pullback before entering a long position is recommended.
What is the EURUSD price forecast for this week?
The EURUSD price forecast for this week hinges on the ADP employment data and ECB commentary. A break above 1.18082 could lead to a test of 1.18125, while a break below 1.18015 could target 1.17991. Probability is 60/40 bullish.
What are the key support and resistance levels for EURUSD?
Key support levels for EURUSD are 1.18015, 1.17991, and 1.17948. Resistance levels are 1.18082, 1.18125, and 1.18149. These levels represent potential areas where the price could face buying or selling pressure.
Why is EURUSD moving today?
EURUSD is moving today due to a combination of factors, including the strengthening dollar index, positive risk sentiment in equity markets, and anticipation of upcoming ADP employment data and ECB commentary. The market is currently in a state of equilibrium, awaiting a clear catalyst for a breakout.
Technical Outlook Summary
| Indicator | Value | Signal |
|---|---|---|
| RSI (14) | 59.45 | Neutral |
| MACD Histogram | Positive | Bullish |
| Stochastic | K=80.82, D=65.9 | Bearish |
| ADX | 19.13 | Weak |
| Bollinger | Upper Band | Watch |
Key Levels
Support Levels
Resistance Levels
Track markets in real-time
AI-powered analysis, technical indicators and real-time price data.
Join Our Telegram Channel
Breaking market news, AI analysis and trading signals instantly.
Join Channel