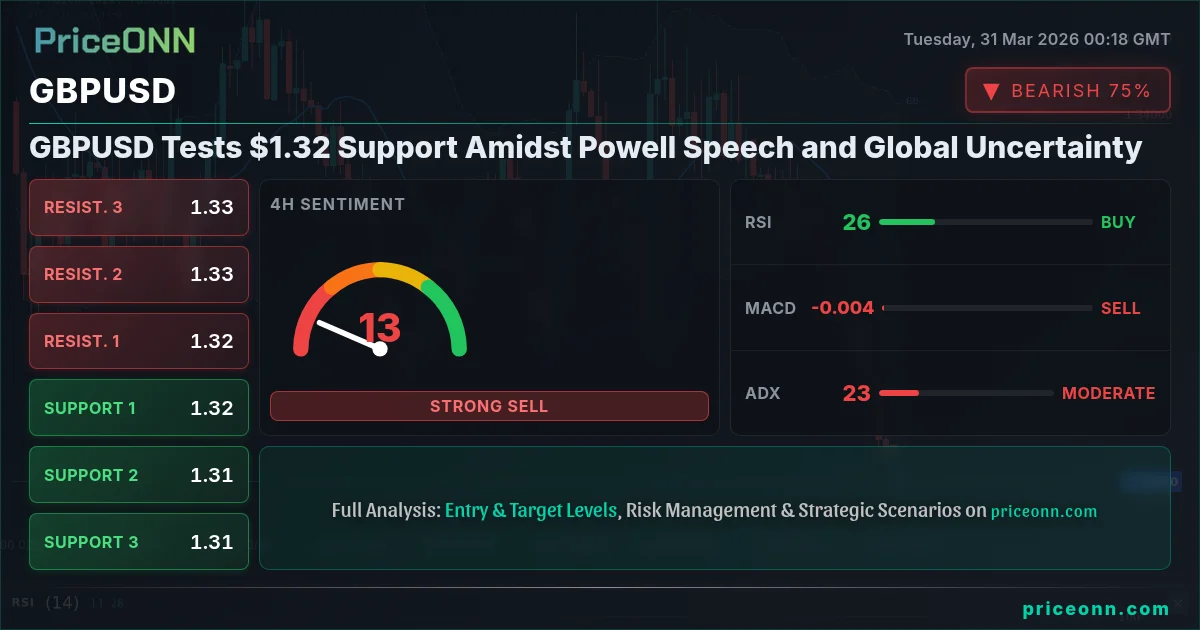
GBPUSD Tests $1.32 Support Amidst Powell Speech and Global Uncertainty
GBPUSD hovers around $1.32 as traders digest Fed Chair Powell's speech and await key economic data. Will support hold?
The currency pair GBPUSD is currently navigating a critical juncture, trading precariously around the $1.32 mark. This level, a significant psychological and technical threshold, comes under intense scrutiny as markets digest a complex mix of factors, including the latest commentary from Fed Chair Jerome Powell and a backdrop of persistent geopolitical tensions. The question on every trader's mind is whether the current support at $1.32 will hold, or if a decisive break lower is imminent. Understanding the interplay between monetary policy signals, economic data releases, and broader market sentiment is crucial for navigating this volatile environment.
- GBPUSD is trading near the critical $1.32 support level, with the 1-day RSI at 37 indicating further downside potential.
- The 4-hour chart shows a strong downtrend with ADX at 23.61, suggesting momentum could continue if key resistance levels are not breached.
- Fed Chair Powell's recent commentary, while cautious, has reinforced a stance that keeps the door open for potential policy adjustments, impacting USD strength.
- Geopolitical jitters continue to weigh on risk appetite, potentially increasing safe-haven demand for the USD and pressuring GBPUSD lower.
Navigating Policy Signals: Powell's Nuances
The recent address by Federal Reserve Chair Jerome Powell has injected a layer of complexity into the market's outlook, particularly for currency pairs like GBPUSD. While Powell's remarks were carefully calibrated to avoid definitive forward guidance, the undertones suggest a Fed that remains data-dependent and attentive to inflation persistence. The market's interpretation of these nuances is critical. A perception of continued hawkishness from the Fed, or even a delayed pivot, tends to bolster the US Dollar, creating headwinds for GBPUSD. Conversely, any hint of a more dovish stance, perhaps in response to softening economic data, could offer relief to the Sterling. The current technical indicators on the 1-day chart for GBPUSD paint a picture of caution, with the RSI at 37.14 suggesting that while not yet oversold, the pair is certainly under pressure, leaving ample room for further downside if negative catalysts emerge.
The Dollar's Dominance: DXY's Influence
The strength of the US Dollar Index (DXY) remains a paramount factor influencing GBPUSD's trajectory. Currently, the DXY is trading around 100.44, showing robust upward momentum. This strength, particularly evident in its 1-day trend strength of 100%, directly correlates with downward pressure on GBPUSD. When the dollar strengthens, it typically makes the British Pound appear relatively more expensive for foreign buyers, thus dampening demand. The DXY's ascent, fueled by a combination of global economic uncertainty and the Fed's policy stance, creates a challenging environment for Sterling. The ADX on the 1-day chart for DXY is 32.78, indicating a strong upward trend that likely needs to show signs of faltering before GBPUSD can mount a sustainable recovery.
Geopolitical Undercurrents and Risk Appetite
Beyond monetary policy, the global geopolitical landscape continues to cast a long shadow over financial markets. Escalating tensions in the Middle East, as reported by sources like Reuters, have sent tremors through energy markets and are contributing to a general decline in risk appetite. This risk-off sentiment often translates into a flight to safety, benefiting assets like the US Dollar and Treasury bonds, while simultaneously pressuring riskier currencies and assets. The impact on GBPUSD is significant; as a major currency pair, it is sensitive to shifts in global risk perception. The decline in the S&P 500, currently down 0.58% on the day, and the Nasdaq Composite, which has fallen 1.17%, further underscores this risk aversion. This broader market weakness suggests that any upside for GBPUSD will likely face stiff resistance, especially with the 4-hour RSI for GBPUSD at 31.07, indicating a strong bearish bias in the short to medium term.
Sterling's Specific Challenges: Economic Data Woes
While global factors play a substantial role, the British Pound also faces specific domestic headwinds. Recent economic data releases from the UK have been less than stellar, fueling concerns about the nation's growth prospects. Indicators such as PMI surveys and inflation figures, which are crucial for shaping Bank of England policy expectations, have been mixed or weaker than anticipated. The lack of strong positive economic signals makes it difficult for Sterling to find a footing against a strengthening dollar. The current 1-hour GBPUSD trend is showing a 86% downward strength, supported by a weak RSI of 23.61 and Stochastic values in the oversold territory (K=13.42, D=15.29). This technical picture suggests that without a significant shift in UK economic fundamentals or a reversal in global risk sentiment, the path of least resistance for GBPUSD remains to the downside.
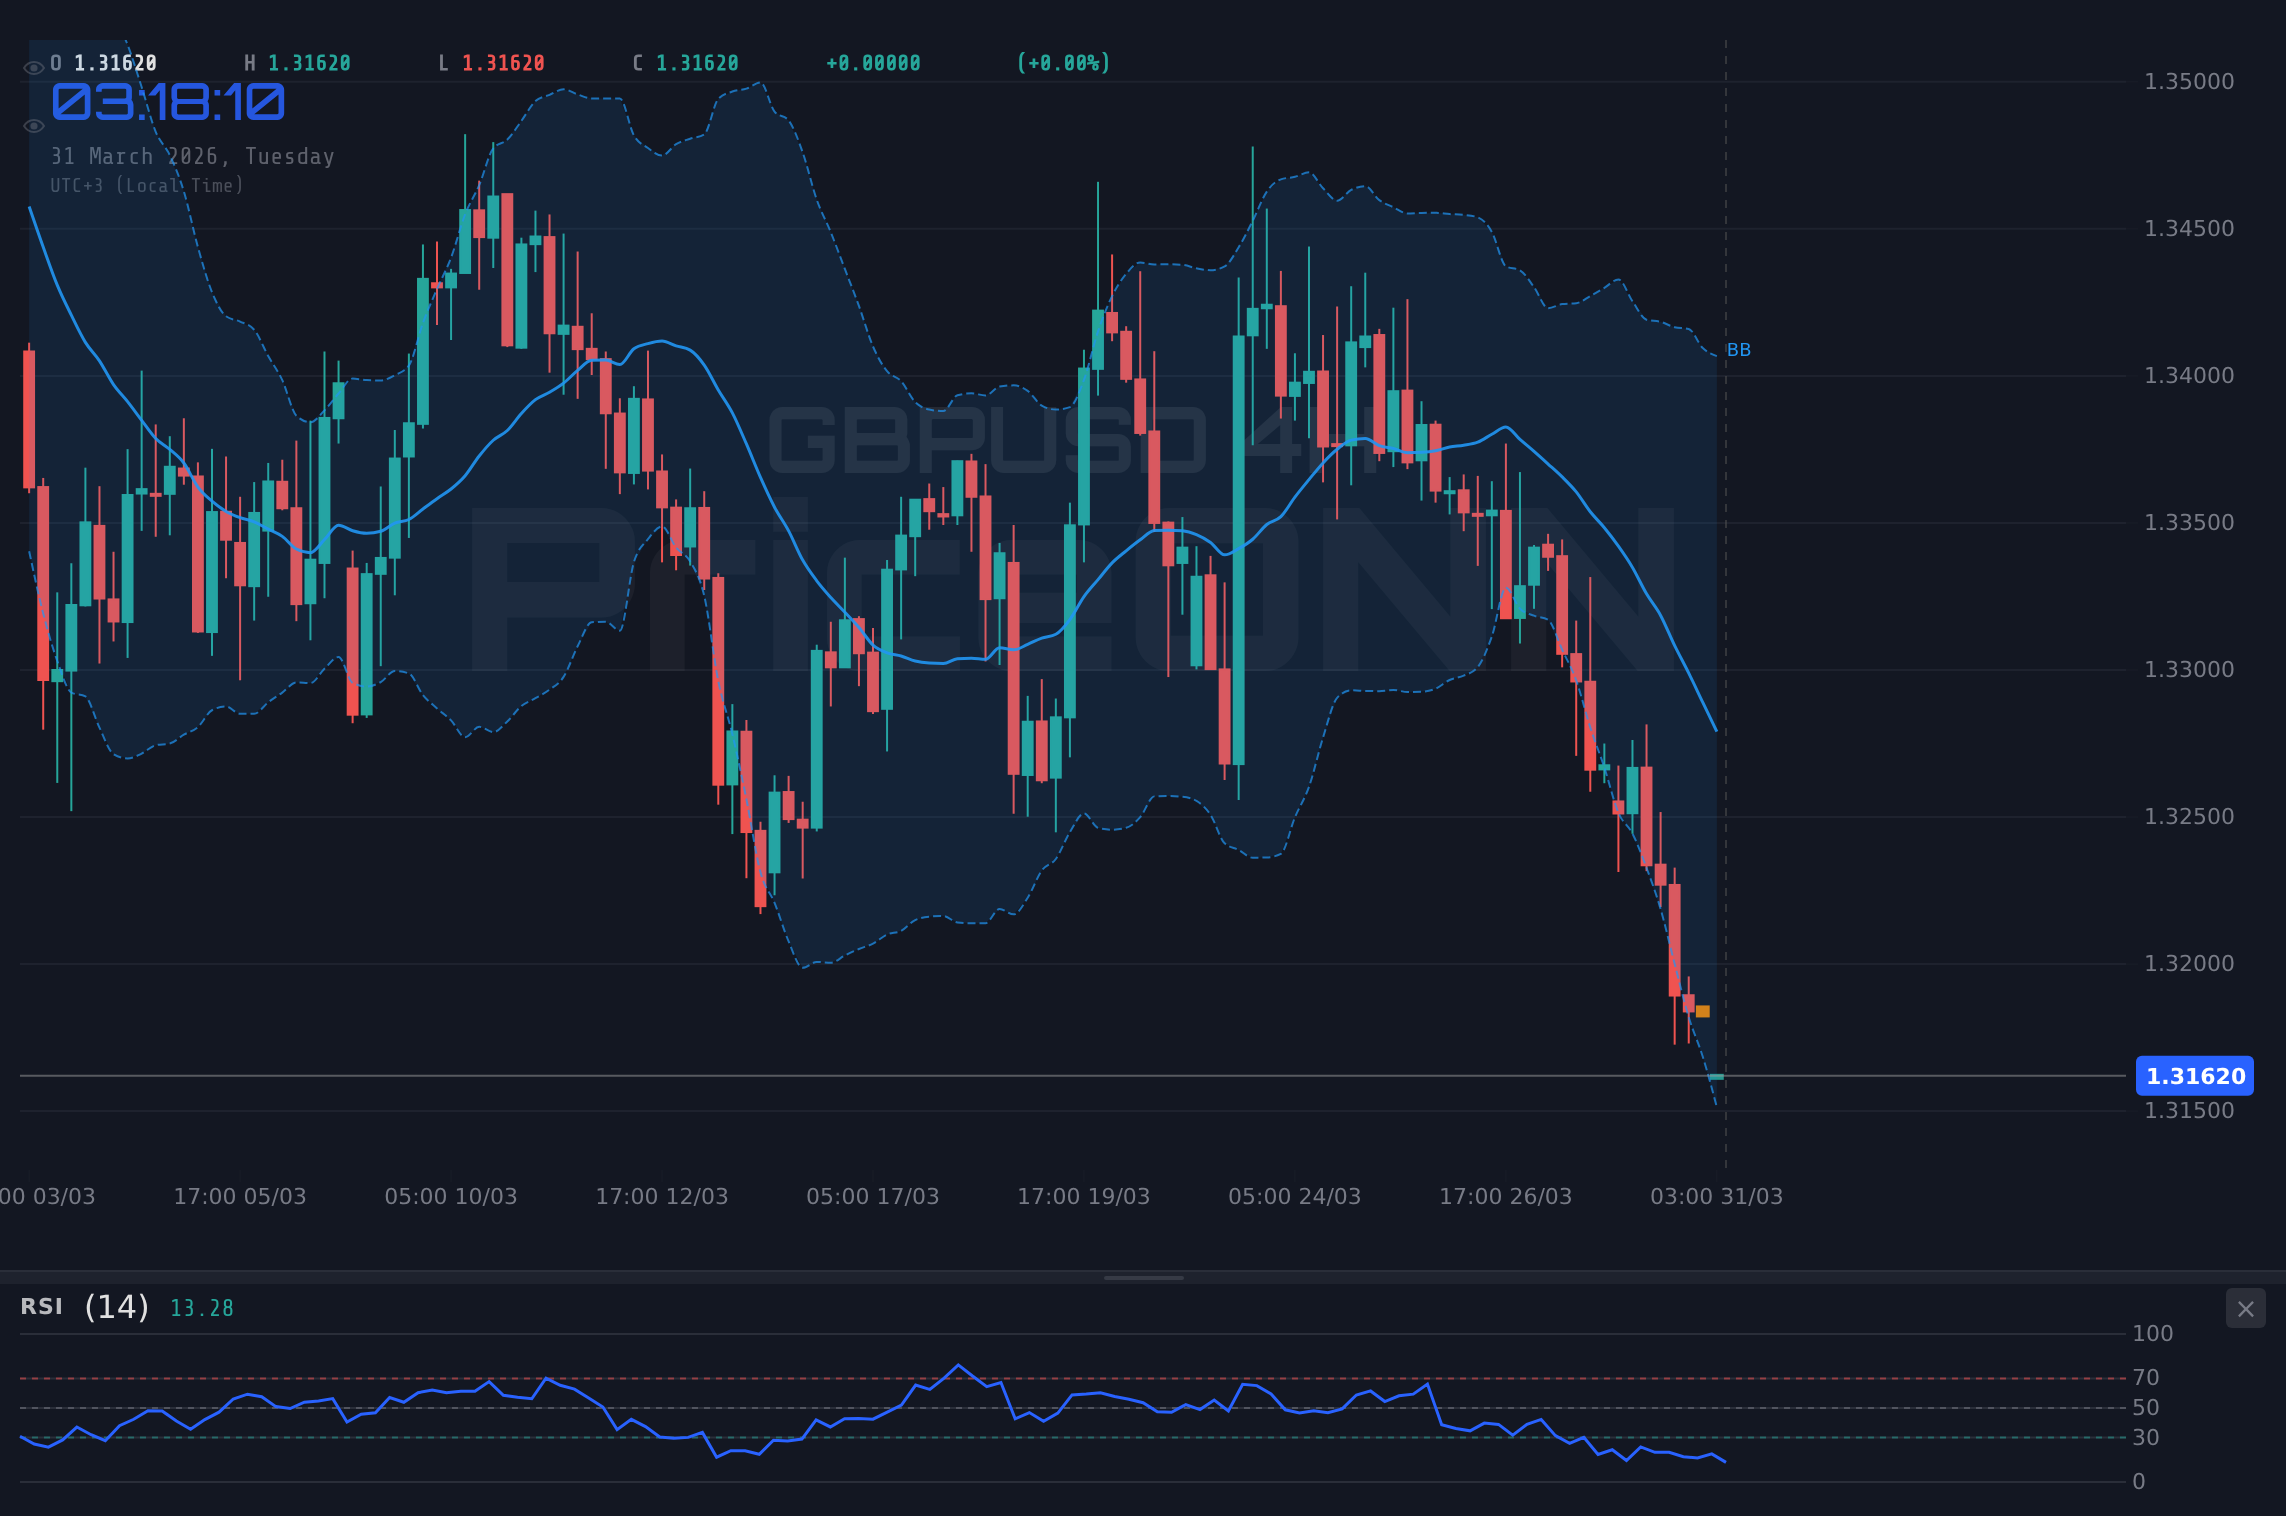
Technical Picture: The $1.32 Level Under Siege
From a technical standpoint, the $1.32 level for GBPUSD is more than just a number; it represents a battleground where bulls and bears are fiercely contesting control. The data shows that on the 1-hour chart, the ADX is 33.4, indicating a strong downtrend. However, the 4-hour chart presents a slightly different narrative with an ADX of 23.61, suggesting a moderating trend strength but still within a bearish context. The 1-day timeframe, however, reinforces the bearish outlook with an ADX of 32.3 for XAUUSD and 34.6 for EURUSD, highlighting the broader dollar strength. For GBPUSD, the daily trend strength is a formidable 96% downwards. Support levels on the 1-hour chart are found at 1.14565, 1.14543, and 1.14501, while resistance is seen at 1.14629, 1.14671, and 1.14693. These tight ranges on the hourly chart suggest consolidation before the next move, but the overarching trend on higher timeframes remains decidedly bearish.
The Role of Momentum and Divergence
Examining momentum indicators provides further insight into the GBPUSD's current predicament. On the 1-hour chart, MACD is showing negative momentum, with the histogram below the signal line, reinforcing the bearish sentiment. Stochastic is also showing mixed signals, with %K above %D, but both are in oversold territory, hinting at a potential short-term bounce. However, this is contradicted by the 4-hour chart where MACD also shows negative momentum, but the RSI (31.07) and Stochastic (K=16.55, D=19.74) are firmly in oversold territory, suggesting a potential for a snap-back rally. The daily chart's RSI at 37.14 and Stochastic (K=31.71, D=63.15) further complicates the picture, with the latter showing a potential for a bounce but %K still below %D. This divergence across timeframes highlights the current indecision and the importance of the $1.32 level as a pivot point. A sustained break below this level could trigger significant stop-loss orders, accelerating the decline towards the next support at $1.31637 on the 4-hour chart.
Examining Correlated Assets: Gold and Yields
The movements in gold (XAUUSD) and US Treasury yields offer additional context for GBPUSD's potential direction. Gold prices are currently around $4510.11, showing a neutral trend on the 1-hour chart (RSI 49.93) but a potential bearish signal on the daily (RSI 37.13). This mixed picture in gold, a traditional safe-haven asset, reflects the ongoing uncertainty. If geopolitical risks escalate further, gold could find support, which might indirectly benefit GBPUSD if it leads to broader dollar weakness. However, the current data suggests a lack of strong conviction in gold. Meanwhile, US Treasury yields remain a key driver for the dollar. While specific yield data isn't provided, the general expectation is that any indication of sustained inflation or hawkish Fed policy would support higher yields, thereby strengthening the dollar and weakening GBPUSD. The correlation between GBPUSD and the DXY (currently at 100.44) remains a dominant theme, suggesting that dollar strength will likely continue to cap Sterling's upside potential.
The Path Forward: Key Levels and Catalysts
Looking ahead, the $1.32 level remains the most critical immediate focus for GBPUSD. A decisive close below this psychological support on a higher timeframe (e.g., daily) would likely confirm the bearish trend and open the door for further declines towards the 4-hour support at $1.31637 and subsequently $1.3138. On the upside, a sustained break and hold above the hourly resistance at $1.14629 would be the first sign of a potential trend reversal. However, given the prevailing bearish sentiment, the strong dollar, and the mixed economic outlook for the UK, significant upside momentum would require a substantial shift in either Fed policy expectations or a de-escalation of geopolitical tensions. The upcoming economic calendar, particularly any high-impact data from the US or UK, will be crucial catalysts. Traders will be closely watching for any surprises that could alter the current narrative.
Upcoming Economic Events to Watch
The economic calendar provides critical junctures where the GBPUSD narrative could shift. While specific dates for some events are not detailed in the provided data, the general high-impact releases from the US and UK remain paramount. For the US, key inflation figures and employment data (like NFP) are always market movers. Any deviation from expectations could significantly impact Fed policy outlook and, consequently, the DXY and GBPUSD. Similarly, UK-specific data, such as retail sales, inflation (CPI), and manufacturing output, will be closely scrutinized. The Bank of England's stance, heavily influenced by this data, will directly affect Sterling's performance. The market's reaction to these events will determine whether GBPUSD can defend the $1.32 support or succumb to the prevailing bearish pressures.
Bearish Scenario: Support Breakdown
65% ProbabilityNeutral Scenario: Consolidation Range
25% ProbabilityBullish Scenario: Recovery Play
10% ProbabilityFrequently Asked Questions: GBPUSD Analysis
What happens if GBPUSD breaks below the $1.32 support level decisively?
A confirmed break below $1.32 on the daily chart would likely trigger further selling pressure, targeting the 4-hour support levels at $1.31637 and potentially $1.31380. This scenario is currently given a 65% probability due to prevailing bearish technicals and macro conditions.
Should I consider buying GBPUSD at current levels around $1.32 given the oversold Stochastic on the 4-hour chart?
While the 4-hour Stochastic is showing an oversold condition (K=16.55, D=19.74), the overall trend remains bearish with strong ADX values. A contrarian buy signal would require confirmation, such as a close above $1.3250 or a bullish divergence on higher timeframes, which is currently not evident. This is a low-probability bullish setup (10%).
Is the RSI at 37.14 on the daily chart a strong sell signal for GBPUSD right now?
An RSI of 37.14 on the daily chart indicates weakening momentum but is not yet in oversold territory (typically below 30). It suggests that while the selling pressure is significant, there is still room for the price to decline further before a potential bounce could occur. It reinforces the bearish bias without being an immediate sell trigger on its own.
How will the upcoming US inflation data potentially affect GBPUSD this week?
Higher-than-expected US inflation would likely strengthen the dollar (DXY) and put more pressure on GBPUSD, potentially pushing it below $1.32. Conversely, softer inflation could lead to dollar weakness and a relief rally for GBPUSD, possibly targeting resistance levels around $1.32841. The market's reaction will depend on how it influences Fed rate cut expectations.
| Indicator | Value | Signal | Interpretation |
|---|---|---|---|
| RSI (14) | 37.14 | Bearish | 37.14 suggests further downside possible. |
| MACD Histogram | -0.00538 | Bearish | Negative momentum continues. |
| Stochastic | K:31.71, D:63.15 | Bearish | %K < %D signals caution. |
| ADX | 34.6 | Strong Trend | 34.6 indicates a strong downtrend. |
| Bollinger | Middle Band | Below | Price is below the middle band. |
Track markets in real-time
AI-powered analysis, technical indicators and real-time price data.
Join Our Telegram Channel
Breaking market news, AI analysis and trading signals instantly.
Join Channel