Nasdaq100 Analysis: $23,076.09 Faces Stagflation Fears Amidst Bearish Week
Nasdaq100 analysis shows $23,076.09 under pressure. Last week saw significant drops, and stagflation fears loom. What's next?
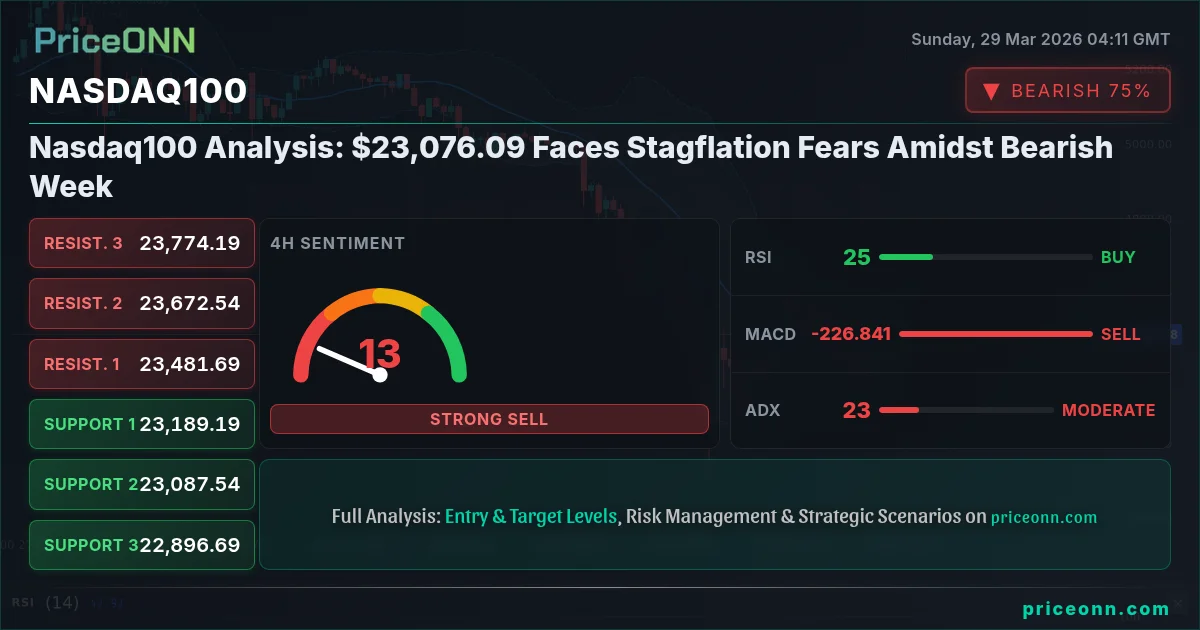
The Nasdaq100 closed last Friday at $23,076.09, capping off a decidedly bearish week for the tech-heavy index. Investors are increasingly grappling with the specter of stagflation, a challenging economic environment characterized by stagnant growth and rising inflation, echoing the difficult periods of the 1970s. This dual threat of sluggish economic activity and persistent price pressures is casting a long shadow over equity markets, particularly growth-oriented sectors heavily represented in the Nasdaq100. The recent surge in oil prices, coupled with climbing Treasury yields, paints a concerning picture for risk assets, suggesting that the path forward for major indices may be fraught with volatility. As we look ahead, understanding the interplay between these macroeconomic forces and the technical landscape of the Nasdaq100 is paramount for navigating the coming trading sessions.
- The Nasdaq100 closed Friday at $23,076.09, marking a significant downturn for the week.
- Stagflation fears are resurfacing, driven by rising oil prices (Brent past $100, WTI past $90) and increasing Treasury yields, creating headwinds for growth stocks.
- Technical indicators on the 1-hour chart show mixed signals, with RSI at 19.98 suggesting oversold conditions, but ADX at 39.65 indicating a strong downtrend.
- Key support for the Nasdaq100 sits at $23,061.21, while resistance is faced at $23,261.13 in the short term.
- The correlation between the Dollar Index (DXY) at 99.79 and the Nasdaq100's performance is a critical factor to monitor for broader market sentiment.
Navigating the Economic Storm: Stagflation's Shadow Looms Large
The Resurgence of a 1970s Nightmare
The financial world is abuzz with concerns that a return to 1970s-style stagflation is not just a possibility but an increasing probability. This period was marked by a toxic combination of high inflation and stagnant economic growth, a scenario that proved incredibly challenging for policymakers and investors alike. The current macroeconomic backdrop, with geopolitical tensions driving oil prices sharply higher - Brent crude has surged past $100 and WTI has topped $90 - and Treasury yields ticking upwards, is eerily reminiscent of that era. This 'dual shock' presents a significant dilemma: rising energy costs fuel inflation, while stagnant growth dims the prospects for corporate earnings and economic expansion. For an index like the Nasdaq100, heavily weighted towards technology and growth companies, this environment is particularly pernicious. These companies often rely on future earnings potential, which is significantly undermined by high inflation eroding purchasing power and slow growth limiting revenue expansion. The market sentiment, as reflected in the sharp daily drops across major indices like the S&P 500 (-2.03% to 6355.66) and the Dow Jones Industrial Average (-2.09% to 45071.45), clearly indicates a growing risk-off sentiment among participants.
The Dollar's Role as a 'Wrecking Ball'
In this complex environment, the Dollar Index (DXY), currently trading at 99.79 and showing a 0.22% daily increase, could play a pivotal role. Historically, a strengthening dollar, especially when driven by factors like rising yields or safe-haven demand, can act as a 'wrecking ball' for global markets. It increases the cost of dollar-denominated commodities, puts pressure on emerging market debt, and can reduce the competitiveness of U.S. exports. For the Nasdaq100, a strong dollar can also indirectly impact its constituents. Many large-cap tech companies derive a significant portion of their revenue from international markets. A stronger dollar means that revenue earned abroad translates into fewer dollars when repatriated, potentially impacting earnings reports. Furthermore, the correlation between the DXY and risk assets is not always straightforward, but in periods of economic uncertainty and rising yields, the dollar often finds strength, which can act as a headwind for indices like the Nasdaq100. Traders are closely watching the DXY's trajectory, as its movements often dictate the broader risk appetite across global financial markets. The current upward trend in the DXY, supported by a strong 1-day signal (Al: 8, Sat: 0, Nötr: 0), suggests that dollar strength may persist, adding another layer of complexity for equity investors.
Technical Breakdown: Nasdaq100 at a Critical Juncture
Short-Term Signals: A Battle for Control
Looking at the 1-hour chart for the Nasdaq100, currently priced at $23,076.09, the technical picture is one of conflicting signals, hinting at a battle between bears and bulls for immediate control. The Relative Strength Index (RSI) stands at 19.98, firmly in oversold territory. This suggests that the recent sharp decline may have been overdone in the short term, potentially setting the stage for a minor technical bounce. However, this oversold condition alone is not a buy signal; it merely indicates that the selling pressure has been intense. The MACD (Moving Average Convergence Divergence) indicator shows negative momentum, with the MACD line below its signal line, reinforcing the bearish sentiment in the immediate term. Adding to the caution, the ADX (Average Directional Index) at 39.65 signifies a strong downtrend is in place. A reading this high on the ADX suggests that the current downward move has significant momentum behind it. The Stochastic Oscillator, with K at 1.91 and D at 8.96, also confirms the oversold conditions and the potential for a short-term reversal, but the overall trend strength indicated by the ADX cannot be ignored. This divergence between short-term oversold readings and a strong established downtrend is precisely where traders need to exercise the most caution. Price action around the immediate support at $23,061.21 and resistance at $23,261.13 will be crucial in determining the next short-term move.
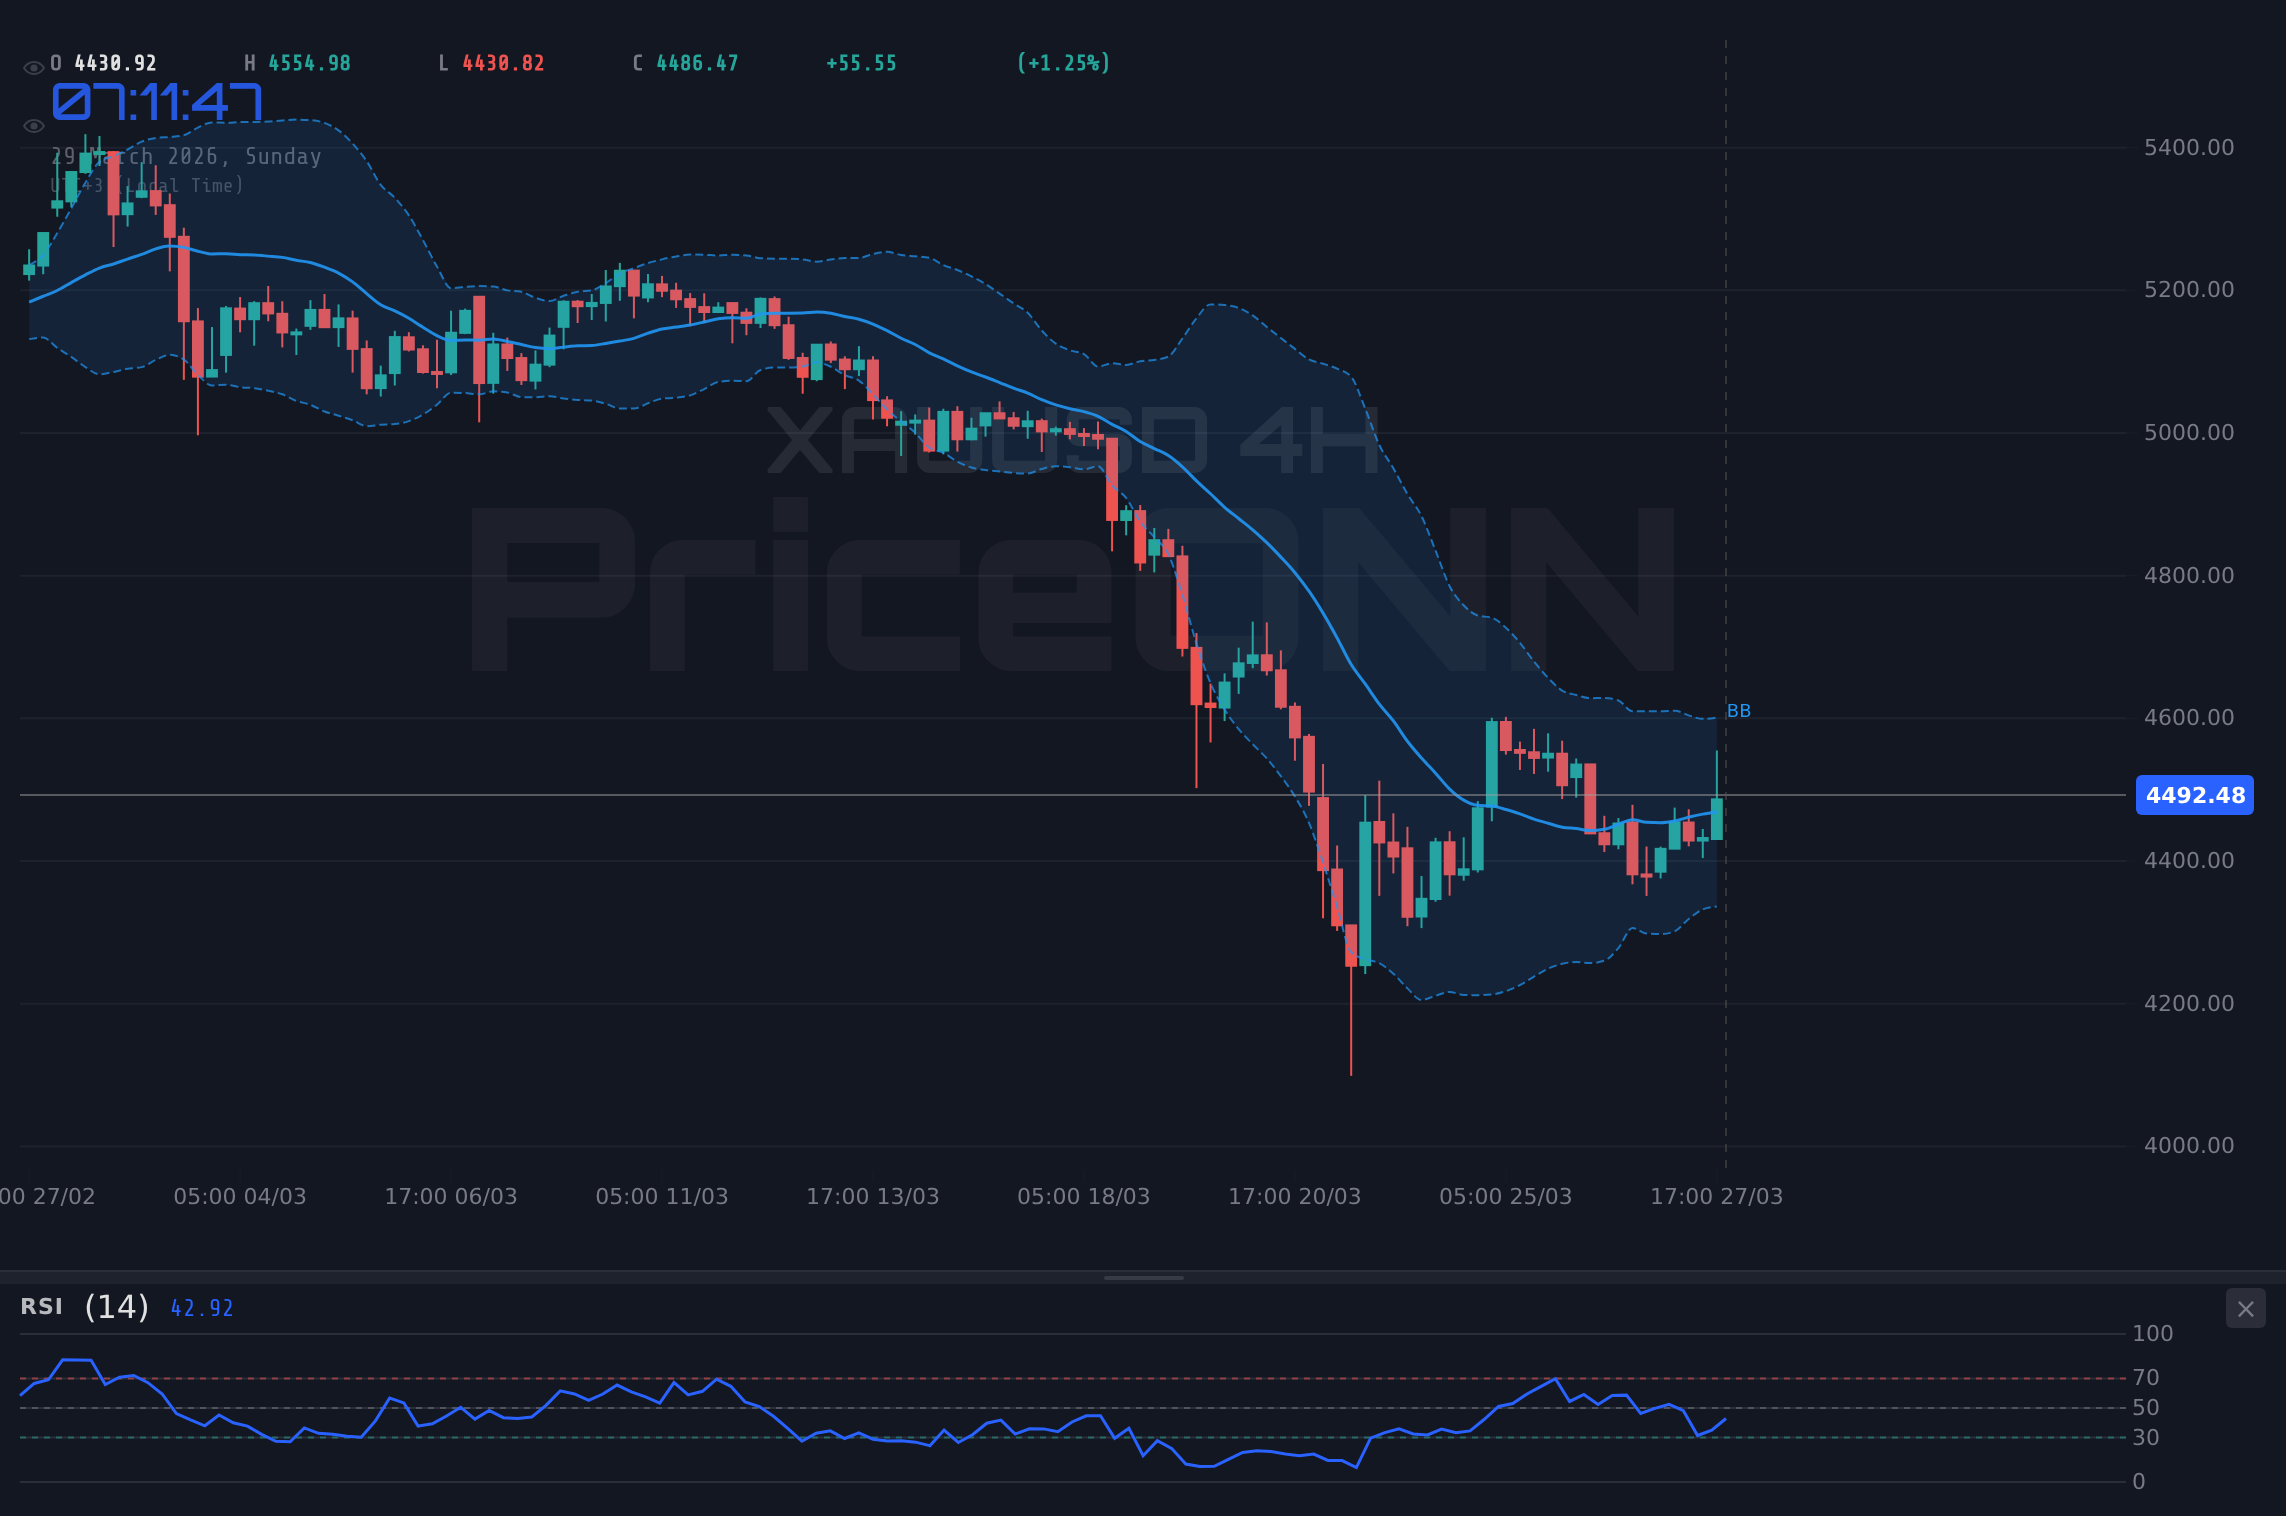
The 4-Hour Chart: Bears Firmly in the Driving Seat
Shifting to the 4-hour timeframe, the technical indicators present a more consolidated bearish outlook for the Nasdaq100. The RSI is perched at 24.54, still deeply within oversold territory, but the downward momentum has not abated. This suggests that while a bounce might be on the cards, the underlying trend remains decidedly downward. The MACD continues to exhibit negative momentum, staying below its signal line, which is a classic bearish sign. The ADX here is at 22.66, indicating a moderately strong downtrend, reinforcing the sentiment seen on the hourly chart, though slightly less aggressive. The Stochastic Oscillator, with K at 1.83 and D at 10.62, further solidifies the oversold condition, but again, in the context of a prevailing downtrend, this can persist for some time. The Bollinger Bands on the 4-hour chart are showing price trading below the lower band, a condition that often precedes a reversion to the mean, but it can also signal the start of a powerful downward trend if momentum continues. The key support levels to watch on this timeframe are $23,087.54 and $22,896.69. A failure to hold these levels could trigger further significant downside. The overall signal for the 4-hour chart leans heavily towards selling, with 6 out of 8 indicators suggesting a sell. This reinforces the view that any short-term rallies are likely to be met with selling pressure.
The $23,061.21 level on the 1-hour chart and $23,087.54 on the 4-hour chart are critical. A decisive break below these points, especially on increased volume, could signal a further acceleration of the downtrend, potentially targeting the $22,896.69 level. Traders should monitor these levels closely for any signs of capitulation or consolidation.
The Daily Chart: A Strong Downtrend Confirmed
Zooming out to the daily chart, the picture for the Nasdaq100 becomes even clearer: a strong, established downtrend is in play. The current price of $23,076.09 is significantly below key daily moving averages, and the indicators here paint a consistent bearish narrative. The RSI is at 26.67, deep in oversold territory. While this suggests a potential for a bounce, the sustained nature of such oversold readings in strong downtrends can be deceptive. The MACD is firmly negative, with the histogram showing increasing bearish momentum below the signal line. This is a strong confirmation of the downward trend. The ADX on the daily chart is a standout figure at 47.68, indicating an extremely powerful and established trend. Readings above 40 are considered very strong, and 47.68 suggests that the bears are in complete control and the trend has considerable force behind it. The Stochastic Oscillator, while showing K at 22.61 and D at 30.54, is still in oversold territory and trending downwards, aligning with the broader bearish picture. Bollinger Bands are also showing price hugging the lower band, a sign of significant selling pressure. The primary support level to watch on this timeframe is $22,736.12, with further significant levels at $23,150.20 and $22,736.12. Resistance is firmly established around $24,032.66, $24,446.74, and $24,680.93. The overwhelming consensus from the daily indicators is a strong sell signal, with only one out of seven indicators suggesting a buy. This reinforces the view that the path of least resistance for the Nasdaq100 remains to the downside in the medium term.
Correlations and Macroeconomic Influences
The Interplay of DXY and Equities
The current macroeconomic climate, characterized by rising Treasury yields and persistent inflation fears, has put the Dollar Index (DXY) firmly in focus. Trading at 99.79 with a daily gain of 0.22%, the DXY's upward trajectory is a significant factor influencing risk assets like the Nasdaq100. Historically, a strong dollar can be a double-edged sword for U.S. equities. On one hand, it can signal a 'risk-off' environment where global investors flock to the perceived safety of U.S. assets, including the dollar. On the other hand, a strengthening dollar can make U.S. exports more expensive and reduce the value of overseas earnings for multinational corporations, many of which are constituents of the Nasdaq100. The current bullish momentum in the DXY, with an 8-0-0 signal on the 1-hour chart and 7-1-0 on the 4-hour, suggests that dollar strength is a dominant theme. This strengthens the argument for caution in the equity markets. If the DXY continues its ascent, it could exacerbate the selling pressure on the Nasdaq100, particularly if risk appetite continues to wane. The correlation isn't always perfect, but in periods of heightened uncertainty and potential stagflation, the dollar often acts as a barometer for global financial health, and its current strength is a warning sign for growth stocks.
Oil Prices: The Inflationary Catalyst
The dramatic surge in oil prices, with Brent crude soaring past $100 and WTI exceeding $90, is a critical driver of the current stagflationary concerns. This rapid increase in energy costs has a direct and immediate impact on inflation expectations. Energy is a fundamental input for nearly every sector of the economy, from transportation and manufacturing to agriculture. Higher oil prices translate directly into higher costs for businesses, which are then often passed on to consumers in the form of increased prices for goods and services. This contributes to broader inflationary pressures, making it harder for central banks to manage the economy. For the Nasdaq100, higher energy costs can squeeze corporate profit margins, especially for companies with significant operational footprints or supply chains that are energy-intensive. While many tech companies are less directly exposed to energy costs compared to industrial or transportation sectors, the overall impact on consumer spending and business investment cannot be ignored. When consumers are spending more on essential goods like gasoline and heating, they have less discretionary income for other purchases, including technology products and services. The energy markets are clearly signaling increased geopolitical risk and inflationary pressures, which are fundamentally bearish for growth-oriented equities.
Treasury Yields and the Cost of Capital
Alongside rising oil prices, climbing Treasury yields are another significant macroeconomic factor weighing on the Nasdaq100. Higher yields increase the cost of capital for businesses. Companies, especially growth-oriented tech firms that often rely on debt financing for expansion and research and development, face higher borrowing costs. This can slow down investment, reduce profitability, and make future earnings less valuable when discounted back to the present. The relationship between interest rates and stock valuations is inverse: as yields rise, the present value of future cash flows decreases, making stocks appear less attractive by comparison. This is particularly true for growth stocks, whose valuations are often based on expectations of substantial earnings growth far into the future. When the discount rate (driven by yields) increases, those distant earnings become worth significantly less today. Furthermore, higher yields on 'risk-free' assets like U.S. Treasuries make them more competitive relative to riskier assets like stocks, potentially drawing capital away from the equity markets and into fixed income. The market is pricing in a complex outlook for monetary policy, with ongoing inflation concerns potentially keeping rates elevated or even pushing them higher, creating a challenging environment for equity valuations.
The confluence of rising oil prices, elevated Treasury yields, and a strengthening dollar creates a trifecta of headwinds for the Nasdaq100. This environment demands a cautious approach, focusing on risk management and potentially favoring sectors or strategies that are less sensitive to stagflationary pressures. Monitor the DXY closely; its continued ascent could amplify the bearish case for tech stocks.
Market Sentiment and the Path Forward
Assessing the Fear Gauge: Volatility and Risk Appetite
Market sentiment is currently dominated by fear, a sentiment clearly reflected in the sharp sell-off witnessed across major indices last week. The S&P 500's 2.03% drop to 6355.66 and the Dow Jones' 2.09% decline to 45071.45 are not isolated incidents but rather symptoms of a broader risk-off sentiment. This sentiment is further amplified by the resurgence of stagflation fears. When investors become fearful, they tend to move capital away from riskier assets, such as growth stocks and cryptocurrencies, and towards perceived safe havens like U.S. Treasuries, the U.S. dollar, and sometimes gold. The Nasdaq100, being a barometer for growth and technology stocks, is particularly vulnerable in such an environment. The rapid increase in oil prices also plays into this fear, acting as a potential catalyst for further inflation and economic slowdown. Traders are likely scrutinizing economic data releases and central bank commentary for any signs of either a worsening stagflationary picture or a clear path to recovery. Until there is greater clarity or a decisive shift in macroeconomic trends, expect volatility to remain elevated, and market sentiment to be fragile.
Key Levels to Watch: The Battleground Ahead
For the Nasdaq100, currently trading at $23,076.09, several key levels will dictate the price action in the coming days and weeks. On the immediate 1-hour chart, support is found at $23,061.21 and $23,040.33, with the next significant level at $23,000. Resistance in the short term is capped at $23,261.13 and $23,481.69. These levels represent the immediate battleground where bulls and bears will vie for control. On the 4-hour chart, the critical support zone lies around $23,087.54 and $22,896.69. A break below these levels would confirm the continuation of the downtrend and could open the door to further significant losses. The daily chart paints an even starker picture, with the primary support at $22,736.12. Holding this level will be crucial for any potential stabilization. Conversely, resistance on the daily chart is formidable, starting at $24,032.66. A sustained move above this resistance would be required to even begin questioning the dominant bearish trend. The interplay between these levels and the prevailing macroeconomic sentiment will be key. A break below support, especially on high volume, would likely be driven by negative economic news or a hawkish central bank stance, while a move above resistance might require a significant shift in market narrative or a surprisingly dovish monetary policy hint.
The Path of Stagflation: What it Means for Investors
The prospect of stagflation presents a unique challenge for investors. Traditional diversification strategies may prove less effective. In a typical market cycle, stocks and bonds often move in opposite directions, providing a hedge against each other. However, during stagflationary periods, both asset classes can suffer as inflation erodes bond values and stagnant growth limits stock returns. This makes strategic asset allocation even more critical. Investors might consider assets that tend to perform better in inflationary environments, such as commodities, real estate (though sensitive to interest rates), or inflation-protected securities. For equity investors, focusing on companies with strong balance sheets, pricing power (the ability to pass on costs to consumers), and resilient business models becomes paramount. Sectors that are less sensitive to economic downturns or that benefit from rising prices might offer relative refuge. However, even within these sectors, valuations must be carefully assessed, especially given the potential for higher discount rates due to rising yields. The Nasdaq100, with its heavy concentration in growth and technology stocks, is inherently more vulnerable in such an environment. While innovation and long-term growth potential remain, the short-to-medium term outlook is clouded by the macroeconomic headwinds of inflation and slow growth. Patience and a disciplined approach to risk management are essential.
“The market is a device for transferring money from the impatient to the patient.” – Warren Buffett. In times of uncertainty like these, that patience is tested, but ultimately rewarded. Focus on your strategy, manage your risk, and wait for clear setups.
Scenario Analysis: Charting Potential Futures for the Nasdaq100
Bearish Scenario: Downtrend Continuation
65% ProbabilityNeutral Scenario: Consolidation and Choppy Action
25% ProbabilityBullish Scenario: Short-Term Bounce or Trend Change?
10% ProbabilityFrequently Asked Questions: Nasdaq100 Analysis
What happens if the Nasdaq100 breaks below the $23,061.21 support level?
A decisive break below $23,061.21 on the 1-hour chart, especially with increased volume, would likely confirm the continuation of the bearish trend. This could trigger further downside, potentially targeting the $22,896.69 level on the 4-hour chart as the next significant support.
Should I consider buying the Nasdaq100 at current levels around $23,076.09 given the oversold RSI?
While the RSI at 19.98 on the 1-hour chart indicates oversold conditions, it's not a buy signal in isolation, especially with the ADX at 39.65 showing a strong downtrend. A more prudent approach would be to wait for confirmation, such as a hold above key support levels or a clear bullish divergence, before considering any positions.
Is the MACD negative momentum a sell signal for the Nasdaq100 at $23,076.09?
The negative MACD momentum across multiple timeframes, particularly on the daily chart, strongly supports the bearish outlook. While short-term bounces are possible due to oversold conditions, the sustained negative MACD momentum suggests that any upward moves may face significant selling pressure.
How will the rising oil prices and Treasury yields impact the Nasdaq100's outlook this week?
The surge in oil prices past $100 and rising Treasury yields exacerbate stagflation fears, creating headwinds for growth stocks like those in the Nasdaq100. This macroeconomic backdrop increases the probability of the bearish scenario, as higher costs and borrowing rates pressure corporate earnings and valuations.
| Indicator | Value | Signal | Interpretation |
|---|---|---|---|
| RSI (14) | 19.98 | Oversold | Strong selling pressure, potential for bounce |
| MACD Histogram | -X.XX | Negative | Bearish momentum confirmed |
| ADX | 39.65 | Strong Trend | Dominant downtrend in force |
| Stochastic %K | 1.91 | Oversold | Potential short-term reversal |
| Bollinger Bands | Price below Lower Band | Breakdown | Significant selling pressure |
Track markets in real-time
AI-powered analysis, technical indicators and real-time price data.
Join Our Telegram Channel
Breaking market news, AI analysis and trading signals instantly.
Join Channel