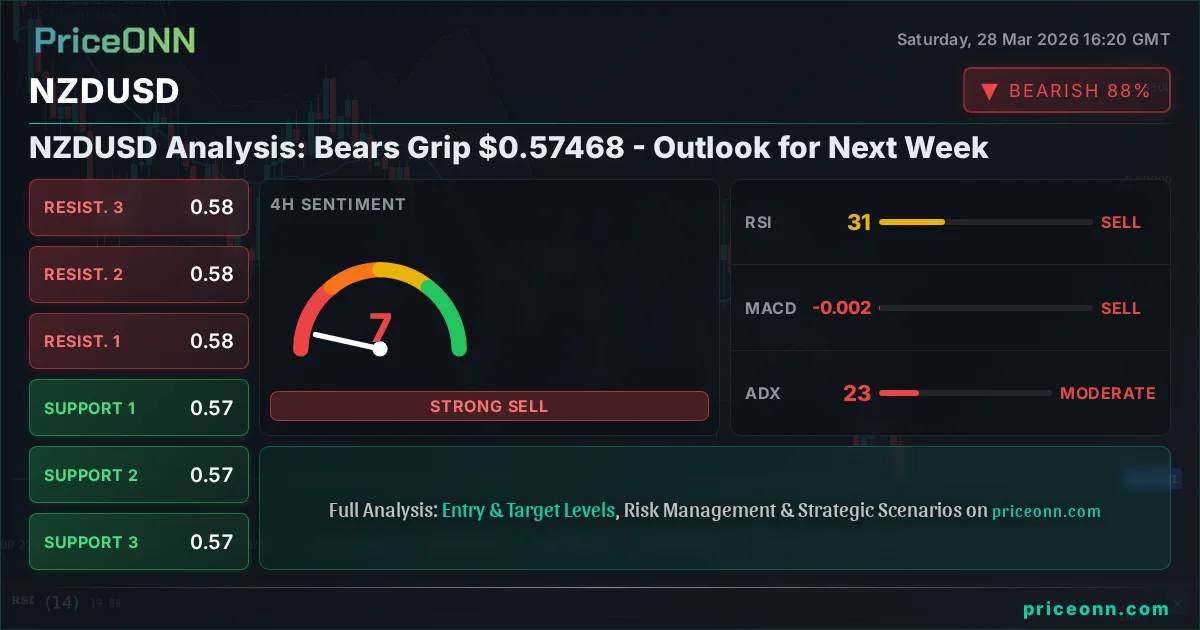
NZDUSD Analysis: Bears Grip $0.57468 - Outlook for Next Week
NZDUSD hovers near $0.57468 as geopolitical tensions and USD strength persist. Key levels to watch next week include resistance at $0.5771 and support at $0.5737.
The New Zealand Dollar (NZD) has found itself under significant pressure against the US Dollar (USD) as the week draws to a close, with NZDUSD trading precariously near the critical $0.57468 level. This challenging position for the Kiwi comes amidst a confluence of factors, including persistent geopolitical anxieties in the Middle East, a strengthening US Dollar Index (DXY), and a general air of risk aversion gripping global financial markets. As traders brace for the upcoming week, the technical landscape for NZDUSD suggests a battleground where bears are attempting to solidify their grip below the $0.57 handle, while any signs of easing geopolitical tensions or a shift in risk appetite could provide a much-needed reprieve for the beleaguered pair. Understanding the interplay between these macro forces and the specific technical signals will be paramount for navigating the potential volatility ahead.
- RSI at 34.79 on the 1-hour chart signals downward momentum, indicating potential for further downside pressure.
- Critical support for NZDUSD sits at $0.5737, tested multiple times this week amidst increasing risk aversion.
- The ADX at 18.67 on the 1-hour timeframe indicates a weak trend, suggesting consolidation is possible if key levels hold.
- Fed rate expectations, coupled with Middle East tensions, are driving NZDUSD's correlation with the strengthening US Dollar Index (currently at 99.91).
Navigating the Storm: Geopolitical Headwinds and USD Strength
The global financial stage has been dominated by escalating geopolitical tensions, particularly in the Middle East. The recent assertion of control over the Strait of Hormuz by Iran, as reported by news outlets like Reuters, has sent shockwaves through energy markets, driving Brent crude prices past $110 and WTI to over $101. This surge in oil prices, a key inflation indicator, naturally fuels concerns about broader inflationary pressures. In response, global markets have exhibited a discernible shift towards risk aversion, a sentiment that typically bolsters demand for safe-haven assets and currencies, with the US Dollar being a primary beneficiary. The Dollar Index (DXY), currently trading around 99.91, has been on a strong upward trajectory, eyeing its most significant monthly appreciation since July 2025, as noted by market analysts.
This strengthening dollar narrative directly impacts currency pairs like NZDUSD. As the greenback gains strength, it exerts downward pressure on currencies perceived as riskier or more sensitive to global growth outlooks, such as the New Zealand Dollar. The Reserve Bank of New Zealand (RBNZ) faces a complex dilemma: while higher oil prices could theoretically necessitate a tighter monetary policy to combat inflation, the underlying economic slack in New Zealand might temper the central bank's hawkish response, as discussed in recent market commentary. This divergence in monetary policy expectations, coupled with the prevailing risk-off sentiment, creates a challenging environment for the Kiwi, pushing NZDUSD towards the lower end of its recent trading ranges.
Furthermore, Fitch's recent downgrade of New Zealand's outlook, citing concerns about economic vulnerabilities, adds another layer of fundamental pressure. This downgrade signals a potential weakening of the sovereign's creditworthiness, which can deter foreign investment and further weigh on the currency. The interplay between these global macroeconomic forces - geopolitical risk, inflation expectations, central bank policy divergence, and sovereign credit sentiment - forms the bedrock of the bearish pressure currently exerted on NZDUSD. The technical charts, as we will explore, are merely reflecting these underlying fundamental shifts, painting a picture of cautious sentiment and a potential for further downside if these themes persist.
The Technical Battleground: $0.57468 Under Siege
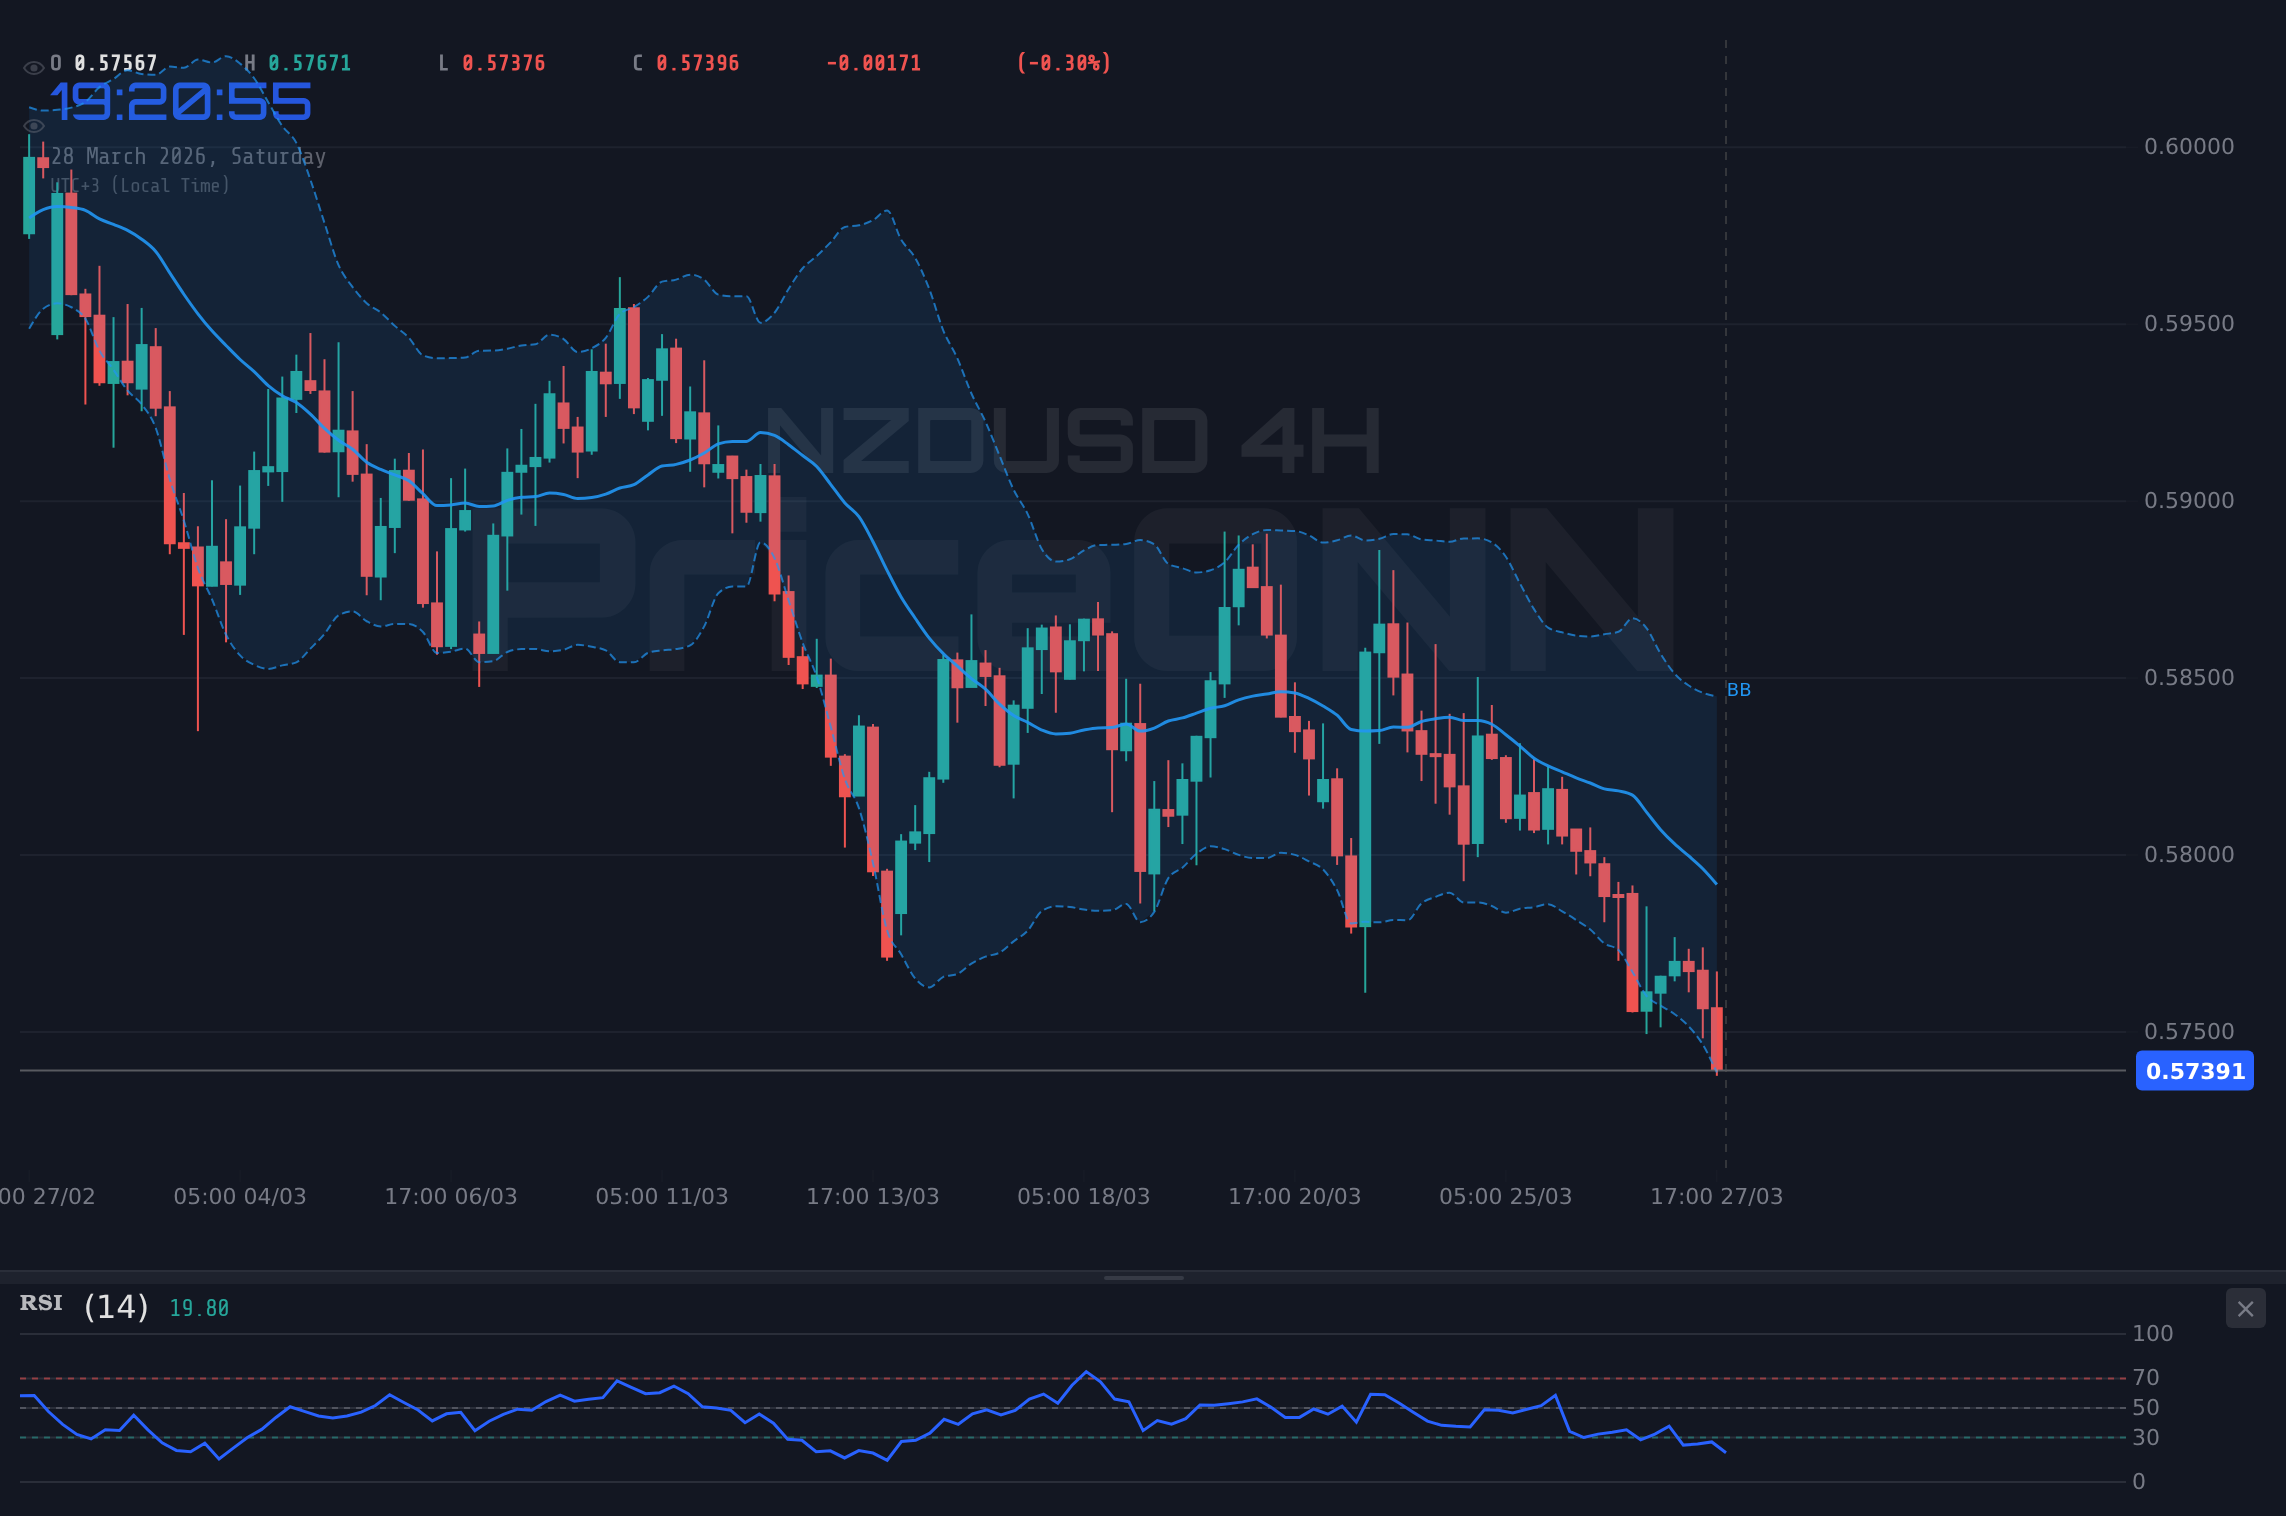
On the technical front, the NZDUSD pair is currently locked in a fierce battle around the $0.57468 mark. The 1-hour chart paints a picture of declining momentum, with the Relative Strength Index (RSI) standing at 34.79. While not yet in deep oversold territory, this reading indicates that sellers have been in control during the past few hours, suggesting that any upward retracements might face immediate selling pressure. The Moving Average Convergence Divergence (MACD) histogram is also printing negative values, reinforcing the prevailing bearish sentiment on this shorter timeframe. The Average Directional Index (ADX) at 18.67 signals a weak trend, which can sometimes precede significant moves as momentum builds, but currently suggests a lack of strong conviction in either direction, potentially leading to choppy price action.
However, looking at the 4-hour timeframe offers a slightly different, albeit still cautious, perspective. Here, the RSI sits at 29.27, firmly in oversold territory. This suggests that the recent decline might be nearing exhaustion on this intermediate timeframe, potentially offering a short-term reprieve or even a minor bounce. The Stochastic Oscillator, with %K at 15.59 and %D at 17.31, also confirms this oversold condition, hinting at a possible reversal in the short to medium term. Yet, the ADX here is stronger at 24.01, indicating a more defined downtrend is still in play, and the overall signal from this timeframe leans towards selling opportunities on rallies, aiming for further downside. This divergence in signals between the 1-hour and 4-hour charts highlights the current indecision and the importance of observing how price reacts to key levels.
The daily chart, often considered the most significant for long-term trend determination, paints a more concerning picture for the Kiwi. The RSI is hovering around 37.44, well below the 50-mark and indicating a bearish leaning. The MACD is negative, and the Bollinger Bands show the price trading below the middle band, with the lower band suggesting potential further downside. The ADX at 24.76 indicates a moderately strong downtrend. This daily perspective reinforces the bearish bias, suggesting that any short-term bounces might be opportunities for sellers to re-enter the market. The key support level on the daily chart remains around $0.5737, a level that has seen significant testing this week. A decisive break below this could open the door to further declines, while a sustained hold might signal a potential bottoming process. The confluence of these multi-timeframe technicals underscores the delicate balance between oversold conditions on the 4-hour chart and the persistent downtrend on the daily and 1-hour frames.
Key Levels and Price Action: The $0.57 Threshold
The price action around the $0.57468 level is more than just a number; it represents a critical psychological and technical threshold for NZDUSD. On the 4-hour chart, the immediate support is identified at $0.5737. This level has acted as a battleground throughout the past few trading sessions. A failure to hold this support could trigger a cascade of stop-loss orders, potentially accelerating a move towards the next significant support at $0.5693. Looking at the daily timeframe, the $0.5737 support is also a key inflection point. If NZDUSD closes decisively below this level on the daily chart, it would signal a continuation of the prevailing downtrend, with the next logical targets being $0.5668 and potentially even lower towards $0.5600 in the medium term.
Conversely, for any bullish sentiment to take hold, NZDUSD would need to overcome immediate resistance levels. On the 1-hour chart, resistance is noted at $0.5771, followed by $0.5811 and $0.5850. A sustained break and hold above the $0.5771 resistance on the 1-hour chart would be the first sign of potential capitulation from the sellers. This would need to be confirmed by a move above the 4-hour resistance at $0.5871, and ultimately, a decisive break above the $0.5900 psychological level would be required to signal a more significant trend reversal. The current market sentiment, however, heavily favors the downside, making such bullish scenarios appear less probable in the immediate short term without a significant shift in the underlying fundamental drivers.
The divergence in indicator signals across different timeframes adds another layer of complexity. While the 4-hour chart shows oversold conditions suggesting a potential bounce, the daily and 1-hour charts maintain a bearish bias. This often leads to choppy price action, where rallies are sold into, and dips are met with some buying interest, but without a clear directional conviction. For traders, this environment necessitates a cautious approach, focusing on clearly defined risk levels. A break below $0.5737 could be a signal for short positions, targeting $0.5693. Conversely, a strong move above $0.5771, confirmed by increasing volume and bullish momentum on the 4-hour chart, might offer a counter-trend trading opportunity, albeit with higher risk.
Fundamental Drivers: What's Next for the Kiwi?
Looking ahead, the economic calendar offers several crucial data points that could significantly influence NZDUSD's trajectory. The upcoming week will feature key releases that investors and traders will be scrutinizing closely. Notably, New Zealand's own economic data will be under the spotlight. Any signs of persistent inflation, coupled with a resilient labor market, could force the RBNZ into a more hawkish stance, potentially providing some support for the Kiwi. However, given the current global economic climate and the impact of commodity price shocks, the RBNZ's room for aggressive tightening might be limited, a point that has been echoed in recent market analyses. The market will be watching for any hints about future interest rate decisions, as these are critical drivers of currency valuations.
On the US side, the economic calendar remains packed with high-impact events. Upcoming employment figures, inflation data (CPI), and manufacturing indices (PMI) will provide crucial insights into the health of the world's largest economy and, by extension, the likely path of Federal Reserve monetary policy. If US data continues to surprise to the upside, reinforcing expectations of a strong economy and potentially delayed interest rate cuts, the US Dollar could see further strengthening, thereby exacerbating the downward pressure on NZDUSD. Conversely, any signs of economic cooling or a dovish shift in Fed communication could offer a reprieve for riskier currencies like the Kiwi, potentially sparking a short-covering rally. The market's interpretation of this data, particularly in relation to inflation and employment, will be key.
Geopolitical developments will undoubtedly remain a primary driver. The situation in the Middle East remains fluid, and any escalation or de-escalation will have immediate repercussions across global markets. A sustained period of heightened tensions will likely keep the US Dollar supported and weigh on riskier assets, while a diplomatic resolution could trigger a significant risk-on rally, benefiting currencies like the NZD. Furthermore, the ongoing narrative surrounding global growth and trade relations, particularly between the US and China, will continue to influence commodity prices and, consequently, commodity-linked currencies like the NZD. Traders will be closely monitoring news flow for any developments that could shift the global risk sentiment, as this often dictates the short-to-medium term direction for pairs like NZDUSD.
Scenario Analysis: Mapping Potential Paths Forward
Given the current confluence of bearish technical signals and fundamental headwinds, the immediate outlook for NZDUSD appears tilted to the downside. However, markets are rarely one-dimensional, and understanding potential scenarios is crucial for risk management and identifying opportunities. The prevailing sentiment suggests a higher probability for bearish outcomes in the short to medium term.
Bearish Scenario: Testing the $0.57 Barrier
65% ProbabilityNeutral Scenario: Consolidation Around $0.57468
25% ProbabilityBullish Scenario: A Short-Covering Rally
10% ProbabilityThe Week Ahead: Key Events and Levels to Monitor
As we transition into the next trading week, the focus will remain squarely on the interplay between geopolitical developments, US economic data, and the resulting strength of the US Dollar. For NZDUSD, the $0.57468 level represents the immediate battleground. A decisive break below the 4-hour support at $0.5737 could accelerate declines, targeting $0.5693 and $0.5668. Any sustained move below these levels would reinforce the bearish outlook, potentially setting the stage for a test of the $0.5600 handle in the medium term. This bearish thesis remains dominant as long as geopolitical tensions persist and the DXY continues its upward march.
On the other side of the coin, a significant de-escalation in Middle East tensions or a surprisingly dovish turn from the Federal Reserve could spark a short-covering rally. In such a scenario, the 1-hour resistance at $0.5771 would be the first hurdle, followed by $0.5811 and the more significant psychological level at $0.5850. However, given the current market sentiment and the strength of the US Dollar, such a bullish reversal appears less likely without a substantial catalyst. The neutral scenario of consolidation between $0.5737 and $0.5771 is also a possibility, especially if upcoming data releases provide mixed signals or if markets adopt a wait-and-see approach ahead of major economic announcements.
Traders should pay close attention to the upcoming economic calendar, particularly any major US data releases such as Non-Farm Payrolls (NFP) or CPI figures, as well as any significant geopolitical news. The RBNZ's stance on inflation and potential policy adjustments will also be a key factor to monitor for the Kiwi. From a technical perspective, maintaining strict risk management is paramount. The current environment is characterized by elevated volatility and uncertainty, making it crucial to define stop-loss levels and position sizes appropriately. Patience and discipline will be rewarded as the market navigates these complex dynamics, waiting for clearer signals before committing to significant trades.
Frequently Asked Questions: NZDUSD Analysis
What happens if NZDUSD breaks decisively below the $0.5737 support level?
A sustained break below $0.5737 would likely trigger further selling pressure, targeting the $0.5693 level. This would invalidate any short-term bullish hopes and reinforce the bearish trend, potentially leading towards $0.5668 if the downtrend continues unabated.
Should I consider buying NZDUSD at current levels near $0.57468, given the oversold RSI on the 4-hour chart?
While the 4-hour RSI at 29.27 suggests oversold conditions, the dominant bearish trend on the daily and 1-hour charts presents significant risk. A contrarian buy would require confirmation of a reversal pattern and a break above $0.5771, with strict stop-losses below $0.5737, carrying a lower probability of success.
Is the ADX reading of 18.67 on the 1-hour chart a concern for a bearish outlook?
An ADX of 18.67 indicates a weak trend on the 1-hour timeframe, suggesting that while the overall direction might be bearish, the momentum is not yet strongly committed. This could lead to consolidation or choppy price action in the short term, making clear directional trades more challenging until a stronger trend emerges.
How will upcoming US economic data, such as NFP, impact NZDUSD this week?
Stronger-than-expected US NFP data would likely bolster the US Dollar, putting further downward pressure on NZDUSD and reinforcing the bearish scenario. Conversely, weaker data could trigger short-covering and a potential bounce for NZDUSD, especially if it signals a shift in Fed policy expectations.
Track markets in real-time
AI-powered analysis, technical indicators and real-time price data.
Join Our Telegram Channel
Breaking market news, AI analysis and trading signals instantly.
Join Channel