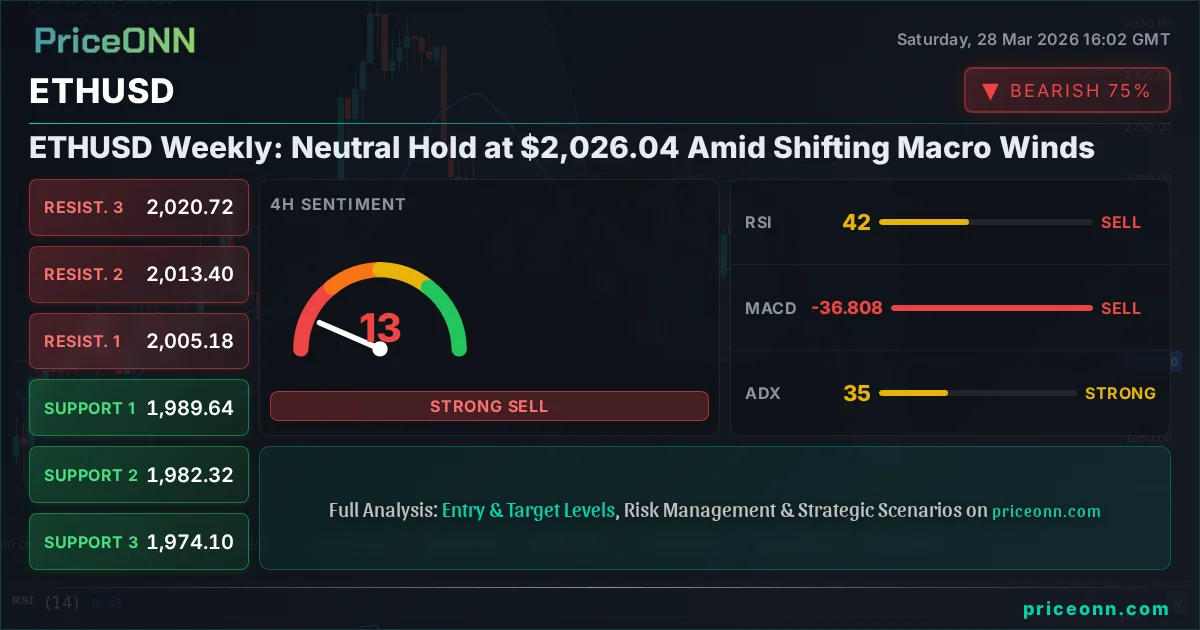
ETHUSD Weekly: Neutral Hold at $2,026.04 Amid Shifting Macro Winds
ETHUSD hovers around $2,026.04. Last week saw volatility, with mixed signals from indicators and a cautious market outlook for the week ahead.
The cryptocurrency market, and Ethereum (ETHUSD) in particular, finds itself at a critical juncture as the past week closed with the digital asset trading just above the significant $2,026.04 mark. While the immediate price action suggests a neutral stance, a deeper dive into the underlying macroeconomic currents and technical indicators reveals a complex interplay of forces that will likely dictate Ethereum's trajectory in the coming week. Geopolitical tensions continue to cast a long shadow, impacting risk appetite globally, and the reverberations are undeniably felt in the crypto space. Investors are now tasked with navigating this uncertain landscape, discerning genuine opportunities from fleeting price fluctuations. The question on everyone's mind is whether Ethereum can hold its ground or if the prevailing macro headwinds will push it lower.
- ETHUSD is currently trading at $2,026.04, holding a neutral position after a week of volatility.
- On the 1-hour chart, RSI is at 57.6, indicating neutral momentum with a slight upward bias, while Stochastic shows a bullish signal (%K > %D).
- However, the 4-hour and 1-day charts present a more cautious picture, with ADX readings indicating strong downtrends and RSI below 45, suggesting prevailing bearish sentiment on longer timeframes.
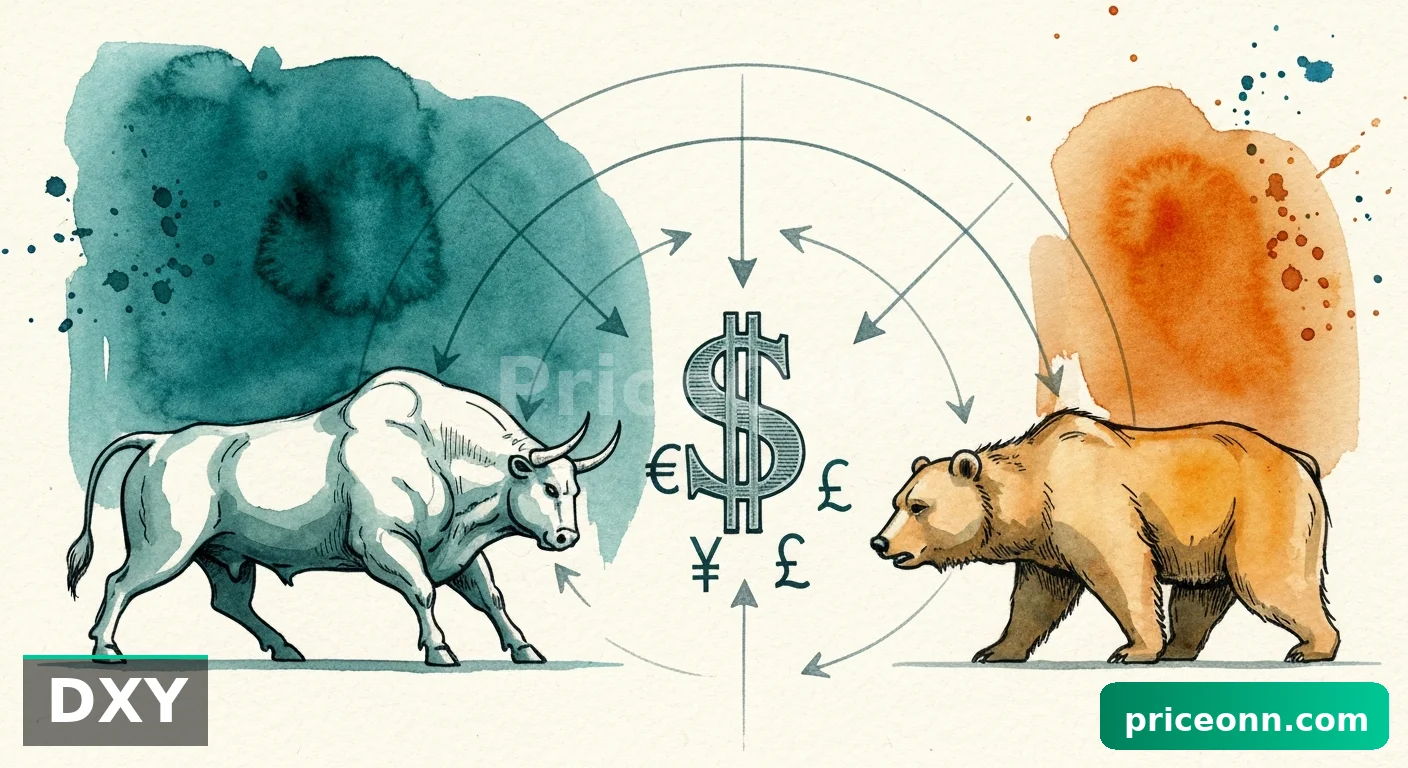
- The US Dollar Index (DXY) at 99.91 is strong, exerting pressure on risk assets like ETHUSD, while the S&P 500's sharp decline to 6357.55 signals broader market risk aversion.
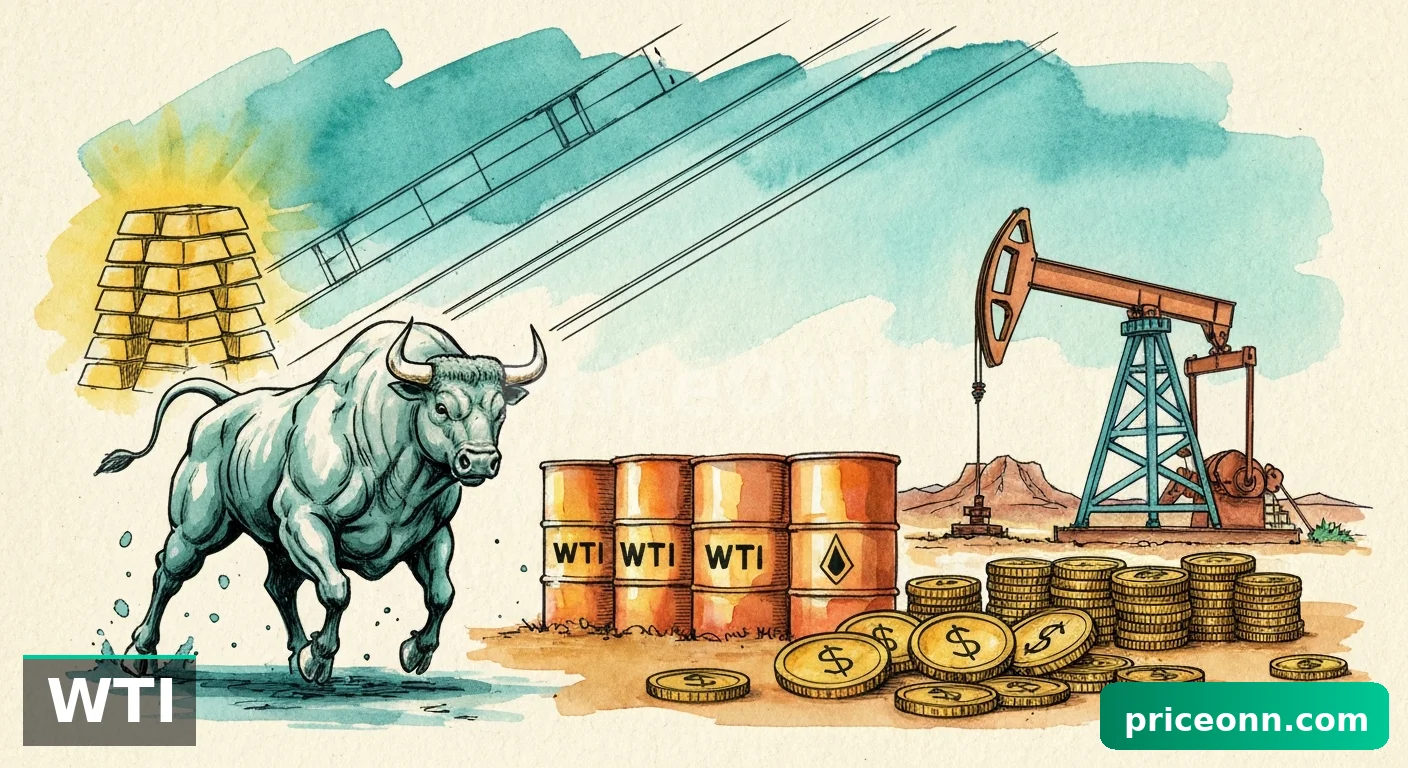
The past week presented a challenging environment for risk assets, and Ethereum was no exception. While the 1-hour technicals flirted with bullish signals, offering a glimmer of hope for short-term traders, the longer-term outlook painted a different, more cautious narrative. The critical $2,026.04 level became a battleground, with bulls and bears fighting for control. This indecision is not surprising given the broader market sentiment, where escalating geopolitical tensions, particularly in the Middle East, have sent shockwaves across global financial markets. The surge in oil prices to over $110 for Brent crude is a stark reminder of the inflationary pressures and supply chain risks that continue to plague the global economy. This backdrop inherently dampens risk appetite, making investors more hesitant to allocate capital to volatile assets like cryptocurrencies.
The strength of the US Dollar Index (DXY), which climbed to 99.91, further complicates the picture for ETHUSD. A stronger dollar typically exerts downward pressure on commodities and risk assets, as it increases the cost of holding these assets for holders of other currencies. This correlation is a fundamental aspect of market dynamics that cannot be ignored. When the DXY strengthens, it often signals a 'risk-off' sentiment in the markets, prompting a flight to perceived safe-haven assets. The simultaneous sharp decline in the S&P 500 to 6357.55 and Nasdaq 100 to 23092.5 underscores this sentiment. Major equity indices experienced significant losses, reflecting investor anxiety about the geopolitical situation and its potential economic fallout. In such an environment, even assets that have historically shown a decoupling tendency from traditional markets, like Bitcoin and Ethereum, can find themselves under pressure.
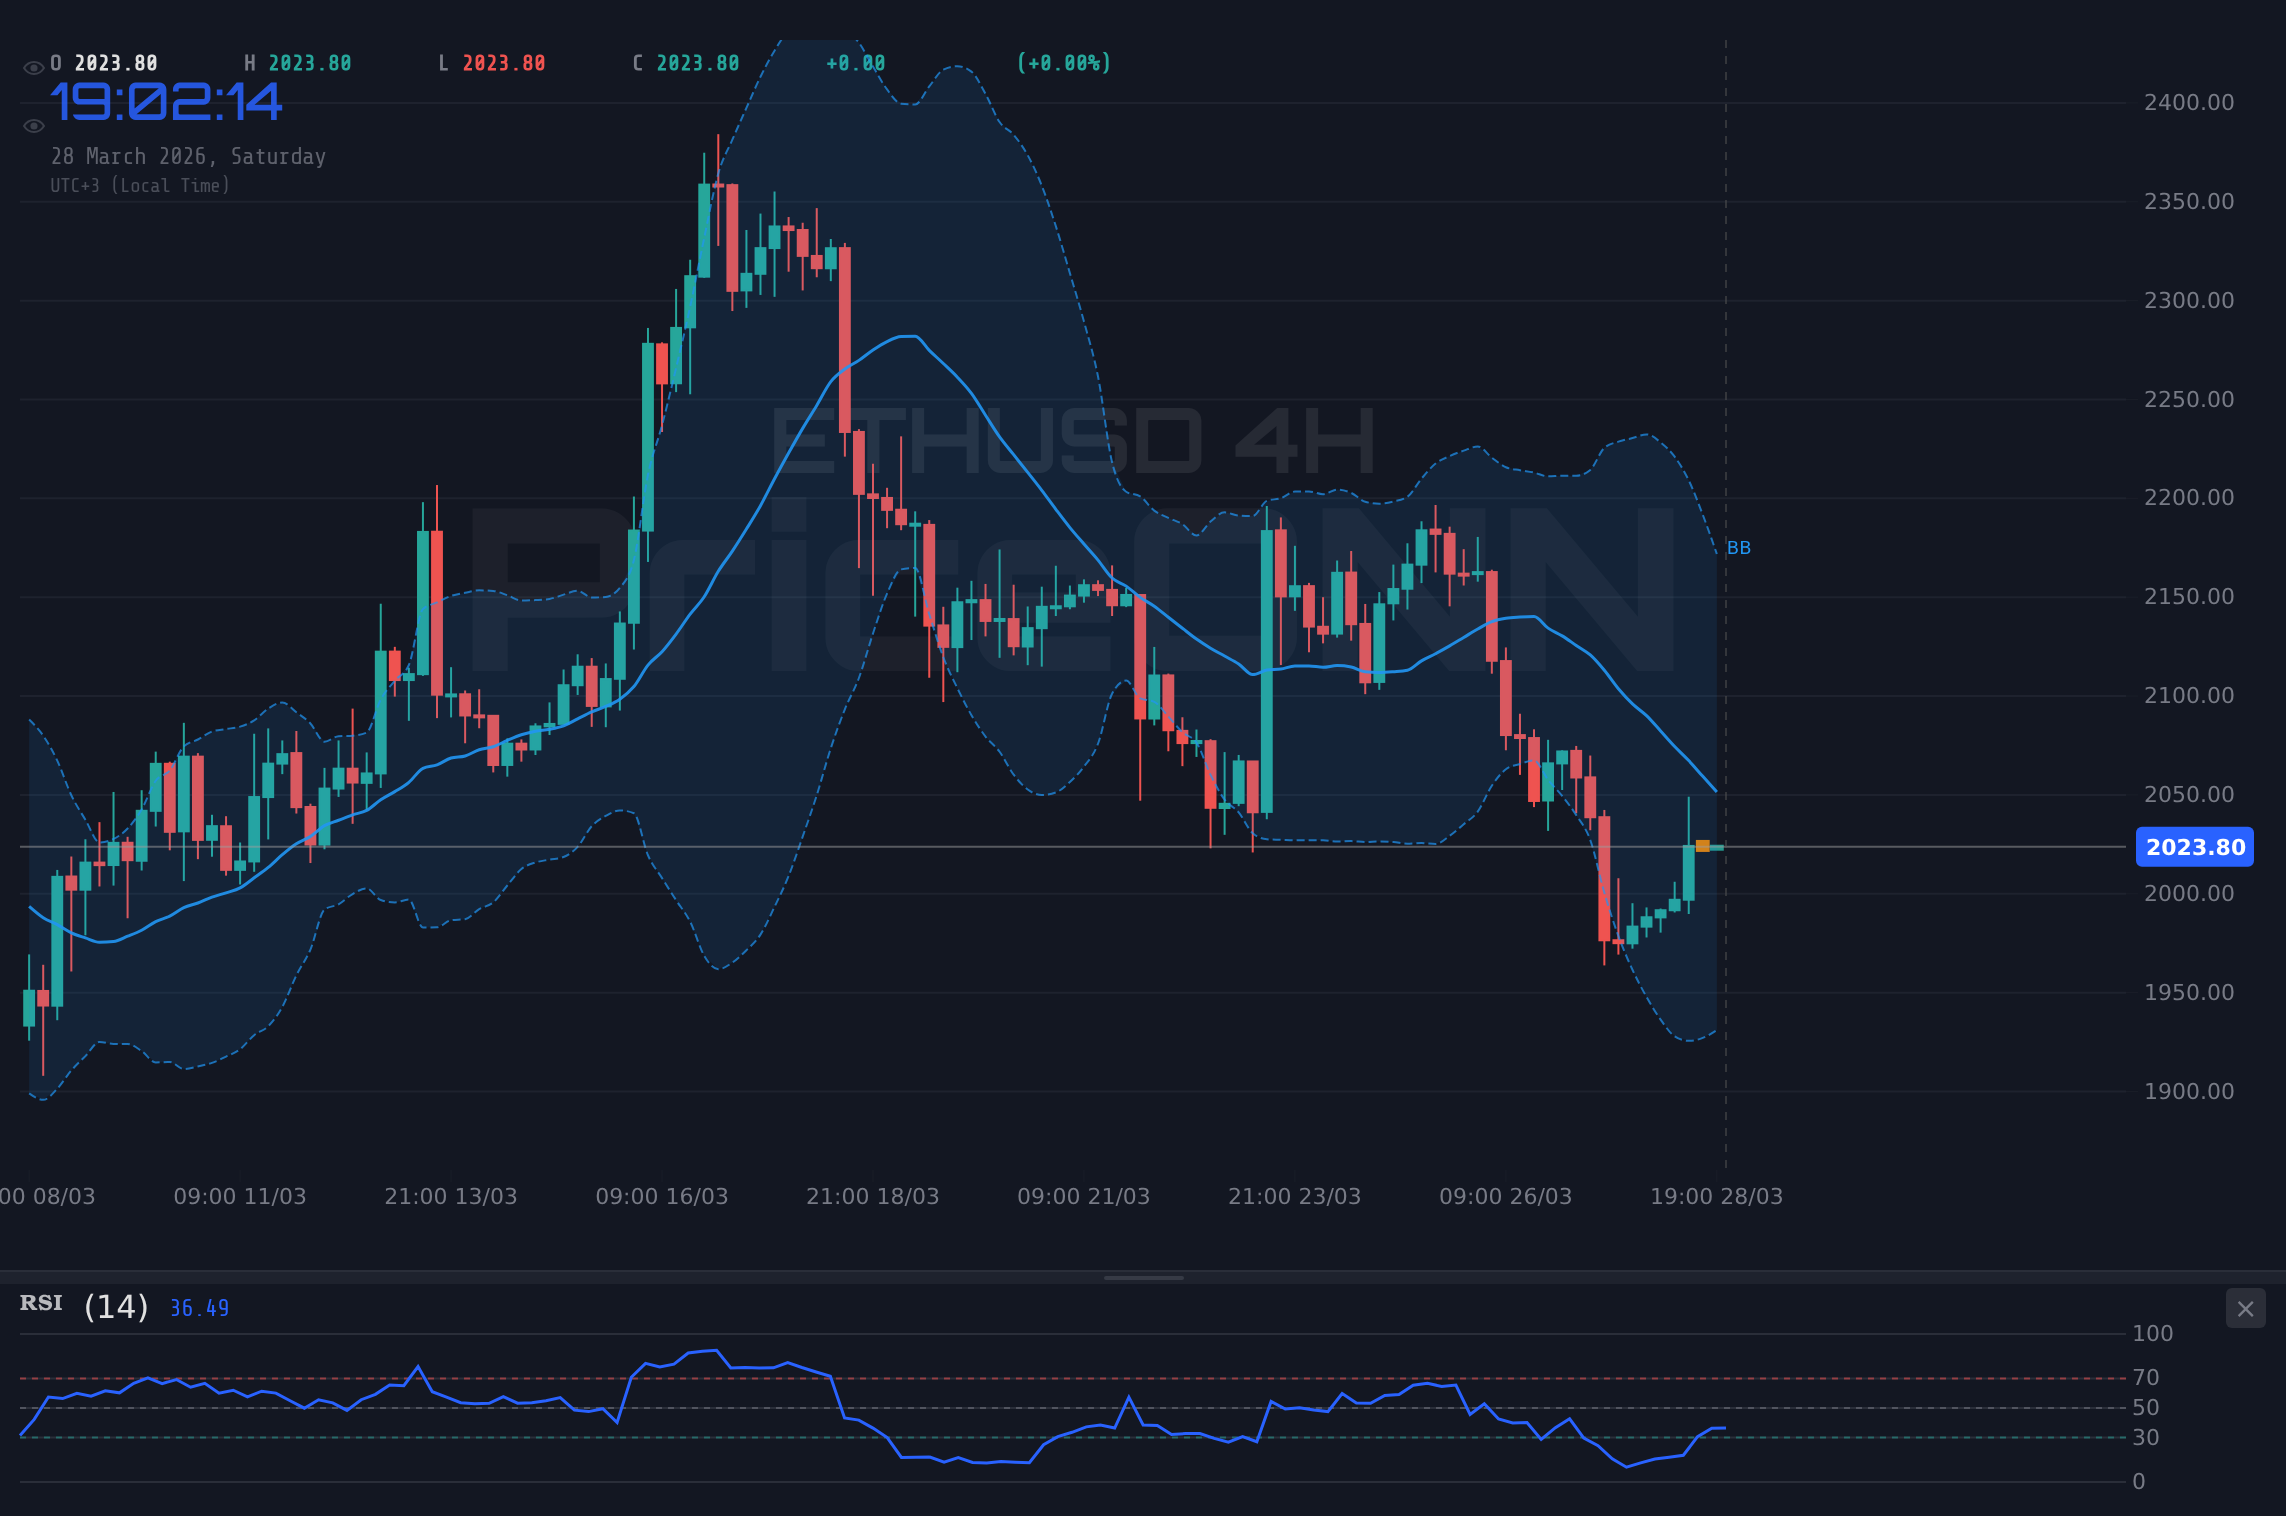
Looking at the technical indicators for ETHUSD, a multi-timeframe analysis reveals conflicting signals, which is a hallmark of the current neutral consolidation phase. On the 1-hour timeframe, the Relative Strength Index (RSI) at 57.6 suggests a neutral momentum with a slight upward inclination, while the Stochastic indicator, with %K at 68.4 and %D at 61.77, confirms a bullish crossover, indicating potential short-term buying interest. The MACD is also showing positive momentum, trading above its signal line. This could tempt short-term traders to look for buying opportunities. However, this optimism is tempered significantly when we shift our focus to the 4-hour and daily charts. The ADX on the 4-hour chart stands at 31.78, indicating a strong downtrend, while the daily ADX at 17.3 suggests a weaker trend, albeit still reflecting underlying bearish pressure.
The daily RSI for ETHUSD is currently at 42.8, firmly in the neutral zone but leaning towards bearish territory, and the MACD is printing negative momentum, sitting below its signal line. This divergence in signals across different timeframes is crucial for understanding the present market structure. The short-term bullish indicators might be signalling temporary bounces or opportunistic plays within a larger bearish trend. The prevailing trend, especially on the daily chart, still appears to be downwards, despite the recent price action hovering around $2,026.04. The Stochastic on the daily chart, with %K at 17.44 and %D at 27.14, also signals a bearish crossover and remains in oversold territory, hinting at potential further downside or a consolidation before any significant move.
The geopolitical narrative, particularly the heightened tensions in the Middle East and their impact on oil prices, cannot be overstated. Brent crude futures surging past $110 and WTI crude oil prices climbing towards $101.19 are direct indicators of escalating global risk. Such commodity price spikes have historically been inflationary, forcing central banks to maintain a hawkish stance or even consider further tightening. This environment is particularly challenging for risk assets like Ethereum. The recent news indicating that Iran has asserted control over the Strait of Hormuz, a critical chokepoint for global oil supply, adds another layer of uncertainty. This event, if it escalates, could lead to significant disruptions in energy markets, further fueling inflation fears and prompting a stronger flight to safety, likely benefiting the US dollar and potentially pressuring ETHUSD.
The correlation between ETHUSD and the US Dollar Index (DXY) is a key element to monitor. With the DXY showing strength at 99.91 and exhibiting a strong upward trend on daily charts (ADX 31.98), it suggests that the dollar is likely to remain a favored currency in the short to medium term. This persistent dollar strength can act as a significant headwind for Ethereum. A stronger dollar makes dollar-denominated assets more expensive for holders of other currencies, potentially reducing demand. Furthermore, the broader risk-off sentiment, as evidenced by the significant drops in major US equity indices like the S&P 500 (down to 6357.55) and Nasdaq 100 (down to 23092.5), reinforces this correlation. Investors are likely to reduce their exposure to riskier assets, including cryptocurrencies, in favor of more stable investments.
The economic calendar for the upcoming week, while not featuring major high-impact events on Monday, does hold significant data releases that could sway market sentiment. The US is set to release inflation data, with previous figures showing a concerning 6.926% annual rate for a specific (though contextually unspecified) USD indicator, significantly above the forecast. Any deviation from forecasts on upcoming inflation or employment figures could trigger substantial volatility. For instance, if inflation proves stickier than expected, it could embolden the Federal Reserve to maintain its hawkish monetary policy stance, further strengthening the dollar and pressuring ETHUSD. Conversely, signs of cooling inflation might pave the way for a more dovish outlook, potentially offering some relief to risk assets.
The recent news flow surrounding Tether's first full audit with KPMG is also noteworthy, although its direct impact on ETHUSD might be indirect. A successful audit and increased confidence in stablecoins like USDT could, in theory, improve the overall stability and perception of the crypto market. However, the dominant macro and geopolitical factors currently seem to be overshadowing these developments. While a more robust stablecoin ecosystem is beneficial for the long-term health of the crypto market, it may not be enough to counteract immediate bearish pressures stemming from rising oil prices and a strong dollar, especially with major indices like the S&P 500 showing significant daily losses of 2%.
The technical levels for ETHUSD highlight the current tight range and the importance of key price points. On the 1-hour chart, immediate resistance is seen at 4534.5, with further levels at 4552.4 and 4576.35. Support is found at 4492.65, 4468.7, and 4450.8. However, these are 1-hour levels and may not reflect the larger trend. The daily resistance level of $4497.62 is far more significant, and breaking above it would be a strong bullish signal. Conversely, the daily support at $4304.96 represents a substantial downside target if bearish momentum reasserts itself. For the upcoming week, watching the price action around the $2,026.04 mark will be critical. A sustained move above the 1-hour resistance of $4534.5, supported by improving broader market sentiment and a weaker DXY, could signal a short-term bullish reversal. Conversely, a decisive break below the 1-hour support at $4492.65, especially if accompanied by further negative news or a stronger DXY, could lead to a retest of lower daily support levels.
The narrative around quantum computing and its potential impact on blockchain security, as discussed in recent market news concerning Bitcoin and Ethereum, adds a long-term speculative element. While the immediate market is driven by macro factors, the ongoing development of quantum-resistant cryptography is a crucial background theme. However, for the current week, the focus remains firmly on the immediate price action and the confluence of geopolitical and macroeconomic data. The fact that Bitcoin's network might be lagging Ethereum in quantum-proofing its infrastructure is an interesting point, but it's unlikely to be a primary driver of price movement in the short term unless specific regulatory actions or breakthroughs occur.
Considering the conflicting signals across timeframes, the most probable scenario for ETHUSD in the short term appears to be continued consolidation, with a slight bearish bias due to the overwhelming macro and longer-term technical pressures. The 1-hour chart offers potential for short-term bounces, but these are likely to be capped by resistance levels and broader market sentiment. The strength of the DXY at 99.91 and the significant drops in major equity indices suggest that caution will remain the dominant theme among investors. Any significant catalyst, such as a major shift in central bank rhetoric, a de-escalation of geopolitical tensions, or surprisingly weak economic data, would be needed to break this current stalemate.
The price action around the $2,026.04 level will be the primary focus. A failure to hold this level could open the door for a test of the 4-hour support at 1989.64, and potentially the daily support at 4304.96 if the sell-off intensifies. On the upside, a sustained break above the 1-hour resistance of $4534.5, followed by a move above the daily resistance of $4497.62, would be required to invalidate the current bearish leanings. However, given the prevailing risk-off sentiment and the strong dollar, such a move seems less likely without a significant shift in the macro environment. Traders will be closely watching the economic calendar for any data that could alter the course of central bank policy expectations, as this will be the most potent catalyst for a directional move.
The energy markets, with Brent crude surpassing $110 and WTI approaching $101, are a significant factor influencing inflation expectations and, consequently, central bank policy. This surge in energy prices, driven by geopolitical instability, creates an inflationary impulse that the market is acutely sensitive to. If this trend continues, it could force the hand of central bankers, leading to a more prolonged period of higher interest rates. This would, in turn, strengthen the US dollar further and put additional downward pressure on risk assets like ETHUSD. The relationship between energy prices, inflation, and monetary policy is a complex but critical one to understand for anyone trading in today's market environment.
The current market sentiment, characterized by a strong dollar and falling equity markets, suggests that caution is warranted. While the 1-hour technicals for ETHUSD show some bullish signs, the longer-term outlook remains clouded by macroeconomic uncertainties and geopolitical risks. The price level of $2,026.04 represents a crucial psychological and technical point. A break below this level could signal a continuation of the downtrend, while holding it might lead to further consolidation. Ultimately, a clear directional bias will likely emerge only after a significant shift in the broader economic or geopolitical landscape, or a decisive break of key technical levels confirmed by strong volume and consistent multi-timeframe signals.
Navigating these choppy waters requires a disciplined approach. The conflicting signals across different timeframes mean that short-term traders might find opportunities in intraday bounces, but these should be approached with extreme caution and tight risk management. Long-term investors might see the current consolidation and potential downside as an opportunity to accumulate on dips, provided they have a strong conviction in Ethereum's long-term fundamentals and are prepared for continued volatility. However, the immediate focus must remain on the macro picture: the direction of the US dollar, the trajectory of inflation, and the ongoing geopolitical developments. These factors will be the primary drivers shaping Ethereum's price in the coming weeks.
The market is currently in a state of flux, with conflicting signals emerging from various technical indicators and a backdrop of significant macroeconomic and geopolitical uncertainty. While the 1-hour chart for ETHUSD might offer some brief bullish respite around the $2,026.04 level, the longer-term 4-hour and daily charts suggest that bearish pressures are still dominant. The strong US dollar, coupled with declining equity markets and rising oil prices, paints a picture of risk aversion that is generally unfavorable for cryptocurrencies. Any significant move higher would likely require a clear catalyst, such as a dovish shift in central bank rhetoric or a de-escalation of global tensions. Until then, expect continued volatility and a battle for control around key price levels.
| Indicator | Value | Signal | Interpretation |
|---|---|---|---|
| RSI (14) | 57.6 | Neutral | Short-term positive momentum, but daily RSI at 42.8 indicates overall bearish leaning. |
| MACD | Positive | Bullish | On 1H, but negative momentum on daily chart suggests caution. |
| Stochastic | K=68.4, D=61.77 | Bullish | Bullish crossover on 1H, but daily signals are bearish. |
| ADX | 32.01 | Strong Trend | Indicates a strong trend on 1H, but 4H/1D ADX values suggest waning trend strength or bearish trend. |
| Bollinger | Upper Band | Watch | Price is above the middle band on 1H, but below on 4H/1D, indicating mixed signals. |
Bearish Scenario: Downside Pressure Mounts
65% ProbabilityNeutral Scenario: Consolidation Around $2,026.04
25% ProbabilityBullish Scenario: Short-Term Bounce
10% ProbabilityFrequently Asked Questions: ETHUSD Analysis
What happens if ETHUSD breaks below the $2,026.04 level this week?
A break below $2,026.04 on the 1-hour chart would invalidate the short-term bullish signals and likely trigger a move towards the 4-hour support at $1,989.64. This scenario is favored due to the prevailing bearish sentiment on longer timeframes and macro pressures.
Should I consider buying ETHUSD at current levels around $2,026.04 given the mixed signals?
Caution is advised. While the 1-hour chart shows some bullish indicators, the longer-term charts (4H, 1D) suggest dominant bearish trends. A risk-averse approach would be to wait for a clear break above $2,050 or a confirmed bounce from a lower support level like $1,989.64.
Is the RSI at 57.6 on the 1-hour chart a strong buy signal for ETHUSD?
An RSI of 57.6 on the 1-hour chart indicates neutral momentum with a slight upward bias, not a strong buy signal on its own. It suggests some buying interest but needs confirmation from other indicators and price action, especially considering the daily RSI is at 42.8, leaning bearish.
How will the strong US Dollar Index (DXY) at 99.91 affect ETHUSD's price outlook?
The strong DXY at 99.91 exerts downward pressure on ETHUSD. A strengthening dollar typically correlates with risk aversion, making assets like Ethereum less attractive. This macro factor reinforces the bearish bias on longer timeframes and suggests that any upside in ETHUSD might be limited until the DXY shows signs of weakening.
Volatility creates opportunity - those prepared will be rewarded. Patience and disciplined risk management are key in navigating these uncertain markets.
Track markets in real-time
AI-powered analysis, technical indicators and real-time price data.
Join Our Telegram Channel
Breaking market news, AI analysis and trading signals instantly.
Join Channel