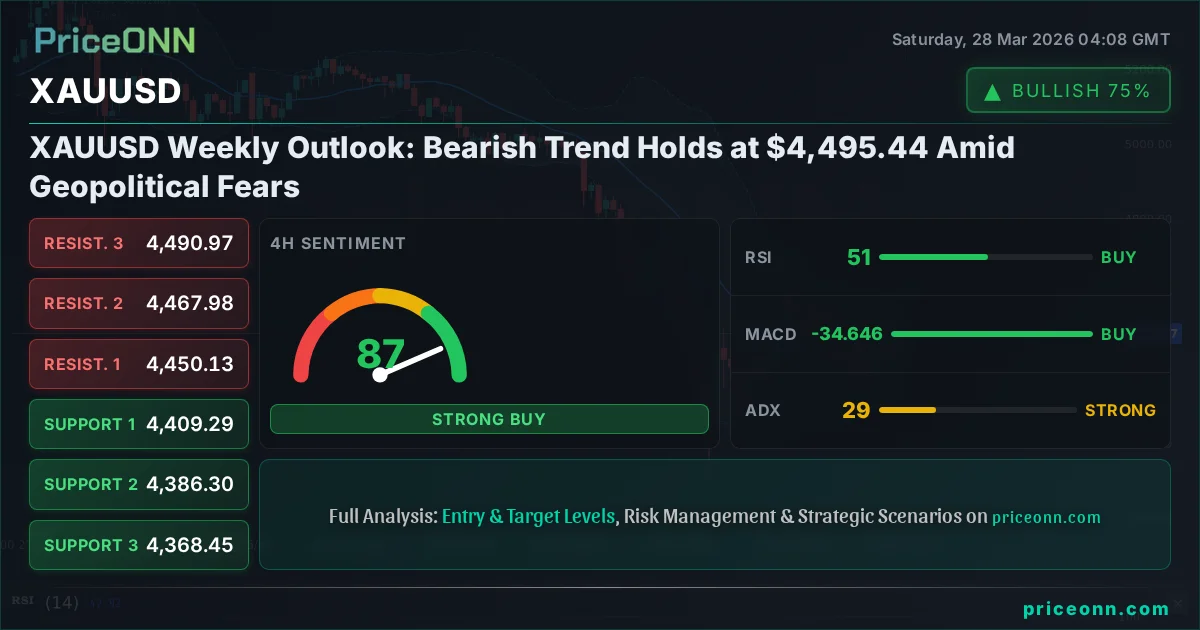
XAUUSD Weekly Outlook: Bearish Trend Holds at $4,495.44 Amid Geopolitical Fears
Gold faces a bearish trend at $4,495.44 as geopolitical tensions rise, but key support levels are being watched closely.
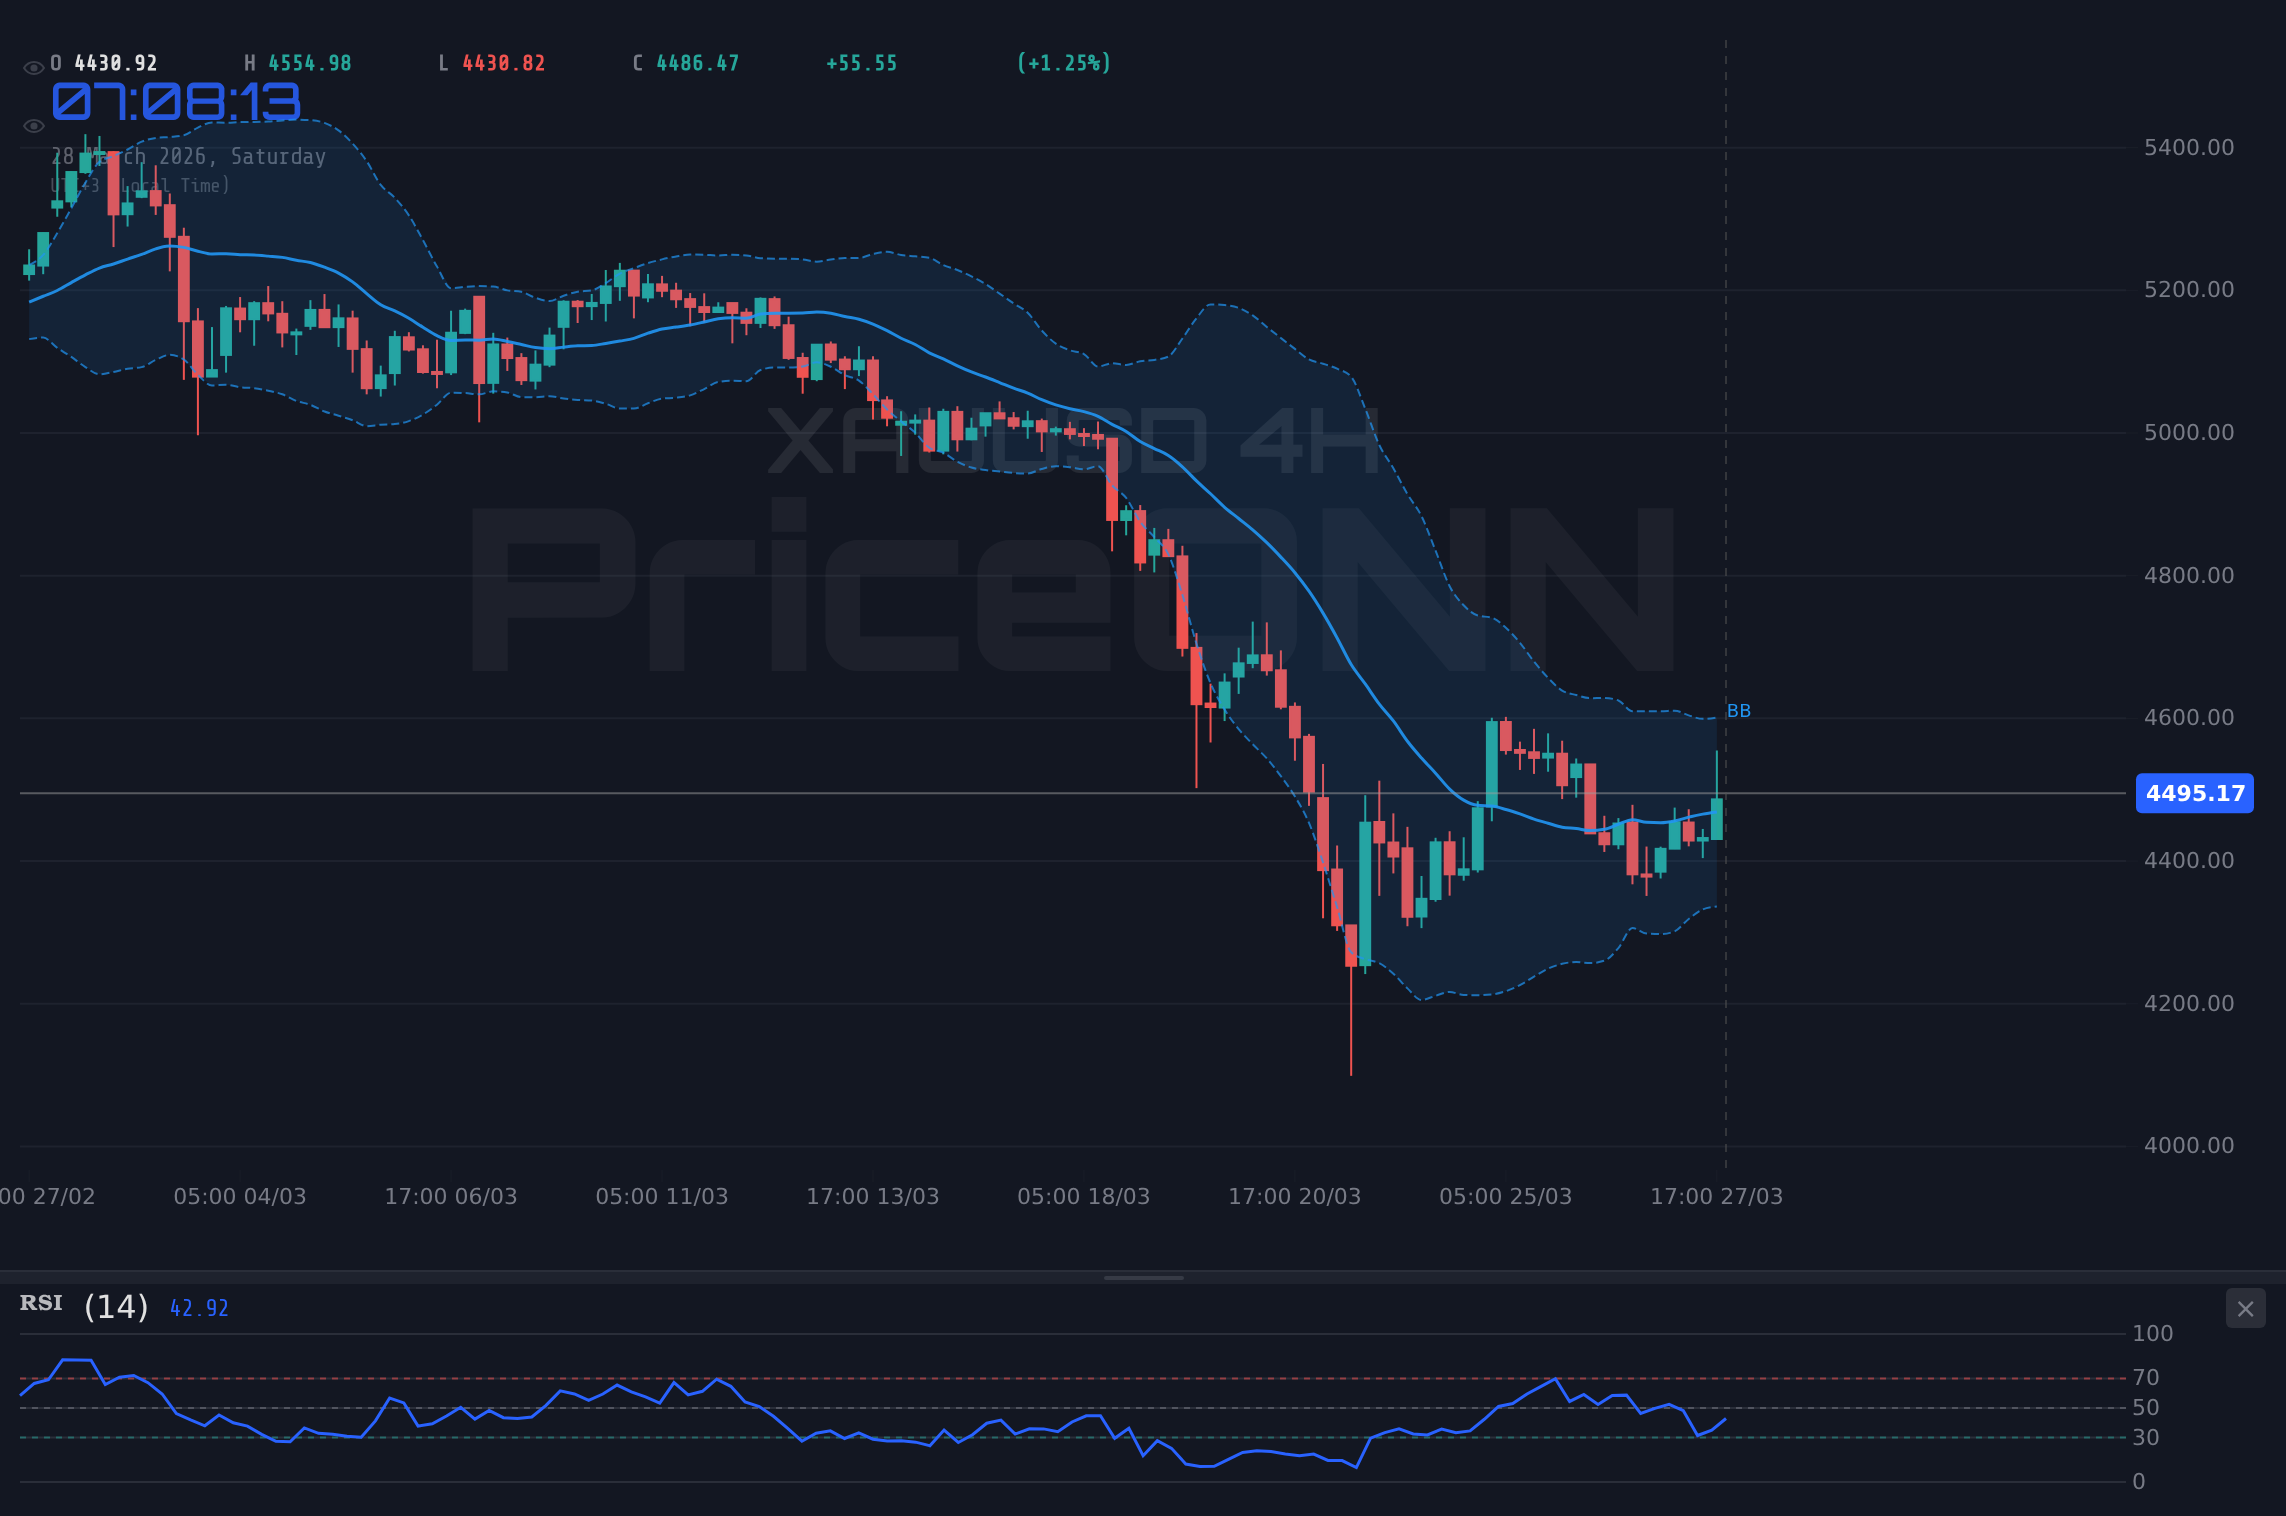
The gold market, or XAUUSD, finds itself at a critical juncture as the week closes with the price hovering around $4,495.44. While the daily chart signals a strong bearish trend with a current ADX of 30.99, the 1-hour and 4-hour timeframes show a conflicting, more neutral to bullish momentum. This divergence presents a complex picture for traders, where short-term optimism clashes with the prevailing longer-term downtrend. Geopolitical tensions, a traditional driver for gold, continue to simmer, adding a layer of uncertainty that could quickly shift market sentiment. Understanding these competing forces is paramount for navigating the week ahead.
- The prevailing daily trend for XAUUSD is bearish, with the ADX at 30.99 indicating a strong downward move.
- Short-term charts (1H and 4H) show a neutral to rising momentum, with RSI readings around 56 and 50 respectively, suggesting potential short-term bounces.
- Critical support for XAUUSD lies at $4,492.65 (1H) and $4,409.29 (4H), while immediate resistance is seen at $4,534.50 (1H) and $4,490.97 (4H).
- Geopolitical risks remain a key factor; any escalation could trigger a flight to safety, potentially challenging the current bearish outlook for gold.
The past week has been a turbulent one for gold, characterized by significant price swings and a clear divergence between short-term and long-term technical signals. We saw XAUUSD trade within a range, testing both its lower and upper bounds before settling near the $4,495.44 mark. The daily chart, in particular, paints a cautious picture. An ADX value of 24.26 on the 1-hour chart and 28.83 on the 4-hour chart suggests a developing trend, but the daily ADX at 30.99 indicates that the longer-term downtrend is still firmly in place. This is a classic scenario where shorter timeframes might offer temporary relief for bulls, but the overarching trend remains a dominant force.
The daily timeframe's indicators paint a decidedly bearish picture. The RSI(14) is sitting at 36.34, firmly in neutral territory but with a downward inclination, signaling that there's still room for prices to fall before hitting oversold conditions. MACD is also below its signal line with negative momentum, reinforcing the bearish sentiment. Bollinger Bands are trading below the middle band, a common sign of bearish pressure. While the Stochastic Oscillator (%K at 37.02, %D at 25.31) is showing a crossover that suggests a potential upward move, it's occurring in oversold territory and needs to be viewed with caution, especially against the backdrop of the stronger daily trend indicators. The overall signal on the daily chart leans heavily towards 'SELL', with 6 out of 8 indicators suggesting a downward trajectory.
However, it's the shorter timeframes that offer a glimmer of hope for the bulls. On the 1-hour chart, the RSI is at 56.67, indicating a neutral to slightly bullish leaning. The MACD is positive, and the Stochastic Oscillator shows %K (63.22) crossing above %D (69.29) – though this crossover is still in the lower range, it's a sign of upward momentum building. The ADX at 24.26 suggests a trend is forming, but it's not yet overwhelmingly strong. The overall signal here is 'BUY', with 6 out of 8 indicators pointing upwards. Similarly, the 4-hour chart presents a more balanced view. RSI is near the 50 mark at 50.56, and the Stochastic is also showing a bullish crossover. The ADX here is 28.83, indicating a stronger trend than on the 1-hour chart, and the overall signal is also 'BUY'. This technical conflict between the daily and intraday charts is where the real trading opportunities - and risks - lie.
The current price of $4,495.44 places XAUUSD precariously close to several key levels. On the 1-hour chart, immediate support is found at $4,492.65, followed by $4,468.70 and $4,450.80. Resistance, on the other hand, is seen at $4,534.50, then $4,552.40, and further up at $4,576.35. The 4-hour chart offers a slightly different perspective on these levels, with support at $4,409.29, $4,386.30, and $4,368.45, and resistance at $4,450.13, $4,467.98, and $4,490.97. The fact that the current price is hovering just below the 4-hour resistance of $4,490.97 and just above the 1-hour support of $4,492.65 highlights the tight range and the indecision in the market. A decisive break above $4,490.97 on the 4-hour chart could signal a short-term bullish reversal, targeting the higher resistance levels. Conversely, a break below $4,492.65 on the 1-hour chart could accelerate the move towards the 4-hour support zone.
Geopolitical tensions are a constant backdrop for the gold market, and this past week was no exception. News of escalating conflicts in West Asia, including reports of potential force majeure on Russian oil shipments due to Ukrainian drone strikes, added fuel to the safe-haven narrative. While gold's immediate reaction might be muted due to the conflicting technical signals, any significant geopolitical development could swiftly override short-term price action. The price of Brent crude oil soaring to $110.64 and WTI at $101.19 also plays a role, as higher energy prices can stoke inflation fears, traditionally a bullish driver for gold. However, the strong dollar, with the DXY index at 99.91, acts as a counteracting force, typically putting downward pressure on dollar-denominated commodities like gold.
The correlation between gold and the US Dollar Index (DXY) is a crucial element to monitor. As the DXY strengthens, it becomes more expensive for holders of other currencies to buy gold, potentially dampening demand. Currently, the DXY is showing a strong upward trend on the daily chart (ADX 31.98) and is in overbought territory on shorter timeframes, suggesting potential for a pullback. If the dollar were to weaken, it would likely provide a tailwind for gold prices, even if the daily technicals remain bearish. Conversely, a continued dollar rally could exacerbate the downward pressure on gold, pushing it towards the lower support levels identified on the daily chart, such as $4,304.96.
The performance of major equity indices also provides context. The S&P 500 and Nasdaq 100 have experienced significant sell-offs, with daily declines of -2% and -2.23% respectively. Such a risk-off environment typically boosts demand for safe-haven assets like gold. However, the conflicting signals within gold's own charts - bullish intraday momentum against a bearish daily trend - mean that this correlation isn't translating into a straightforward rally. The RSI on the S&P 500 is deep in oversold territory (19.92), suggesting a potential bounce in equities. Should equities find their footing, it could draw some capital away from gold, reinforcing the bearish technical outlook. The Dow Jones Industrial Average also saw a sharp decline, closing at 45,077.50, further highlighting the risk aversion in the broader market.
Looking at the broader commodity complex, silver (XAGUSD) is also showing mixed signals. While its daily trend is also classified as bearish (ADX 27.62), its intraday charts are more neutral. Silver is currently trading at $69.74. The interplay between gold and silver prices, often watched through the gold-silver ratio, can offer further insights. Historically, a rising gold-silver ratio can sometimes precede a broader commodity downturn, but it can also indicate gold's outperformance as a safe haven. For now, both metals are wrestling with conflicting technicals and external macroeconomic pressures. The industrial demand for silver, contrasted with gold's primary role as a store of value and hedge against inflation and geopolitical risk, means their price movements can diverge significantly based on the prevailing market narrative.
The Federal Reserve's monetary policy stance remains a pivotal factor influencing gold prices. While specific Fed meeting minutes or announcements weren't provided in the immediate market data, the general expectation of interest rate policy continues to be a key driver. Higher interest rates generally increase the opportunity cost of holding non-yielding assets like gold, while expectations of rate cuts or a dovish pivot can support gold prices. The current market data doesn't provide explicit forward guidance on Fed policy, but the ongoing inflation narrative, coupled with the geopolitical risks, creates a complex environment for central bankers. Any hints of a shift in policy from 'higher for longer' to a more accommodative stance could significantly alter gold's trajectory, potentially overriding the bearish daily technicals.
On the supply side, recent news highlighted AngloGold Ashanti's confirmation of robust economics for its Nevada gold project, potentially paving the way for a mining revival in the region. While this focuses on future supply, it also underscores the ongoing investment and exploration in the gold mining sector. Conversely, news regarding deep-sea mining losses and challenges in processing hubs, while not directly related to gold, speaks to the broader complexities and risks within the metals and mining industry. These factors, though more long-term in nature, contribute to the overall sentiment and investment landscape surrounding precious metals.
The recent surge in oil prices, with Brent closing at $110.64 and WTI at $101.19, is a significant inflationary signal. Historically, gold has been seen as a hedge against inflation, and such sharp increases in energy costs often correlate with rising gold prices. This is one of the fundamental drivers that could be supporting gold despite the bearish daily technicals. The market is likely pricing in potential supply disruptions and increased demand in a tight global market. If inflation fears continue to mount and central banks struggle to contain them without triggering a recession, gold could find strong underlying support, potentially leading to a reversal of the current bearish trend. The interplay between energy prices, inflation expectations, and central bank policy will be critical to watch.
The crypto market presents another layer of correlation and divergence. Bitcoin, currently trading around $66,193, and Ethereum at $1,987.97, are showing bearish trends on their daily charts, mirroring gold's longer-term outlook. However, short-term signals and oversold conditions in some crypto indicators (like Bitcoin's 4H Stochastic at 9.44) suggest potential for bounces. The narrative around Bitcoin potentially outperforming stocks amid renewed pressure on equities is interesting. If risk assets broadly continue to struggle, both gold and Bitcoin could benefit from a flight to perceived value, though their individual drivers can differ. The emergence of 'Proof-of-Humanity' as a concept amidst AI deepfakes also highlights the evolving digital asset landscape, although its direct impact on gold is minimal.
Considering the current market environment, the bearish outlook on the daily chart for XAUUSD cannot be ignored. The ADX at 30.99 signifies a robust trend, and the RSI below 40 indicates bearish momentum. However, the intraday charts present a conflicting picture, with positive MACD and RSI readings that suggest short-term buying opportunities. This creates a 'fight for control' scenario. Traders looking to fade the daily trend might target the intraday resistance levels, anticipating a bounce back towards the $4,534.50 mark on the 1-hour chart. Conversely, those aligned with the daily trend would be looking for any intraday strength to wane, with a break below the $4,492.65 support level on the 1-hour chart signaling a continuation of the move lower, potentially towards the $4,409.29 support on the 4-hour chart.
Bearish Scenario: Trend Continuation
65% ProbabilityNeutral Scenario: Consolidation & Divergence
25% ProbabilityBullish Scenario: Short-Term Reversal
10% ProbabilityThe economic calendar for the upcoming week will be crucial in shaping gold's direction. While specific high-impact events for the current week were not detailed beyond general data points like USD figures, upcoming events will be closely watched. The market will be looking for any signals from the Federal Reserve that could indicate a change in interest rate policy. Inflation data, employment figures, and GDP releases will provide further clues about the health of the global economy and potential shifts in monetary policy. For instance, the USD figures released recently showed actuals of 6.926, contrasting with a forecast of -1.3, indicating unexpected dollar strength that has implications across all markets, including gold. Any further dollar strength driven by strong US economic data could continue to pressure gold prices.
The interplay between inflation, interest rates, and geopolitical risk creates a volatile environment for gold. If inflation continues to prove stubborn, central banks may be forced to maintain higher rates for longer, which would typically be bearish for gold. However, persistent geopolitical tensions or a sudden economic downturn could trigger safe-haven demand, overriding the interest rate differential. The current bearish daily trend suggests that, fundamentally, the market is not yet pricing in a significant safe-haven bid strong enough to overcome the prevailing economic headwinds. Yet, the intraday strength and the ongoing geopolitical uncertainty mean that a sharp reversal is always possible. Traders must remain vigilant, watching for confirmation on the daily chart before committing to a position against the prevailing trend.
Frequently Asked Questions: XAUUSD Analysis
What happens if XAUUSD breaks below the $4,490.97 level on the 4-hour chart?
A break and sustained hold below the $4,490.97 level on the 4-hour chart would invalidate any short-term bullish reversal hopes and confirm the continuation of the daily bearish trend. This scenario would likely target the next significant support at $4,409.29, with further downside potential towards $4,304.96.
Should I consider buying XAUUSD at current levels around $4,495.44 given the mixed signals?
Buying at current levels presents a high-risk, potentially moderate-reward scenario given the conflicting intraday and daily signals. A cautious approach would involve waiting for a confirmed break above the $4,534.50 resistance on the 1-hour chart, or a decisive break below the $4,490.97 level, to gain clearer directional conviction. The probability of a short-term bounce is present, but the dominant daily trend poses a significant risk.
Is the RSI at 36.34 on the daily chart a sell signal for XAUUSD?
An RSI of 36.34 on the daily chart is not an immediate sell signal in itself; it indicates that gold is in neutral territory but leaning towards bearish sentiment. It suggests there is room for further downside before hitting oversold conditions. This reading supports the prevailing bearish trend rather than acting as a direct trigger for a sale, which would typically require a break of key support levels.
How will the strong DXY at 99.91 affect XAUUSD in the coming week?
A DXY value of 99.91, showing a strong daily uptrend, typically exerts downward pressure on gold prices due to the inverse relationship. If the dollar continues to strengthen, it could exacerbate the bearish trend in XAUUSD, potentially pushing prices towards the lower support levels. However, escalating geopolitical risks could temporarily decouple gold from the dollar's movement.
Track markets in real-time
AI-powered analysis, technical indicators and real-time price data.
Join Our Telegram Channel
Breaking market news, AI analysis and trading signals instantly.
Join Channel