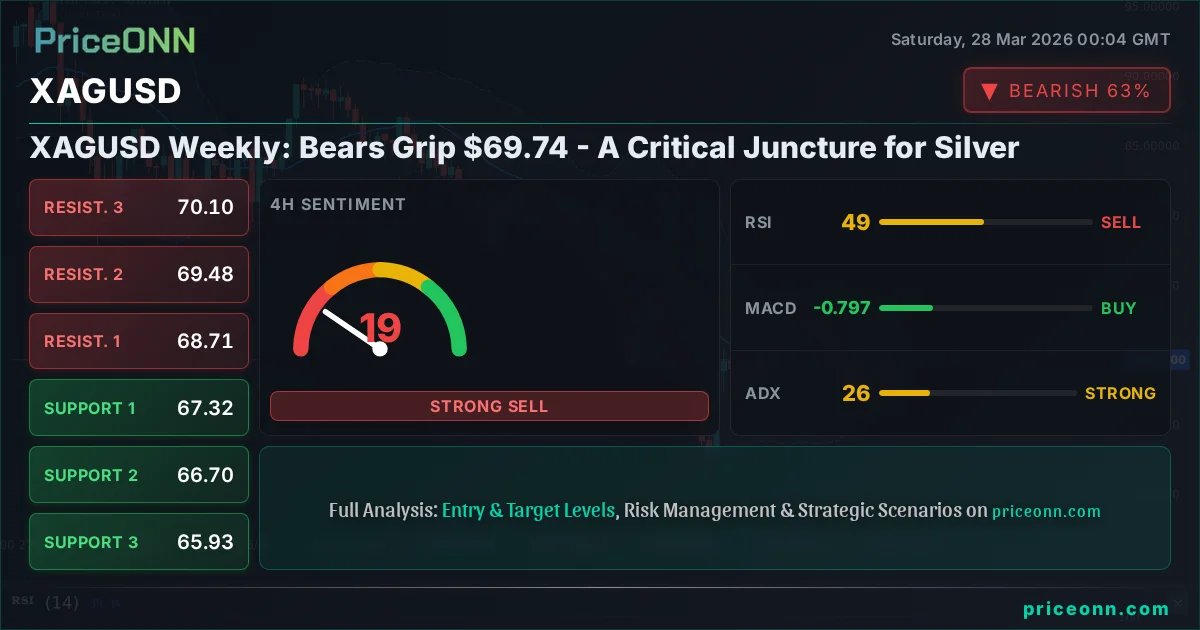
XAGUSD Weekly: Bears Grip $69.74 - A Critical Juncture for Silver
Silver's weekly outlook remains under pressure as it hovers around $69.74. Bears are firmly in control, but key levels hint at potential shifts.
This past week has been a stark reminder of the forces at play in the precious metals market, particularly for silver. As we close the trading week, XAGUSD finds itself entrenched around the critical $69.74 level. The narrative for silver has been one of resilience tested, with bearish sentiment creeping back into the forefront after a period of upward momentum. While the charts present a complex picture, the interplay between macroeconomic factors, geopolitical undercurrents, and technical signals paints a compelling, albeit cautious, outlook for the week ahead. The question on many traders' minds is whether the current price action at $69.74 represents a temporary pause or a more significant shift in trend.
- With RSI at 38.53 on the daily chart, silver shows a downward trend, indicating potential for further weakness below current levels.
- The critical support for XAGUSD sits at $65.68, a level that has held previously but is now under increasing pressure.
- MACD histogram on the daily chart remains negative, suggesting bearish momentum is still present, despite some short-term fluctuations.
- The strong upward movement in the US Dollar Index (DXY), currently at 99.91, is correlating with pressure on silver, a common dynamic in the market.
Navigating the Currents: Silver's Dance with the Dollar
The relationship between silver (XAGUSD) and the US Dollar Index (DXY) is a cornerstone of market analysis, and this week has underscored that connection. As the DXY climbed to 99.91, it exerted a predictable drag on silver prices. Historically, a stronger dollar tends to make dollar-denominated commodities like silver more expensive for holders of other currencies, thus dampening demand. This inverse correlation is not merely theoretical; it's a visible force shaping price action daily. The current DXY strength, supported by robust technical signals across multiple timeframes – showing strong bullish trends on 4H and 1D charts – suggests that this pressure on silver may persist. Traders are closely watching if the DXY can maintain its upward trajectory above the 100-point psychological level, as this would likely translate into continued headwinds for XAGUSD.
Furthermore, the broader macroeconomic environment, particularly interest rate expectations, plays a pivotal role. While the provided data doesn't detail specific rate hike probabilities, the general market sentiment surrounding inflation and central bank policy remains a key driver. Higher interest rates, or the anticipation thereof, tend to increase the opportunity cost of holding non-yielding assets like silver, making interest-bearing assets more attractive. This dynamic adds another layer of complexity to silver's price outlook, suggesting that any shifts in monetary policy expectations could significantly impact its trajectory. The current technical picture for DXY, with its strong upward momentum and overbought signals on shorter timeframes, implies that the dollar's strength is a significant factor that cannot be ignored in any XAGUSD analysis.
The strength of the dollar is not just a forex story; it has tangible implications for global commodity markets. As investors seek higher yields in dollar-denominated assets, capital can be withdrawn from riskier or non-yielding assets, including precious metals. This dynamic is particularly relevant for silver, which, while having industrial applications, also functions as a safe-haven asset and a store of value. The current market data shows the DXY at 99.91, nearing the significant 100 mark, which historically acts as a psychological barrier and a point of potential trend confirmation. A sustained move above this level would likely embolden dollar bulls and intensify the pressure on assets like XAGUSD, pushing its price further away from the $70.00 mark.
Technical Undercurrents: A Mixed Signal at $69.74
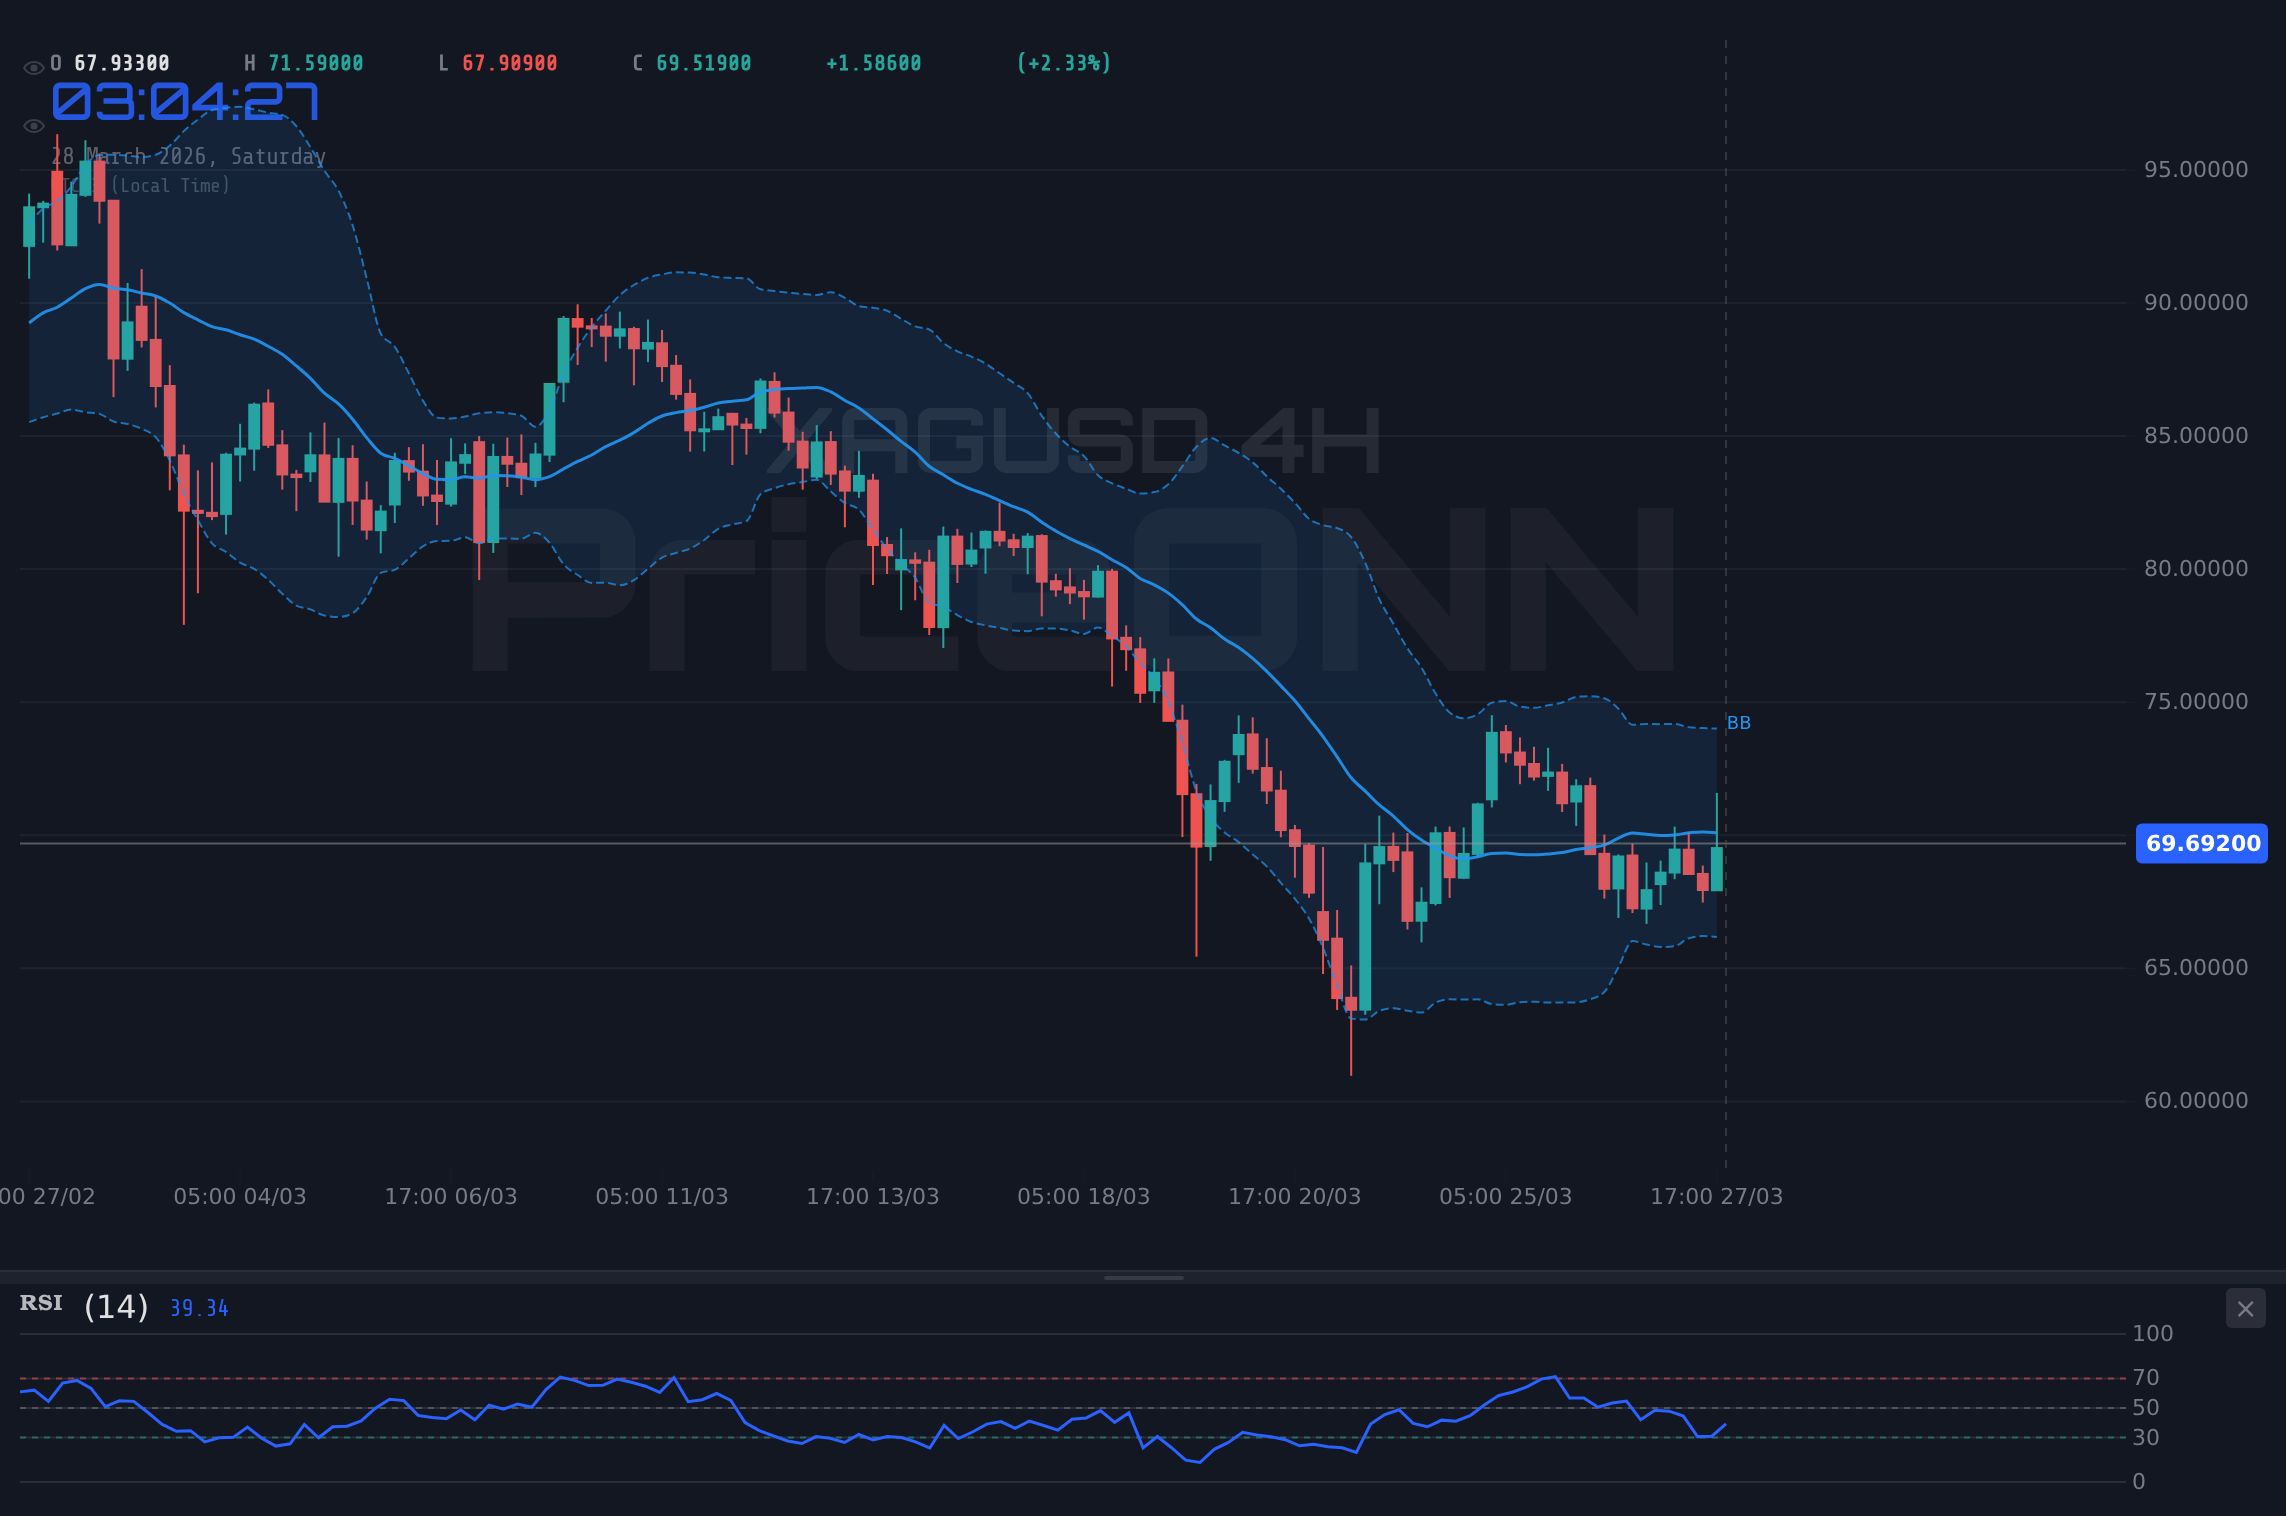
Diving into the technical indicators for XAGUSD, the picture at the $69.74 level is far from uniform, presenting a challenge for traders seeking clear directional signals. On the 1-hour chart, the trend is neutral with a 50% strength, but the RSI at 53.19 suggests a slight upward inclination, while the Stochastic oscillator flashes a potential dip signal (%K < %D). The MACD shows positive momentum, and prices are trading above the middle Bollinger Band, painting a somewhat constructive, albeit indecisive, short-term outlook. However, this short-term view is immediately contrasted by the 4-hour and daily charts, which paint a more bearish picture.
The 4-hour chart reveals a neutral trend with 50% strength, but the RSI at 49.03 indicates a downward tendency, and prices are below the middle Bollinger Band. The ADX at 26.25 suggests a strong trend is in play, but the overall signal leans towards selling. This is where things get interesting; the daily timeframe presents a clear bearish trend with 90% strength. The RSI is at a subdued 36.34, firmly in neutral territory but trending downwards, reinforcing the bearish sentiment. MACD is under the signal line with negative momentum, and prices are hugging the lower Bollinger Band, indicating downside pressure. The ADX at 30.99 confirms a strong downtrend. This conflict between the short-term neutral-to-slightly-bullish signals and the dominant daily bearish trend is the crux of the current market dilemma for XAGUSD.
The divergence in signals across different timeframes is a common characteristic of markets in transition or consolidation phases. While the 1-hour chart might offer fleeting glimpses of buying interest, the overwhelming weight of the daily trend suggests that any short-term rallies are likely to be met with selling pressure. The ADX values provide a crucial layer of context; on the 1-hour, it's a weak 19.81, indicating a lack of conviction. However, it ramps up to 26.25 on the 4-hour and 30.99 on the daily, confirming that while the intraday picture is muddled, a strong trend is indeed developing on longer timeframes, and it's currently bearish for silver. This is the kind of technical complexity that requires patient observation and a clear understanding of which timeframe holds the most predictive power for the intended investment horizon.
The Stochastic indicator offers another layer of nuance. On the 1-hour chart, it shows a potential dip signal (%K < %D), while on the 4-hour and daily charts, it presents a bullish signal (%K > %D), often seen as a precursor to upward movement from oversold or near-oversold conditions. However, this bullish signal from the Stochastic on longer timeframes must be viewed in conjunction with the RSI and MACD, which are decidedly bearish on the daily. This is a classic case of conflicting indicators, where traders must decide which signals carry more weight. Given the strong downtrend indicated by the daily ADX and the RSI's position, the Stochastic's bullish signals might represent mere oversold conditions within a larger downtrend, rather than a genuine reversal signal. This requires careful risk management; waiting for confirmation from price action breaking key resistance levels or a stronger buy signal from other indicators would be prudent.
Fundamental Drivers: Inflation Fears and Central Bank Tightrope
Beyond the charts, the fundamental backdrop for silver remains intricately linked to inflation expectations and central bank policy. While the provided economic calendar data is sparse for the immediate past and future, the overarching narrative of persistent inflation in major economies continues to be a key talking point. Silver, often seen as a hedge against inflation, can benefit from rising price levels. However, this potential upside is frequently counteracted by central banks' responses to inflation, namely tightening monetary policy through interest rate hikes. The delicate balance between inflation fears driving safe-haven demand and the prospect of higher rates cooling economic activity (and thus industrial demand for silver) creates a tug-of-war.
The market's reaction to upcoming economic data releases will be crucial. For instance, any unexpected figures on inflation (like CPI or PCE) or employment (like Non-Farm Payrolls) that deviate significantly from forecasts can trigger sharp price movements in currencies and commodities. If inflation proves more stubborn than anticipated, it could bolster demand for inflation hedges like silver. Conversely, strong employment or growth data might fuel expectations of further monetary tightening, potentially pressuring silver. The sparse economic calendar provided for the upcoming week limits a deep dive into specific upcoming events, but the general principle holds: any data that influences interest rate expectations or inflation outlook will directly impact XAGUSD. The market's interpretation of these data points, and how they align with or diverge from central bank commentary, will be key.
Central bank actions, or inactions, are a constant undercurrent. Even without specific meeting minutes or statements in the provided data, the general monetary policy stance of major central banks like the Federal Reserve, the European Central Bank, and the Bank of Japan remains a critical factor. If inflation remains elevated, central banks may be forced to maintain a hawkish stance or even consider further tightening, which generally supports currencies like the USD and puts pressure on commodities. Conversely, signs of economic slowdown or falling inflation could lead to a more dovish outlook, potentially benefiting silver. The current strength of the DXY at 99.91 suggests that, at present, the market is pricing in a relatively firm stance from the Fed, or at least a lack of immediate dovish pivot signals.
The interplay between industrial demand and investment demand also shapes silver's fundamental picture. As a key component in electronics, solar panels, and various industrial processes, silver's price is sensitive to global economic growth. The sharp decline in major equity indices like the S&P 500 (down 2% to 6357.55) and Nasdaq (down 2.23% to 23092.5) suggests a potential slowdown in economic activity or a risk-off sentiment that could dampen industrial demand. However, silver's role as a precious metal and a store of value can provide a counterbalancing force, especially if geopolitical risks escalate or inflation concerns resurface strongly. This duality means silver's price can be influenced by opposing forces simultaneously, making its path complex.
Geopolitical Tensions and Safe-Haven Flows
In times of uncertainty, precious metals often find themselves in the spotlight as safe-haven assets. While the provided economic calendar does not highlight specific geopolitical events for the coming week, the broader global landscape remains a significant backdrop. Escalating tensions in the Middle East, for example, have historically been a catalyst for increased demand for gold and silver, as investors seek refuge from potential market disruptions. The recent news mentioning rising oil prices above $100 due to geopolitical conflict in the Middle East serves as a reminder of how fragile the global stability can be, and how quickly safe-haven demand can surge.
The correlation between geopolitical risk and silver's price is not always immediate or linear, but it's a factor that cannot be dismissed. When global uncertainty rises, capital tends to flow away from riskier assets like equities and emerging market currencies towards perceived safe havens. This can include traditional safe havens like US Treasuries and gold, but also silver, especially when its price is perceived as being undervalued relative to gold or when industrial demand factors are less dominant. The recent sharp sell-off in the S&P 500 (down to 6357.55) and Nasdaq (down to 23092.5) could be interpreted as a sign of increasing risk aversion, which, under certain circumstances, might eventually spill over into increased demand for silver.
However, the strength of the US Dollar currently acts as a competing safe-haven. In periods of global stress, investors often flock to the perceived safety and liquidity of the US dollar. With the DXY at 99.91, approaching the 100 level, the dollar is demonstrating its safe-haven appeal. This can create a scenario where both the dollar and silver benefit from risk-off sentiment, but often the dollar's strength takes precedence, especially in the short term, putting pressure on silver prices. The key for silver investors is to discern whether the dominant safe-haven flow is towards the dollar or towards precious metals, a distinction that often depends on the specific nature and perceived duration of the geopolitical event.
Looking Ahead: Levels to Watch and Potential Scenarios
As we look towards the coming week, the $69.74 price point for XAGUSD remains a focal area. The technical indicators present a bearish bias on longer timeframes, with the daily chart showing a strong downtrend (ADX 30.99) and RSI at 36.34. Key support levels to watch are $65.68, $63.43, and $60.19. On the flip side, resistance levels are situated at $71.18, $74.42, and $76.67. For the bearish thesis to remain intact, silver must decisively break below the $65.68 support. A close below this level on the daily chart would likely trigger further selling, targeting subsequent support levels. The current weakness in the broader equity markets (S&P 500 at 6357.55, Nasdaq at 23092.5) and the strength of the DXY (at 99.91) lend credence to this bearish outlook.
Conversely, a bullish scenario would require silver to overcome the immediate resistance at $71.18. A sustained move above this level, ideally accompanied by increasing volume and improving technical indicators (like a rising RSI above 50 and a MACD crossover), could signal a potential reversal or a significant correction in the downtrend. Such a move might be catalyzed by a sudden shift in geopolitical sentiment, a weaker-than-expected US economic data release that weakens the dollar, or a change in central bank rhetoric. However, given the current technical setup and the prevailing dollar strength, this bullish reversal scenario appears less probable in the short term without significant catalysts.
The neutral scenario, or consolidation, is also a strong possibility, especially if key economic data releases are in line with expectations and geopolitical tensions remain subdued. In this case, XAGUSD might continue to trade within a defined range, potentially between the $65.68 support and the $71.18 resistance. This sideways movement could allow some of the oversold conditions on shorter timeframes to normalize and potentially set the stage for a clearer directional move in the subsequent weeks. Patience will be key for traders navigating this environment, waiting for a decisive break of either the support or resistance levels before committing to a strong directional trade.
Bearish Scenario: Downside Pressure Persists
70% ProbabilityNeutral Scenario: Range-Bound Consolidation
20% ProbabilityBullish Scenario: Reversal Potential
10% ProbabilityFrequently Asked Questions: XAGUSD Analysis
What happens if XAGUSD breaks below the key support at $65.68?
A decisive break below $65.68 on the daily chart would invalidate any short-term consolidation hopes and likely accelerate the downtrend. This would open the door for targets at $63.43 and potentially extend towards $60.19 as traders react to the confirmed bearish signal.
Should I consider buying XAGUSD at current levels around $69.74 given the bearish signals?
Buying at current levels around $69.74 is not advisable given the prevailing bearish trend indicated by daily RSI (36.34) and MACD. A more prudent approach would be to wait for a confirmed break of resistance at $71.18 or a test of lower support levels like $65.68, assessing the risk-reward ratio carefully before entering a trade.
Is the daily RSI at 36.34 a sell signal for XAGUSD right now?
An RSI of 36.34 on the daily chart indicates a bearish trend is in play, but it is not yet in the oversold territory (typically below 30). While it suggests downward momentum, it's best used in conjunction with other indicators and price action. A confirmed break below support would strengthen this bearish interpretation.
How will the strong DXY at 99.91 affect XAGUSD next week?
The strong DXY at 99.91, nearing the 100 mark, is likely to continue exerting downward pressure on XAGUSD. This correlation suggests that unless the DXY falters significantly due to unexpected economic data or geopolitical shifts, silver may struggle to find upward momentum and could remain range-bound or trend lower.
The path forward for silver hinges on its ability to either reclaim key resistance levels or succumb to the prevailing bearish pressure. While short-term charts might offer flickers of hope, the longer-term technicals and the strong dollar environment suggest caution is warranted. Traders should remain vigilant, paying close attention to the $65.68 support and $71.18 resistance levels. The market is cyclical, and while the current trend favors the bears, opportunities will emerge for disciplined traders who wait for clear signals and manage their risk effectively.
Track markets in real-time
AI-powered analysis, technical indicators and real-time price data.
Join Our Telegram Channel
Breaking market news, AI analysis and trading signals instantly.
Join Channel