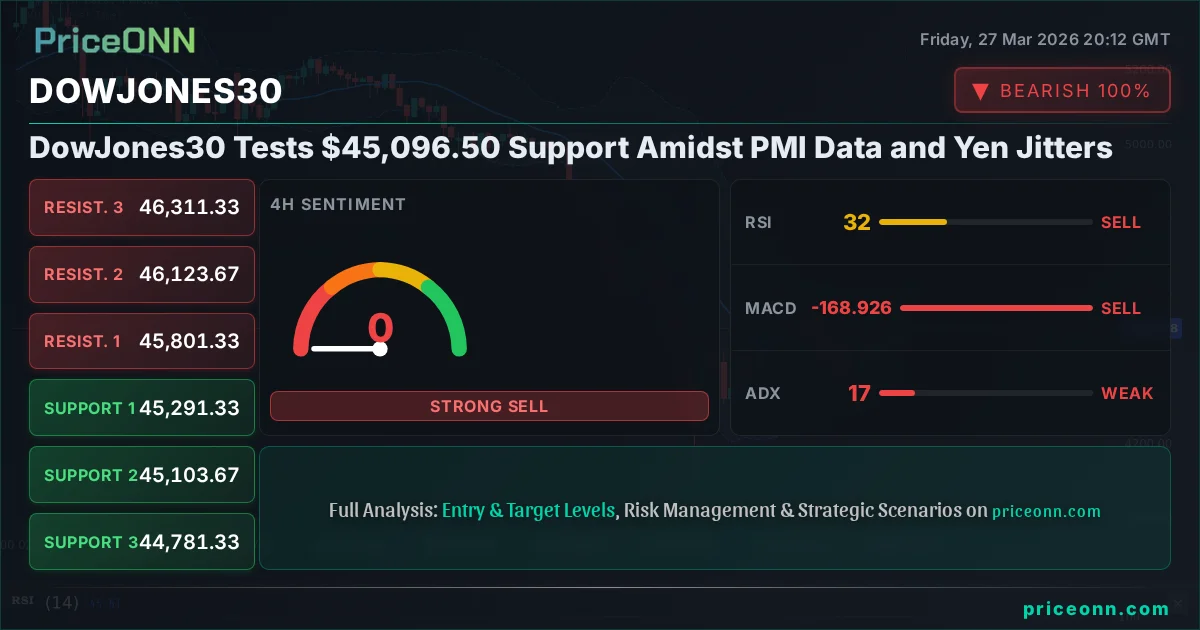
DowJones30 Tests $45,096.50 Support Amidst PMI Data and Yen Jitters
DowJones30 hovers around $45,096.50 as traders digest mixed PMI data and growing concerns over the Japanese Yen's volatility. Key levels are being closely watched for potential directional cues.
The DowJones30 index finds itself at a critical juncture, currently trading around the $45,096.50 mark. This level is under intense scrutiny as investors grapple with a confluence of factors, including recent Purchasing Managers' Index (PMI) data releases and escalating anxieties surrounding the Japanese Yen's rapid depreciation. The market sentiment is decidedly cautious, with traders keenly observing whether key support levels can hold firm or if further downside is imminent.
- The DowJones30 is trading at $45,096.50, testing critical support levels.
- Recent PMI data showed mixed signals, with some regions indicating expansion while others suggest slowing momentum.
- Growing concerns over the Japanese Yen's weakening against the US Dollar are contributing to global risk aversion, potentially impacting US equities.
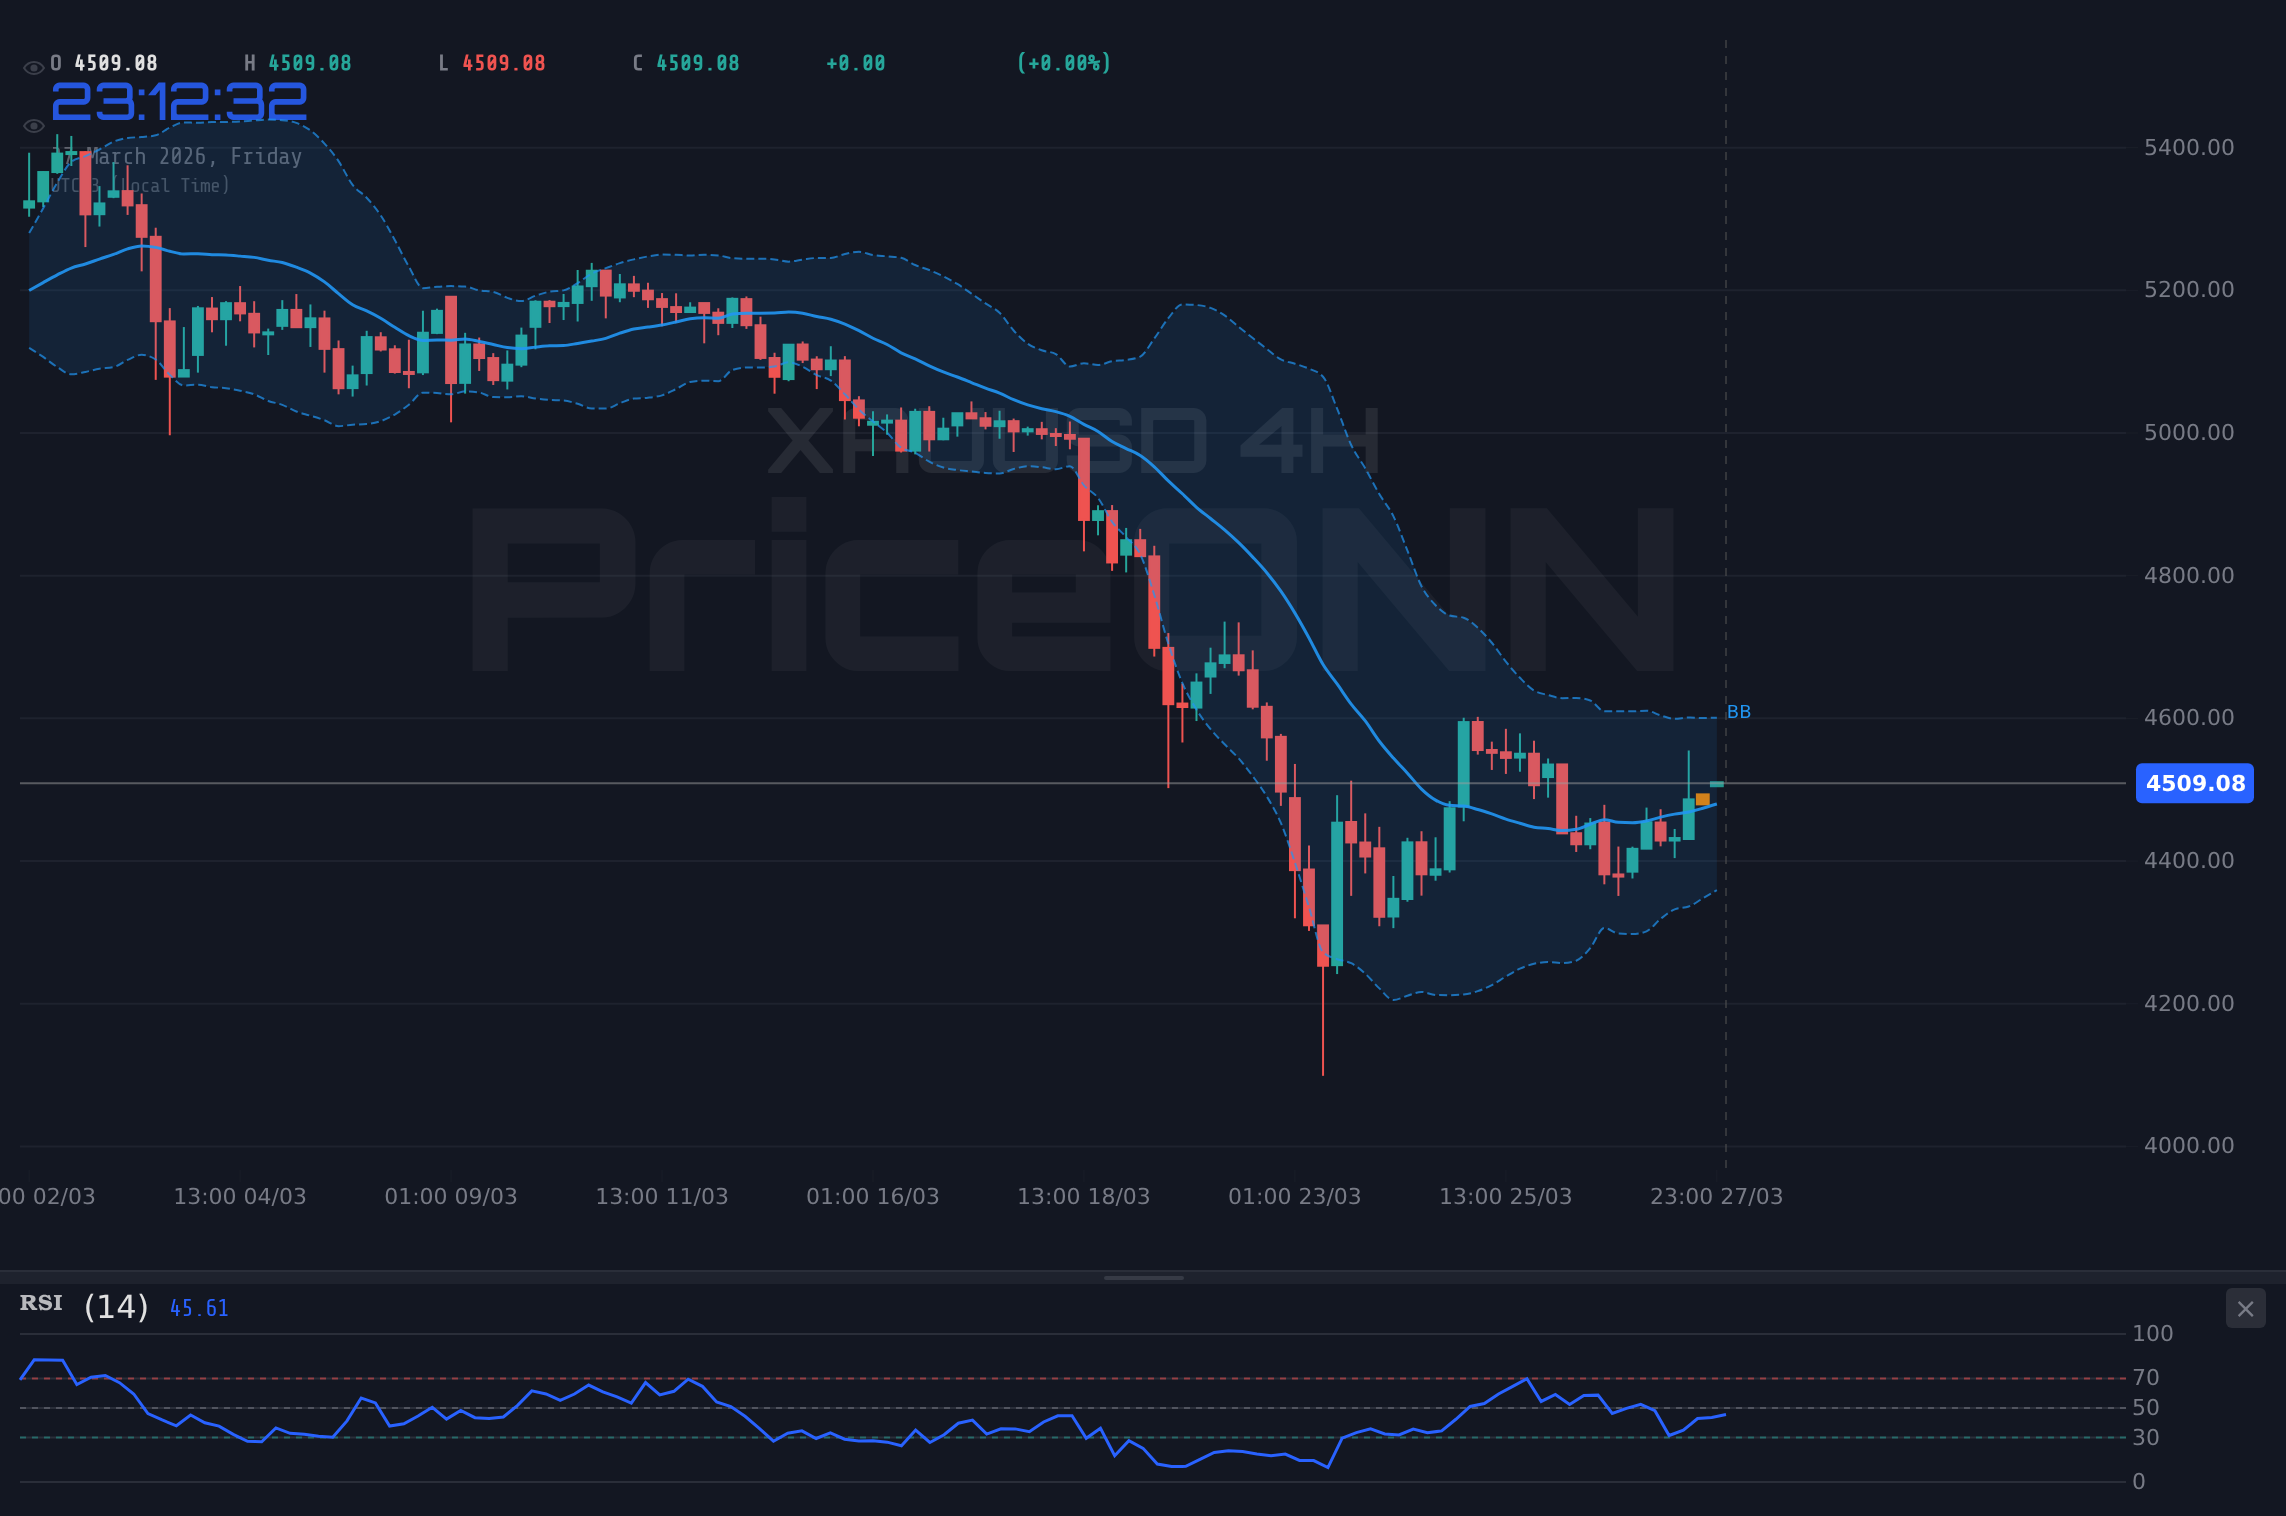
- Technical indicators suggest a neutral to bearish short-term outlook, with RSI at 22.48 on the 1H chart indicating oversold conditions but ADX at 28.4 signaling a strong downtrend.
- Key support for the DowJones30 lies at $45,084.67, while resistance is seen around $45,294.67.
The economic calendar has been a focal point recently, with the latest PMI figures offering a complex picture. While some regions reported expansion, suggesting underlying economic resilience, the overall trend indicates a potential deceleration. For instance, the US Services PMI came in at 52.4, exceeding the forecast of 51.5, which initially offered a glimmer of optimism. However, this was juxtaposed with the US Composite PMI, which registered 51.1, falling short of the anticipated 52. This divergence highlights an uneven economic landscape, making it challenging for market participants to establish a clear direction. The strength of the US Dollar Index (DXY), currently trading around 99.91, further complicates the narrative, as a stronger dollar typically exerts downward pressure on equities and commodities.
Adding to the market's unease are the persistent jitters surrounding the Japanese Yen (USDJPY). The USDJPY pair has surged past 160.201, a level not seen in decades, fueled by the widening interest rate differential between the Bank of Japan and other major central banks. Former BoJ Governor Haruhiko Kuroda's comments advocating for policy normalization have done little to stem the tide, leaving traders questioning the effectiveness of current monetary policy. This rapid yen depreciation isn't just a forex market phenomenon; it has broader implications for global risk appetite. A sharply weakening currency can signal underlying economic stress or lead to speculative flows that destabilize other markets. The current strength of the DXY, at 99.91, is partly a reflection of the yen's weakness, as the dollar gains against a basket of currencies, including the yen.
The Bull's Roadmap: Navigating Towards Higher Ground
For the bulls to regain control and push the DowJones30 higher, several conditions must be met. The immediate hurdle is to reclaim and hold the $45,189.67 support level, which is currently being tested. A decisive break and sustained price action above this level would be the first sign of renewed buying interest. Following this, the index would need to challenge the immediate resistance at $45,294.67. A successful breach of this resistance, ideally on increased trading volume, would open the door for a move towards the next significant hurdle at $45,352.33. The $45,352.33 level is particularly important as it represents a key psychological and technical barrier. If the bulls can firmly establish a foothold above this price point, it could signal the beginning of a more substantial upward correction, potentially targeting levels around $45,399.67 and beyond.
From a technical standpoint, several indicators would need to align to support a bullish reversal. The Relative Strength Index (RSI) on the 1-hour chart is currently at 22.48, firmly in oversold territory. A move back above 30, and ideally towards 50, would be a prerequisite for sustained upside. Similarly, the Stochastic Oscillator, with %K at 3.32 and %D at 10.2, also indicates extreme oversold conditions, suggesting a potential short-term bounce. However, the ADX at 28.4 on the 1-hour chart, and 16.76 on the 4-hour chart, points to a strong existing downtrend or a lack of trend, respectively. For a bullish scenario to gain traction, we would ideally want to see the ADX on the shorter timeframes decrease while momentum indicators like MACD show a bullish crossover and positive histogram development. The 1-day chart, however, presents a more challenging picture, with RSI at 26.9 and ADX at 41.96, both indicating a strong downtrend and oversold conditions that have yet to translate into a confirmed reversal. Therefore, any bullish move would likely be a counter-trend rally initially, requiring significant conviction to develop into a sustained uptrend.
The fundamental backdrop would also need to shift favorably. A less hawkish tone from the Federal Reserve, perhaps signaled by revised interest rate expectations or softer inflation data in upcoming reports, could provide a significant tailwind. Market participants are closely watching for any indication that the Fed might be considering a pause or even a pivot, though recent inflation concerns, as highlighted by the rising DXY and energy prices, make this unlikely in the short term. Geopolitical de-escalation, particularly any positive developments in ongoing global conflicts or trade disputes, would also be a welcome catalyst for risk assets like the Dow Jones. The current environment of heightened geopolitical tension, exemplified by the energy crisis and the weak Yen, fuels demand for safe-haven assets, acting as a headwind for equities.
Where Bears Take Control: Descending Towards Lower Ground
Conversely, the bearish scenario appears to have significant technical backing, given the prevailing downtrend. If the DowJones30 fails to hold the current $45,096.50 level, the immediate target would be the support at $45,084.67. A break below this level, especially if accompanied by increased selling volume, could trigger further declines towards $45,034.67. This level represents a significant psychological threshold, and a breach could accelerate selling pressure, leading to a test of the next support at $44,938.67. Should this support give way, the path would be cleared for a more aggressive sell-off, potentially targeting the $44,781.33 level on the 4-hour chart. The daily chart's support levels, starting at $45,771.33, $45,507.67, and $45,116.33, suggest that a sustained break below current price action could lead to substantial further losses if broader market sentiment deteriorates significantly.
Technically, the indicators on multiple timeframes paint a predominantly bearish picture for the immediate future. The 1-hour chart shows RSI at 22.48 and Stochastic %K at 3.32, both deeply oversold. However, the ADX at 28.4 indicates a strong downtrend is in play, suggesting that these oversold conditions could persist or even deepen before any meaningful bounce occurs. The MACD on the 1-hour chart is negative, and while the 4-hour MACD shows positive momentum, it is still below the signal line, offering little comfort to bulls. The daily chart's ADX at 41.96 is particularly concerning, signaling a very strong downtrend, which implies that current price levels might not be the final destination. The RSI at 26.9 on the daily chart reinforces this bearish sentiment, suggesting ample room for further downside before reaching oversold territory that might trigger a sustained reversal. The Bollinger Bands on the hourly and daily charts are also situated below the middle band, indicating bearish pressure.
Fundamentally, a continuation of the current macro environment would favor the bears. Persistent inflation fears, coupled with the Federal Reserve's potential reluctance to cut rates or even the unlikely prospect of a hike, would likely continue to weigh on risk assets. The strength of the DXY, currently around 99.91, is a testament to the dollar's resilience, driven by higher yields and safe-haven demand. This dollar strength is a direct headwind for US equities like the Dow Jones. Furthermore, any escalation in geopolitical tensions or negative surprises from upcoming economic data releases, such as weaker-than-expected employment figures or a significant miss in GDP growth, could trigger a flight to safety, further pressuring the index. The energy crisis, marked by rising Brent crude prices to $109.43 and WTI to $100.24, also contributes to inflation concerns, creating a challenging environment for equity markets.
The Waiting Game: Caught in Consolidation's Grip
A neutral, range-bound scenario for the DowJones30 is also plausible, particularly if conflicting signals prevent a clear directional move. This scenario would likely involve the index trading between the immediate support at $45,084.67 and resistance at $45,194.67. Within this range, price action might become choppy, characterized by failed attempts to break key levels and a general lack of conviction from market participants. Such consolidation could be driven by a standoff between bulls and bears, or by traders adopting a wait-and-see approach ahead of significant economic events, such as crucial inflation or employment reports. The current ADX readings, particularly the weaker 16.76 on the 4-hour chart, do suggest a lack of strong trend, which could support a period of consolidation.
In this neutral scenario, technical indicators might offer mixed signals. For instance, the 1-hour RSI could hover around the 50 level, indicating neither overbought nor oversold conditions. The Stochastic Oscillator might fluctuate around its mid-levels, showing indecision. MACD could potentially cross back and forth over its signal line without establishing a clear directional momentum. Bollinger Bands might hug the middle band, reflecting a lack of volatility expansion. This period of consolidation could serve as a 'cooling-off' phase after a sharp move, allowing market participants to reassess the fundamental landscape. However, such periods often precede a significant breakout, as energy builds up within the range. The key would be to watch for contraction in the Bollinger Bands and a decrease in the ADX, which often precedes a new trend initiation.
From a fundamental perspective, a neutral outlook could be sustained if incoming data fails to provide a clear directional impetus. For example, if PMI figures continue to be mixed, and inflation remains sticky without accelerating dramatically, the Federal Reserve might maintain its current policy stance, leading to market uncertainty. Similarly, if geopolitical developments remain in a state of flux without significant escalation or resolution, risk sentiment could remain tepid. In such a scenario, the DowJones30 might lack the catalysts needed for a decisive move in either direction, leading to a period of sideways trading. This would be particularly true if key economic releases, like the upcoming [USD] data, come in largely as expected, offering no major surprises to shift market expectations.
The Most Likely Path Forward: A Probabilistic View
Considering the current technical setup and fundamental backdrop, the bearish scenario currently holds the highest probability. The strong downtrend indicated by the daily ADX (41.96) and RSI (26.9), coupled with the oversold conditions on shorter timeframes that haven't yet translated into a confirmed reversal, suggests that further downside is more likely in the immediate term. The persistent strength of the DXY (99.91) and the ongoing concerns surrounding the Japanese Yen's sharp depreciation further bolster this view. The current price action around $45,096.50 is being tested as support, and a break below $45,084.67 would likely confirm the continuation of the bearish trend. We assign a probability of approximately 65% to this bearish outcome for the coming week.
The neutral, consolidation scenario is the next most likely, holding a probability of around 25%. This would unfold if the market finds footing at current levels and fails to break decisively lower, perhaps awaiting more concrete data or central bank signals. A sustained hold above $45,084.67, with price action consolidating between $45,084.67 and $45,194.67, would fit this profile. This scenario becomes more probable if upcoming economic data surprises to the upside or if geopolitical tensions ease unexpectedly.
The bullish scenario, while offering a potential bounce from oversold levels, appears the least probable in the short term, carrying an estimated probability of 10%. For this to materialize, we would need to see a strong break above immediate resistance levels, coupled with a significant shift in market sentiment, possibly driven by dovish Fed rhetoric or positive geopolitical news. The current technical indicators, particularly on the daily chart, do not strongly support a sustained bullish move without significant catalysts.
Bearish Scenario: Downside Pressure Mounts
65% ProbabilityNeutral Scenario: Range-Bound Volatility
25% ProbabilityBullish Scenario: A Counter-Trend Rally
10% ProbabilityWhat I'm Watching This Week
My focus remains squarely on the $45,084.67 support level. A break below this on the 1-hour chart, especially with accompanying volume and negative news flow, would strongly validate the bearish scenario. Conversely, a sustained hold above $45,096.50, followed by a push above $45,194.67, would suggest the market is preparing for a potential bounce, possibly testing the higher resistance levels. Secondly, I'll be monitoring the DXY's trajectory; any significant move above 100.00 could exacerbate selling pressure on the DowJones30. Finally, I'm keeping an eye on the Japanese Yen. If USDJPY continues its relentless climb past 160.50, it could signal broader market instability and increased risk aversion, which typically weighs heavily on US indices.
Frequently Asked Questions: DowJones30 Analysis
What happens if the DowJones30 breaks below the $45,084.67 support level?
If the DowJones30 closes below $45,084.67 on the 1-hour chart, it would likely trigger further selling pressure, targeting $45,034.67 and potentially $44,938.67. This would confirm the continuation of the bearish trend, especially if accompanied by negative news or a strong DXY.
Should I consider buying the DowJones30 at current levels around $45,096.50 given the oversold RSI?
While the RSI at 22.48 suggests oversold conditions on the 1-hour chart, the strong daily downtrend (ADX 41.96) indicates that buying prematurely could be risky. A confirmed bullish reversal trigger, such as a hold above $45,194.67 with strong volume, would be needed before considering long positions, carrying a lower probability currently.
Is the MACD signal on the daily chart a sell signal for the DowJones30?
The MACD on the daily chart is currently negative and below its signal line, which is generally interpreted as a bearish signal, confirming the overall downtrend. However, on the 1-hour chart, MACD momentum is negative but showing potential for a bounce, highlighting conflicting signals across timeframes.
How might the upcoming [USD] PMI data impact the DowJones30 this week?
The release of upcoming [USD] economic data, particularly if it shows further signs of slowing momentum or persistent inflation, could significantly influence the DowJones30. Stronger-than-expected data might offer temporary relief, while weaker figures could exacerbate the current bearish sentiment, especially if it prompts a reassessment of Fed policy expectations.
Track markets in real-time
AI-powered analysis, technical indicators and real-time price data.
Join Our Telegram Channel
Breaking market news, AI analysis and trading signals instantly.
Join Channel