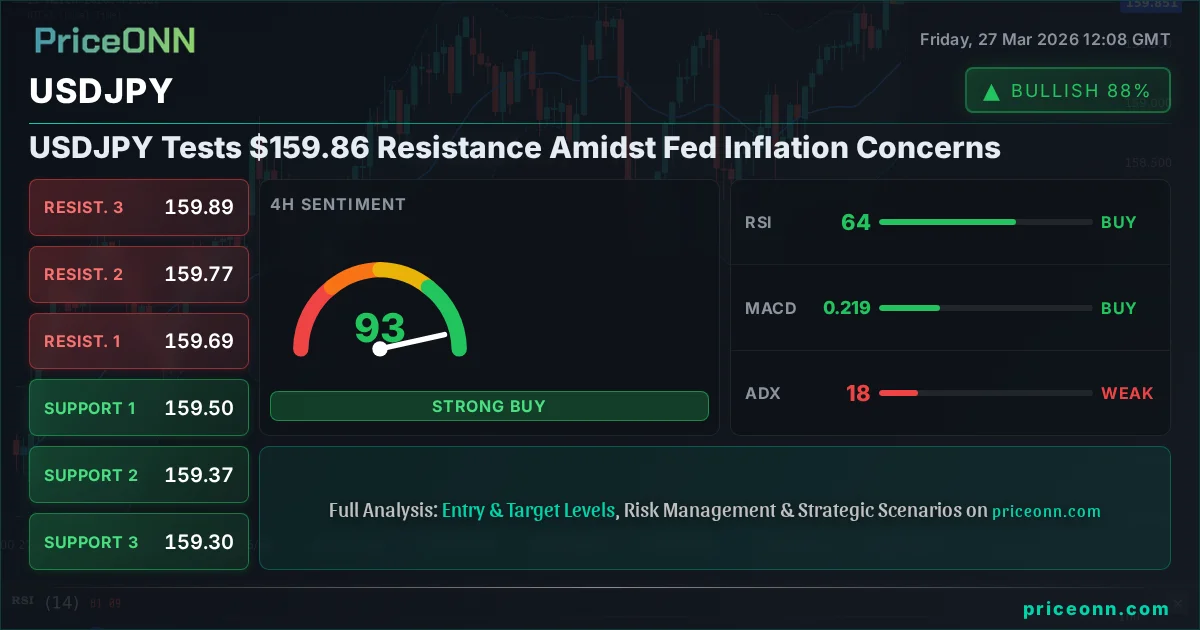
USDJPY Tests $159.86 Resistance Amidst Fed Inflation Concerns
USDJPY is testing $159.86 as the DXY strengthens on renewed Fed inflation worries. Technicals show mixed signals, with 1H and 4H leaning bearish but 1D bullish.
The relentless march of USDJPY continues, with the pair currently hovering around the critical $159.86 mark. This level represents not just a psychological barrier but a significant confluence of technical resistance and fundamental undercurrents. As traders eye this pivotal point, the question on everyone's mind is whether the yen's weakness will persist, or if the Bank of Japan will intervene, or if the Federal Reserve's hawkish stance on inflation will ultimately tip the scales. The current price action paints a complex picture, demanding a closer look at the intricate dance between global risk sentiment, monetary policy expectations, and the ever-present specter of currency intervention.
- USDJPY is currently trading at $159.86, testing key resistance levels.
- The US Dollar Index (DXY) is near 99.93, indicating dollar strength that typically pressures USDJPY's counterpart.
- On the 1-hour chart, RSI at 59.78 signals a neutral to slightly bullish trend, but ADX at 21.44 suggests a moderate trend strength.
- The 1-day chart shows USDJPY at $159.86 with RSI at 61.32, indicating a moderately bullish trend, supported by an ADX of 22.41.
- The Fed's renewed focus on inflation risks, as suggested by recent comments, is a key driver for dollar strength.
Navigating the $159.86 Crossroads
The $159.86 level for USDJPY is more than just a number; it's a battleground where bulls and bears are currently locked in a tense standoff. On the 1-hour timeframe, the pair exhibits a strong bullish trend with an ADX reading of 21.44, suggesting a moderate but committed upward momentum. The RSI at 59.78 hovers in neutral territory, indicating room for further upside before hitting overbought conditions. However, this short-term bullishness is tempered by the stochastic indicator, where the %K line (80.89) is above the %D line (79.77), signaling a potential overbought condition that could precede a pullback. This immediate picture suggests caution; while the trend is up, the market might be ripe for a short-term correction or consolidation before its next significant move.
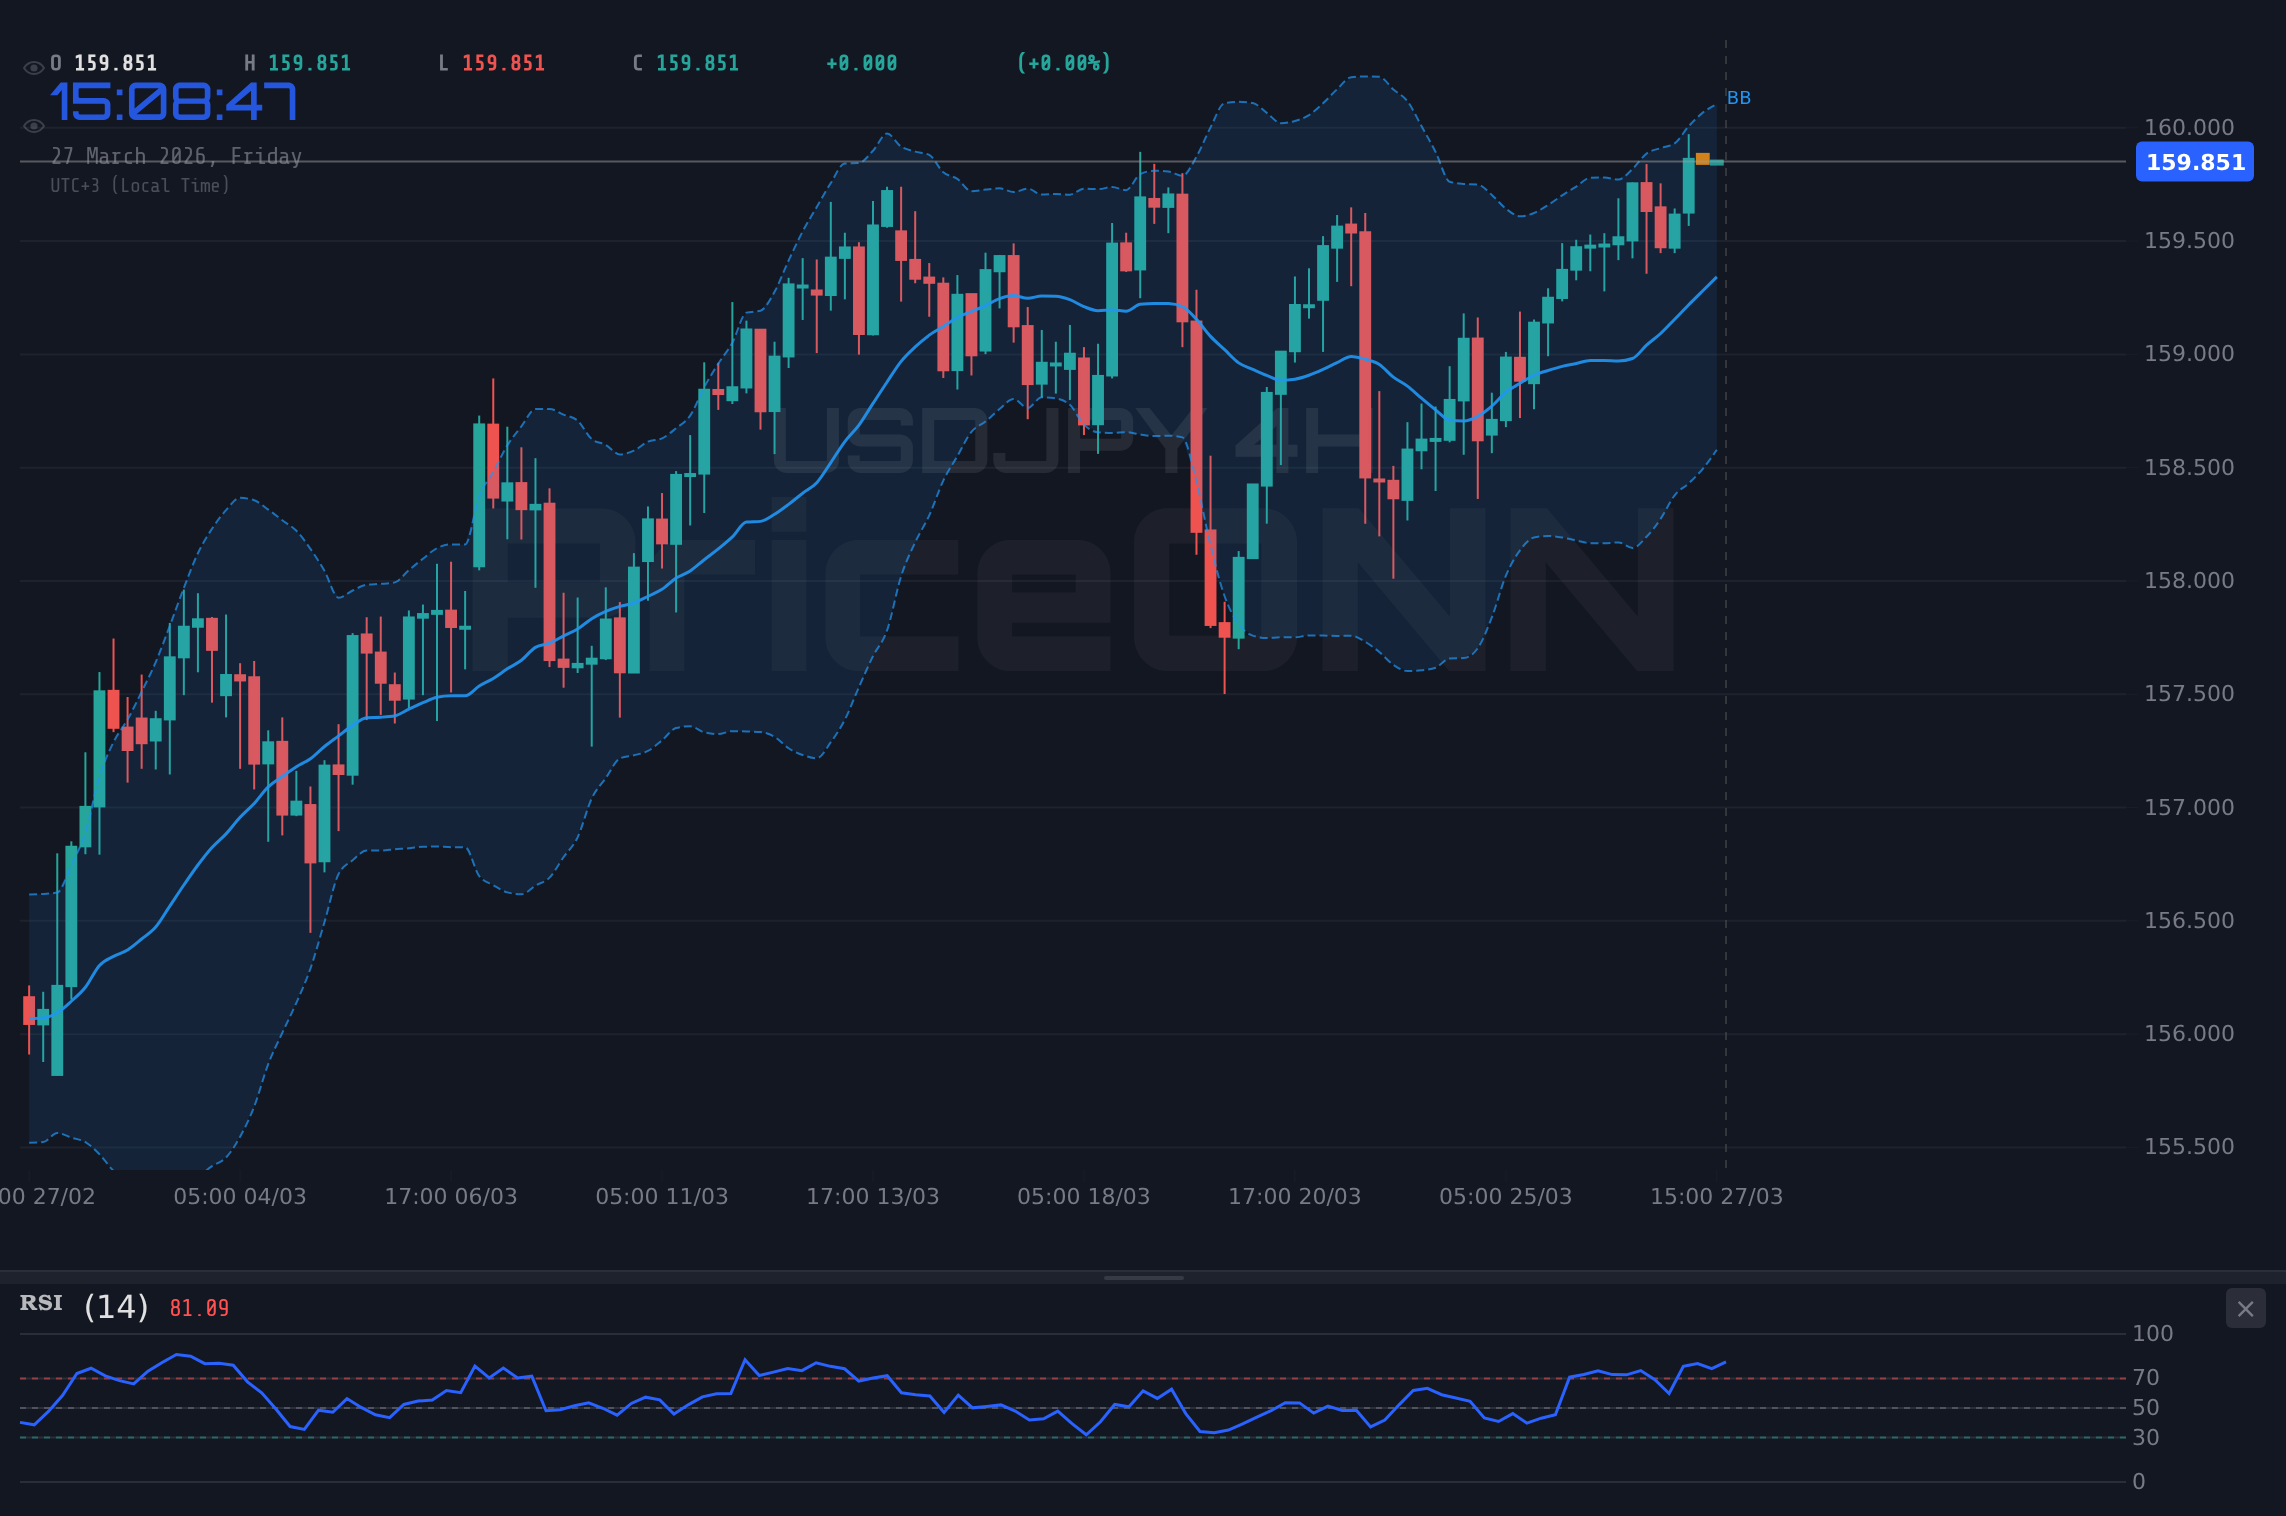
Shifting to the 4-hour chart, the trend remains bullish, albeit with slightly weaker ADX at 17.55, hinting at a less robust trend compared to the 1-hour. The RSI here is at 63.73, still comfortably in neutral territory and suggesting that the upward momentum has not yet reached extreme levels. The stochastic indicator, however, presents a conflicting signal with %K (68.07) below %D (80.93), indicating a potential bearish divergence or an upcoming pullback. This mixed signaling across shorter timeframes underscores the importance of the $159.86 resistance. A decisive break above this level on increased volume could confirm the continuation of the bullish trend, targeting higher resistance points. Conversely, a failure to break through could lead to a retracement, testing the support levels identified around $159.495.
The Daily Picture: A Persistent Bullish Undercurrent
Looking at the daily timeframe, the USDJPY pair displays a clear bullish trend with an ADX of 22.41, indicating a moderately strong trend is in play. The RSI stands at 61.32, comfortably within the bullish zone and far from overbought territory, suggesting that there is still ample room for appreciation. The MACD is also showing positive momentum, with the MACD line above its signal line, reinforcing the bullish sentiment. The stochastic indicator on the daily chart, with %K at 87.62 and %D at 61.61, is flashing an overbought signal. This divergence between the RSI and stochastic on the daily chart is crucial; while the overall trend is bullish, the stochastic’s extreme reading suggests that the market may be due for a period of consolidation or a pullback before the trend can resume with full force. This is where patience becomes a trader's best friend.
The current price action around $159.86 is occurring against a backdrop of significant macroeconomic factors. The US Dollar Index (DXY) is showing renewed strength, currently trading near 99.93. This strengthening dollar is a critical correlation to watch for USDJPY. Typically, a rising DXY exerts upward pressure on USDJPY, as the dollar gains value against a basket of major currencies, including the yen. Recent news highlights that Federal Reserve officials are signaling a renewed focus on inflation risks, which could imply a more hawkish stance or a delay in anticipated rate cuts. This narrative directly supports dollar strength and, by extension, the bullish case for USDJPY. The market's interpretation of Fed commentary is paramount here; any hint of a continued hawkish bias could provide the catalyst needed to push USDJPY decisively above $159.86.
The Dollar's Resurgence and its Impact
The strengthening US Dollar Index (DXY) is a significant tailwind for USDJPY. With the DXY currently near 99.93, this broad-based dollar strength is a key driver. The DXY's upward trajectory suggests that global investors are favoring the greenback, potentially due to perceived economic stability, higher interest rate differentials, or its safe-haven status amidst geopolitical uncertainties. The news that Fed officials are increasingly signaling a renewed focus on inflation risks is particularly impactful. This suggests that the Fed might be less inclined to cut interest rates, or even considering further tightening if inflation proves 'stubborn.' Such a scenario would typically widen the interest rate differential between the US and Japan, making dollar-denominated assets more attractive and thus boosting USDJPY. Traders are closely watching any official statements for confirmation of this hawkish pivot.
The correlation between the DXY and USDJPY is undeniable. When the dollar strengthens, USDJPY tends to rise. The current DXY level of 99.93 indicates a robust dollar. This is further amplified by the fact that the US has a positive interest rate differential compared to Japan's persistently low rates. This carry trade dynamic, where investors borrow in a low-interest-rate currency (JPY) to invest in a higher-interest-rate currency (USD), remains a powerful underlying force supporting USDJPY. The news mentioning escalating geopolitical tensions threatening global energy security also plays a role. In times of global unease, the US dollar often acts as a safe-haven asset, further bolstering the DXY and consequently USDJPY.
What About the Yen? Intervention Watch
Despite the strong bullish momentum in USDJPY, the specter of Japanese currency intervention looms large. The yen has been weakening significantly, and any sharp, disorderly moves can prompt the Ministry of Finance and the Bank of Japan (BOJ) to step into the market to support their currency. While the current price action around $159.86 might not yet trigger direct intervention, sustained upward pressure could increase the likelihood. Historically, intervention levels are often closely guarded secrets, but traders watch for specific price points or rates of change that might signal official concern. The BOJ's monetary policy remains a key differentiator; while the Fed grapples with inflation, the BOJ has maintained an ultra-loose policy, widening the interest rate gap. However, any shift in the BOJ's stance, however unlikely it seems now, would dramatically alter the USDJPY trajectory.
The fundamental divergence between the US and Japanese economies continues to fuel USDJPY's rise. The US economy, despite inflation concerns, shows resilience, while Japan continues to grapple with deflationary pressures and an aging population. This economic disparity underpins the interest rate differential that favors the dollar. However, traders must remain vigilant. If USDJPY continues its ascent rapidly without significant pullbacks, the risk of intervention increases. It's a delicate balance: the market wants to push higher, but the authorities might step in to prevent excessive yen depreciation. This dynamic adds a layer of complexity to trading USDJPY, requiring strict risk management and an awareness of potential 'black swan' events related to intervention.
Technical Indicators: A Mixed Bag at Resistance
Diving deeper into the technical indicators, the picture at $159.86 is far from uniform. On the 1-hour chart, the ADX at 21.44 indicates a moderate trend, while the RSI at 59.78 suggests there's still room for growth before hitting overbought territory. However, the stochastic oscillator is showing %K at 80.89 and %D at 79.77, which is a clear warning of an overbought condition on this timeframe. This conflict suggests that the short-term bullish momentum might be losing steam and a pullback is possible. The Bollinger Bands on the 1H chart are also trading above the middle band, reinforcing the short-term bullish bias, but the stochastic divergence is a red flag.
The 4-hour chart presents a similar dichotomy. The ADX at 17.55 points to a weaker trend compared to the 1-hour, and the RSI at 63.73 is still in neutral territory. Yet, the stochastic shows %K at 68.07 and %D at 80.93, a bearish crossover and a signal of potential downside. This is a critical point: while the trend might still be technically bullish on this timeframe, the stochastic is suggesting a reversal or at least a significant pause. The Bollinger Bands on the 4H are below the middle band, which contradicts the bullish sentiment seen on the 1H chart and adds to the confusion. Traders need to reconcile these conflicting signals; the overall trend might be up, but the shorter-term indicators are warning of potential headwinds.
On the daily chart, the picture is more consistent. The ADX at 22.41 indicates a moderate uptrend, and the RSI at 61.32 is in bullish territory, far from overbought. The MACD is also showing positive momentum. However, the daily stochastic is flashing a strong overbought signal with %K at 87.62 and %D at 61.61. This is the most significant conflicting signal. It suggests that while the longer-term trend remains bullish, the market is significantly stretched and due for a correction. This overbought condition on the daily stochastic is a key factor for traders to consider. A failure to break decisively above $159.86 might lead to a deeper retracement, especially if this daily stochastic reading continues to hold.
Scenario Analysis: What Lies Ahead for USDJPY?
Bullish Scenario: Breaking the Yen's Back
45% ProbabilityConsolidation Scenario: Caught Between Hawks and Intervention Fears
40% ProbabilityBearish Scenario: Yen's Last Stand?
15% ProbabilityThe interplay between the Federal Reserve's inflation fight and the Bank of Japan's accommodative stance is the dominant theme for USDJPY. While the daily trend remains bullish, the overbought stochastic on the daily chart, coupled with the $159.86 resistance and the ever-present threat of intervention, creates significant uncertainty. A break above $159.86, especially if accompanied by hawkish Fed commentary and strong US economic data, could propel the pair higher. However, failure to break this key level might lead to a period of consolidation or a deeper pullback, particularly if the market perceives intervention risks to be rising.
Frequently Asked Questions: USDJPY Analysis
What happens if USDJPY breaks above $159.86 resistance?
A decisive break above $159.86, particularly on increased volume and supported by hawkish Fed rhetoric or strong US economic data, could signal a continuation of the bullish trend. This might target the next resistance levels around $160.15 and potentially $160.45, especially if the DXY continues its ascent.
Should I consider buying USDJPY at current levels of $159.86 given the mixed signals?
Buying at $159.86 presents a high-risk, moderate-reward scenario due to the confluence of resistance and conflicting technical signals, particularly the daily stochastic being overbought. A more prudent approach might be to wait for a confirmed breakout above $159.86 with solid follow-through, or for a pullback towards support levels like $159.495 to assess potential buying opportunities with a better risk-reward ratio.
Is the daily stochastic at 87.62 a strong sell signal for USDJPY?
While a stochastic reading of 87.62 on the daily chart is a strong overbought signal, it doesn't automatically equate to a sell. It indicates that the market is significantly extended and due for a correction or consolidation. This signal becomes more potent if USDJPY fails to break above $159.86 resistance or if it shows bearish divergence against other indicators.
How will upcoming Fed inflation data affect USDJPY this week?
Upcoming US inflation data, such as CPI or PCE, will be critical. If inflation comes in hotter than expected, it would likely reinforce the Fed's hawkish stance, strengthen the DXY, and push USDJPY higher towards resistance levels. Conversely, cooler-than-expected inflation could lead to dollar weakness and a potential pullback in USDJPY.
| Indicator | Value | Signal | Interpretation |
|---|---|---|---|
| RSI (14) | 61.32 | Bullish | Comfortably in bullish territory, room to run. |
| MACD Histogram | Positive | Bullish | Positive momentum supporting the trend. |
| Stochastic (%K/%D) | 87.62 / 61.61 | Overbought | Market is extended, potential for pullback. |
| ADX | 22.41 | Moderate Trend | Trend strength is present but not extreme. |
| Bollinger Bands | Middle Band Above | Bullish | Price is trading above the mean, suggesting upward pressure. |
Track markets in real-time
AI-powered analysis, technical indicators and real-time price data.
Join Our Telegram Channel
Breaking market news, AI analysis and trading signals instantly.
Join Channel