Silver Tumbles: XAGUSD Tests Support Near $68.76 Amidst Dollar Strength
Silver (XAGUSD) drops to $68.76, testing critical support levels as the US Dollar Index (DXY) surges. This analysis explores the key drivers and scenarios shaping silver's near-term outlook.
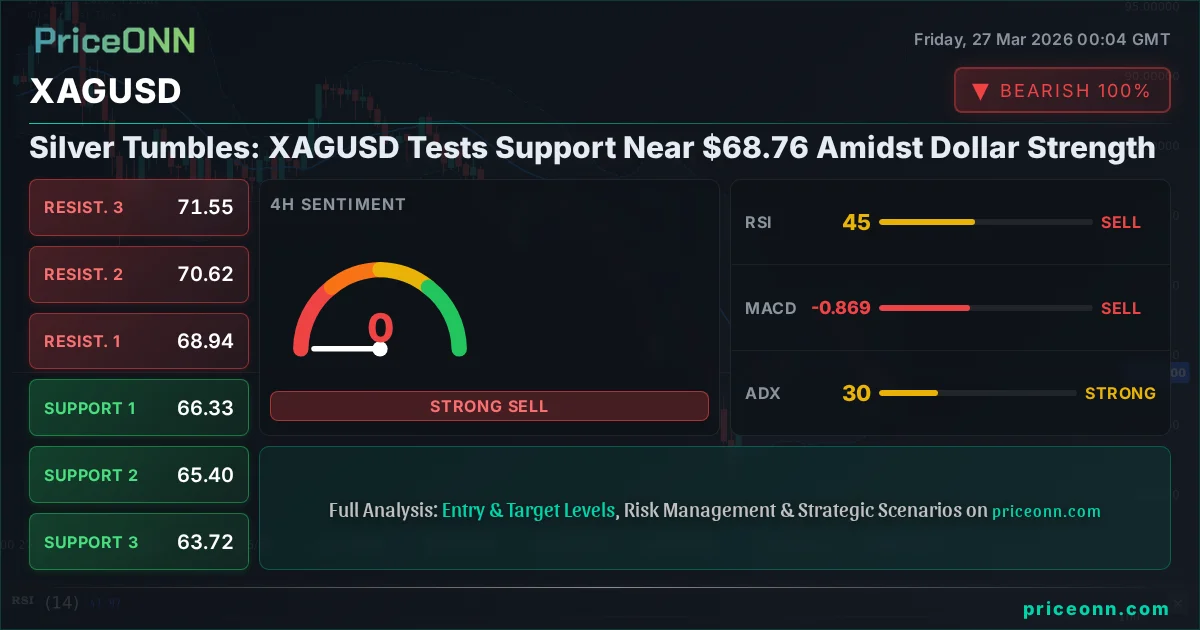
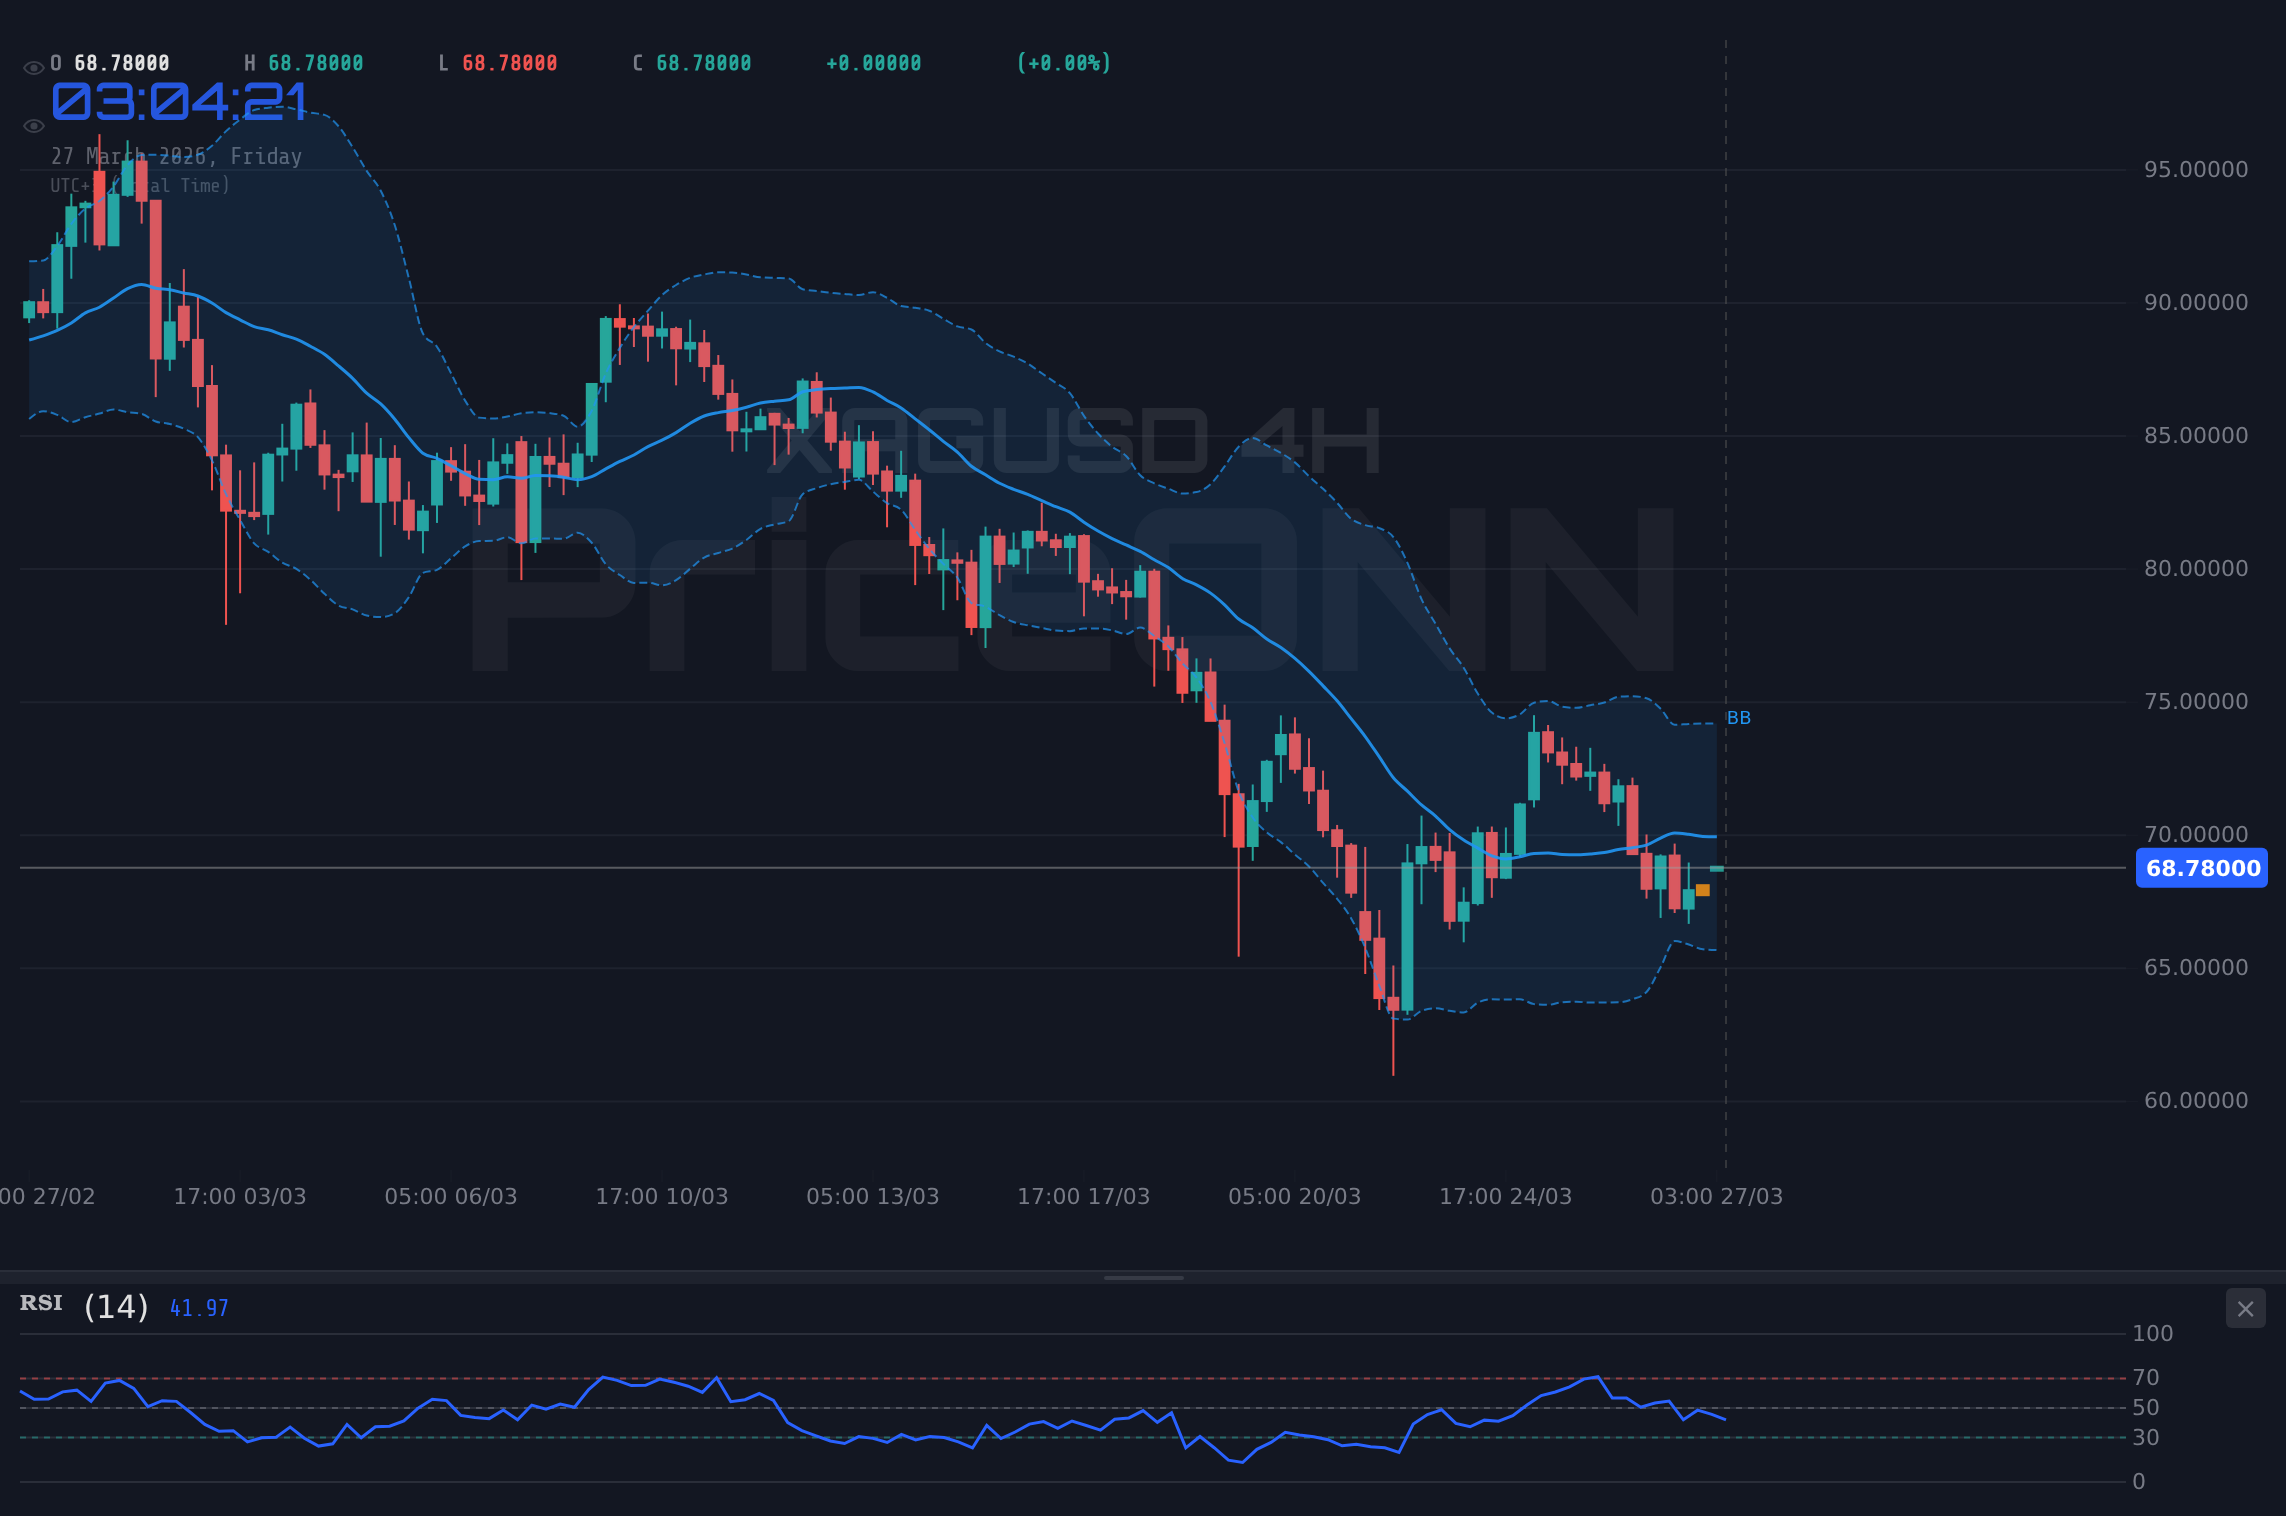
The sharp decline in silver prices, with XAGUSD currently trading at $68.76, presents a critical juncture for the precious metal. A significant drop of -3.43% on the day, pushing the price from its recent highs, has brought key support levels into focus. This move isn't happening in a vacuum; the strengthening US Dollar Index (DXY), which has surged 0.35% to 99.64, is exerting considerable downward pressure across commodities, particularly gold and silver. Understanding the interplay between these forces is crucial for navigating the current market volatility and anticipating silver's next move. The question on many traders' minds is whether this dip represents a temporary correction or the start of a more sustained downturn.
- XAGUSD is currently trading at $68.76, down -3.43% today, signaling significant bearish pressure.
- The critical support level for XAGUSD is currently at $68.31, with further downside targets at $67.78.
- The US Dollar Index (DXY) is strengthening, currently at 99.64, which typically correlates with downward pressure on silver.
- Technical indicators show conflicting signals: RSI is neutral but trending down, while Stochastic suggests a potential short-term rebound.
The Dollar's Grip: How DXY Strength Impacts Silver
The current market narrative is heavily influenced by the resurgence of the US Dollar Index (DXY). As the DXY climbs, currently at 99.64, it exerts a significant inverse pressure on dollar-denominated assets like silver. When the dollar strengthens, it becomes more expensive for holders of other currencies to purchase commodities priced in USD, thereby dampening demand. This dynamic is particularly potent for precious metals, which often serve as alternative stores of value. The DXY's move is supported by strong momentum, with its 1-hour trend showing 99% strength and a solid ADX of 27.22. This indicates a robust upward trend in the dollar, making it challenging for silver to find footing. Traders are closely watching if the DXY can maintain its momentum above the 99.73 resistance level; a sustained break higher would likely exacerbate the selling pressure on XAGUSD.
This correlation is not merely theoretical. Historically, periods of dollar strength have coincided with pullbacks in gold and silver prices, as global investors rotate towards perceived safer, higher-yielding dollar-denominated assets. The current macroeconomic backdrop, potentially including anticipation of certain economic data releases, could be fueling this dollar rally. As we analyze the XAGUSD chart, it's impossible to ignore the palpable impact of the dollar's ascent on the price action.
Silver's Technical Picture: Conflicting Signals Amidst Downtrend
Examining the technical indicators for XAGUSD reveals a complex picture, with signals often pulling in opposite directions. On the 1-hour chart, the overall signal leans towards 'SELL', driven by a strong downward trend (91% strength) and an ADX of 32.09, indicating a firmly established bearish momentum. The RSI(14) is hovering at 43.35, firmly in neutral territory but with a downward bias, suggesting sellers are still in control without being in an overtly oversold condition. However, the Stochastic indicator on the same timeframe presents a different view, with K (45.47) crossing above D (31.75), indicating a potential short-term bullish divergence or a signal for a minor bounce. This conflict is precisely what makes the current price action so critical.
The 4-hour timeframe paints an even more bearish picture, with a 100% trend strength and an ADX of 33.37 reinforcing the conviction of the sellers. Here, the RSI sits at 41.39, again neutral but trending down, while the Stochastic shows a clear bearish signal with K (21.95) below D (31.55). The daily chart also reinforces the dominant downtrend, with an ADX of 29.34. While the daily Stochastic shows a bullish signal (K > D), this is often a lagging indicator in a strong trend and could signify an oversold condition that might precede a bounce, rather than a reversal. The general consensus among technical indicators, especially on the higher timeframes, is overwhelmingly bearish, but the conflicting Stochastic signals warrant attention for short-term traders.
The Bearish Scenario: Testing Lower Support Levels
If the prevailing bearish sentiment, amplified by dollar strength and a firm downtrend across multiple timeframes, continues to dominate, silver is likely to test its immediate support levels. The 1-hour chart identifies key support at $4389.5, followed by $4367.49 and $4354.66. A decisive break below the $4389.5 level would signal a continuation of the current downward move, potentially accelerating towards the next support. The 4-hour chart offers further confirmation, with support located at $4339.59, $4297.78, and $4228.15. These levels represent significant psychological and technical barriers that, if breached, could lead to a more substantial sell-off.
The daily chart's support levels at $4440.66, $4375.01, and $4294.28 are also crucial. A close below the $4375.01 daily support would solidify the bearish outlook and suggest a deeper correction. This scenario is primarily driven by sustained dollar strength (DXY pushing higher towards 100.02 and beyond) and any negative macroeconomic news that might reduce risk appetite. Furthermore, if geopolitical tensions escalate without a corresponding surge in safe-haven demand for gold, silver might remain under pressure due to its industrial component, which is sensitive to global growth outlooks. The prevailing ADX readings across all timeframes (32.09, 33.37, 29.34) suggest that a strong trend is in place, making a continuation of the downtrend a highly probable outcome if key resistance levels remain intact.
The Bullish Scenario: A Potential Rebound from Support?
Despite the overwhelming bearish technicals and the strong dollar, a bullish scenario for XAGUSD cannot be entirely dismissed. The conflicting Stochastic signals, particularly on the 1-hour and daily charts, hint at the possibility of a short-term bounce. For this scenario to materialize, silver needs to hold its ground around the current price of $68.76 and show resilience at the $4389.5 support level identified on the 1-hour chart. A successful defense of this level could lead to a retracement towards the immediate resistance at $4424.34, followed by $4437.17.
For a more sustained bullish move, XAGUSD would need to break decisively above the 1-hour resistance cluster and then target the 4-hour resistance at $4451.03. Confirmation would likely require a pullback in the DXY, perhaps triggered by softer-than-expected US economic data or a shift in central bank rhetoric. If upcoming economic events, such as the PCE price index or employment figures, come in weaker than forecasted, it could reduce the perceived need for aggressive interest rate hikes, thereby weakening the dollar and providing a tailwind for silver. Additionally, any significant geopolitical event that drives substantial safe-haven flows into precious metals, overriding the dollar's strength, could also spark a bullish reversal. However, given the current strong trend strength (ADX readings above 25 across timeframes), such a bullish scenario would likely face significant headwinds and require strong catalysts to overcome the dominant selling pressure.
The Range-Bound Scenario: Caught Between Dollar and Data
A third possibility is that XAGUSD remains range-bound, oscillating between key support and resistance levels as the market digests conflicting economic signals and awaits clearer direction. In this scenario, the price might struggle to decisively break below the $4350 area, while simultaneously failing to muster the strength to reclaim higher resistance levels. This could lead to a period of consolidation, where the price action becomes choppy and unpredictable, driven by short-term fluctuations in the DXY and minor economic data releases.
The 1-hour chart's neutral ADX (32.09) and the conflicting Stochastic signals could support this view in the very short term. If the DXY stalls around the 99.73-100.02 resistance zone, and no major economic news emerges to shift sentiment dramatically, silver could find itself trapped. This range-bound environment often precedes a larger move, as underlying pressures build. Traders in this scenario would focus on the immediate support at $4389.5 and resistance at $4424.34, looking for confirmation of a breakout or breakdown. However, the strong trend strength indicated by the higher timeframes (4H and 1D) makes a prolonged period of consolidation less likely than a continuation of the existing trend, either up or down.
Dominant Forces: Why the Bearish Scenario Holds More Weight
Considering the confluence of technical and fundamental factors, the bearish scenario for XAGUSD appears to be the most probable in the near term. The persistent strength of the US Dollar Index (DXY), currently testing key resistance at 99.73 and showing strong upward momentum across all timeframes, provides a formidable headwind for silver. The ADX readings across the 1H, 4H, and 1D charts (32.09, 33.37, 29.34 respectively) all point to well-established trends, with the current one being decidedly downwards for XAGUSD. This suggests that any short-term bounces are likely to be met with selling pressure as traders defend resistance levels.
While conflicting Stochastic signals might offer brief intraday trading opportunities, they lack the conviction to signal a sustainable trend reversal in the face of such strong bearish indicators. The RSI, though neutral, consistently shows a downward bias, further supporting the bearish outlook. For the bullish or even a neutral scenario to gain traction, we would need to see a significant shift in market sentiment, likely driven by weaker-than-expected US economic data or a dovish pivot from the Federal Reserve. Until then, the path of least resistance for XAGUSD appears to be downwards, with the support levels around $4350-$4370 being the next logical targets if the current price at $68.76 fails to hold.
What I'm Watching This Week: Key Triggers for XAGUSD
As we look ahead, several key factors will dictate the direction of XAGUSD. Firstly, the trajectory of the US Dollar Index (DXY) remains paramount. A sustained move above 100.02 would likely intensify the selling pressure on silver. Conversely, a break back below 99.44 could signal a dollar pullback, offering some relief to XAGUSD. Secondly, upcoming economic data releases from the US, particularly the PCE Price Index and employment figures, will be crucial. Weaker-than-expected data could weaken the dollar and support silver, while stronger data could reinforce the bearish case by signaling continued economic resilience and potential for further hawkish monetary policy.
Geopolitical developments also bear watching. Any escalation of conflicts or major supply chain disruptions could theoretically boost safe-haven demand for precious metals. However, in the current environment, the dollar's safe-haven appeal seems to be overshadowing gold and silver. Therefore, traders should remain focused on the interplay between dollar strength, US economic data, and key technical levels. The immediate focus remains on whether XAGUSD can hold the $68.76 level and defend the support zone around $4350-$4370. A break below this zone could open the door for further downside, while a strong defense might lead to a short-term corrective bounce.
Bearish Scenario: Dollar Dominance Continues
70% ProbabilityNeutral Scenario: Choppy Range Trading
20% ProbabilityBullish Scenario: Data-Driven Dollar Weakness
10% ProbabilityFrequently Asked Questions: XAGUSD Analysis
What happens if XAGUSD breaks below the $4350 support zone?
If XAGUSD breaks below the critical support zone around $4350-$4370, the bearish scenario gains significant traction. This would likely trigger further selling pressure, potentially targeting the 4-hour support at $4339.59, especially if the DXY continues its ascent above 99.73.
Is the RSI at 43.35 a sell signal for XAGUSD right now?
An RSI of 43.35 on the 1-hour chart indicates neutral territory but with a downward bias, suggesting sellers are still in control. While not an immediate sell signal on its own, it aligns with the broader bearish trend and suggests that any upward momentum may be limited, making it a cautious signal within a downtrend.
How will upcoming US economic data affect XAGUSD this week?
Weaker-than-expected US data, such as PCE or employment figures, could weaken the dollar and provide a tailwind for XAGUSD, potentially triggering a bounce towards $4424.34. Conversely, strong data could reinforce the dollar's strength and add to the downward pressure on silver, targeting lower support levels.
Should I consider buying XAGUSD at current levels of $68.76 given the conflicting Stochastic signals?
Buying at $68.76 requires caution due to the dominant bearish trend and dollar strength. While the Stochastic shows a potential short-term bounce signal, it lacks conviction against the stronger bearish indicators. A more prudent approach would be to wait for confirmation, such as a hold above $4389.5 and a DXY pullback, before considering any long positions.
“The market always presents opportunities, but discipline and patience are key. Wait for your setup, manage your risk, and let the price action guide you.”
Technical Outlook Summary
| Indicator | Value | Signal | Interpretation |
|---|---|---|---|
| RSI (14) | 43.35 | Neutral | Downward bias, sellers in control without being oversold. |
| MACD Histogram | - | Bearish | Negative momentum, MACD below signal line. |
| Stochastic | K:45.47, D:31.75 | Bullish Divergence | Potential short-term bounce signal, but lacks conviction. |
| ADX | 32.09 | Strong Trend | Reinforces existing trend; currently a strong downtrend. |
| Bollinger Bands | Below Middle Band | Bearish | Price action indicates downward pressure. |
Key Levels
Track markets in real-time
AI-powered analysis, technical indicators and real-time price data.
Join Our Telegram Channel
Breaking market news, AI analysis and trading signals instantly.
Join Channel