XAGUSD Dips to $69.44: Bearish Trend Tests Key Support Levels
Silver (XAGUSD) faces downward pressure, trading at $69.44. The bearish trend tests critical support near $69.88 amid geopolitical tensions and a strengthening dollar.
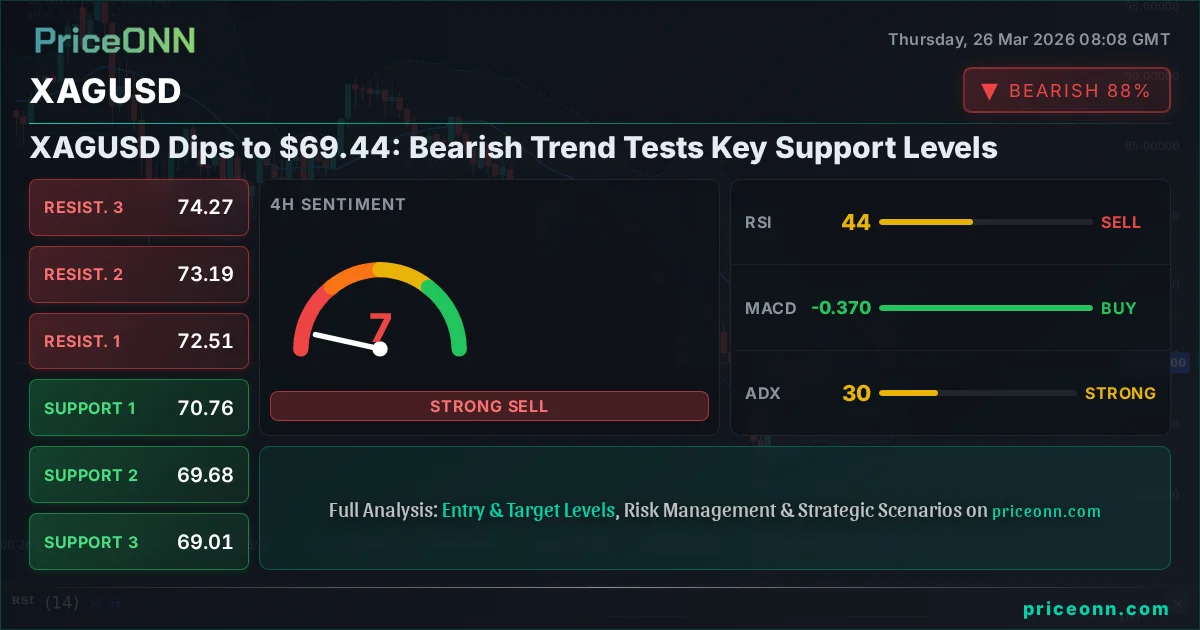
Silver, or XAGUSD as it's known in the trading world, is currently navigating choppy waters, trading at precisely $69.44. This price point, a slight dip of 2.47% for the day, places it precariously close to the crucial support level of $69.88. The prevailing trend is decidedly bearish across multiple timeframes, with the daily chart showing a strong 95% conviction in this direction. Traders are closely watching to see if this support can hold, especially as geopolitical tensions continue to simmer and the US Dollar Index (DXY) shows signs of strength, currently hovering around 99.53.
- XAGUSD is trading at $69.44, with a strong bearish trend indicated across daily timeframes (95% conviction).
- Critical support is identified at $69.88, with further levels at $69.44 (current price) and $69.28.
- Resistance is forming around $70.32, with key levels at $70.69 and $71.36.
- The DXY at 99.53 strengthens, potentially adding pressure to silver prices.
The immediate 1-hour chart paints a picture of neutral momentum, but the 4-hour and daily charts clearly signal a bearish trend. On the 1-hour timeframe, the RSI(14) sits at 37.12, indicating a neutral zone but with a downward inclination. The MACD is showing negative momentum, and Stochastic oscillators are firmly in bearish territory, with %K below %D. This suggests that while intraday fluctuations might occur, the broader sentiment remains cautious to bearish. The ADX at 23.23 on the 4-hour chart confirms a moderately strong downtrend, reinforcing the bearish outlook.
Digging deeper into the technical indicators, the 1-hour chart presents a mixed bag, but the overwhelming signal from the longer timeframes is bearish. The ADX reading of 23.23 on the 1-hour chart suggests a moderate trend strength in the current downward move. However, the 4-hour chart shows a stronger ADX of 29.95, indicating a more defined downtrend. On the daily chart, the ADX climbs to 29.17, further solidifying the bearish conviction. This consistent downtrend signal across multiple timeframes means that any rallies are likely to be met with selling pressure, especially as we approach key resistance levels.
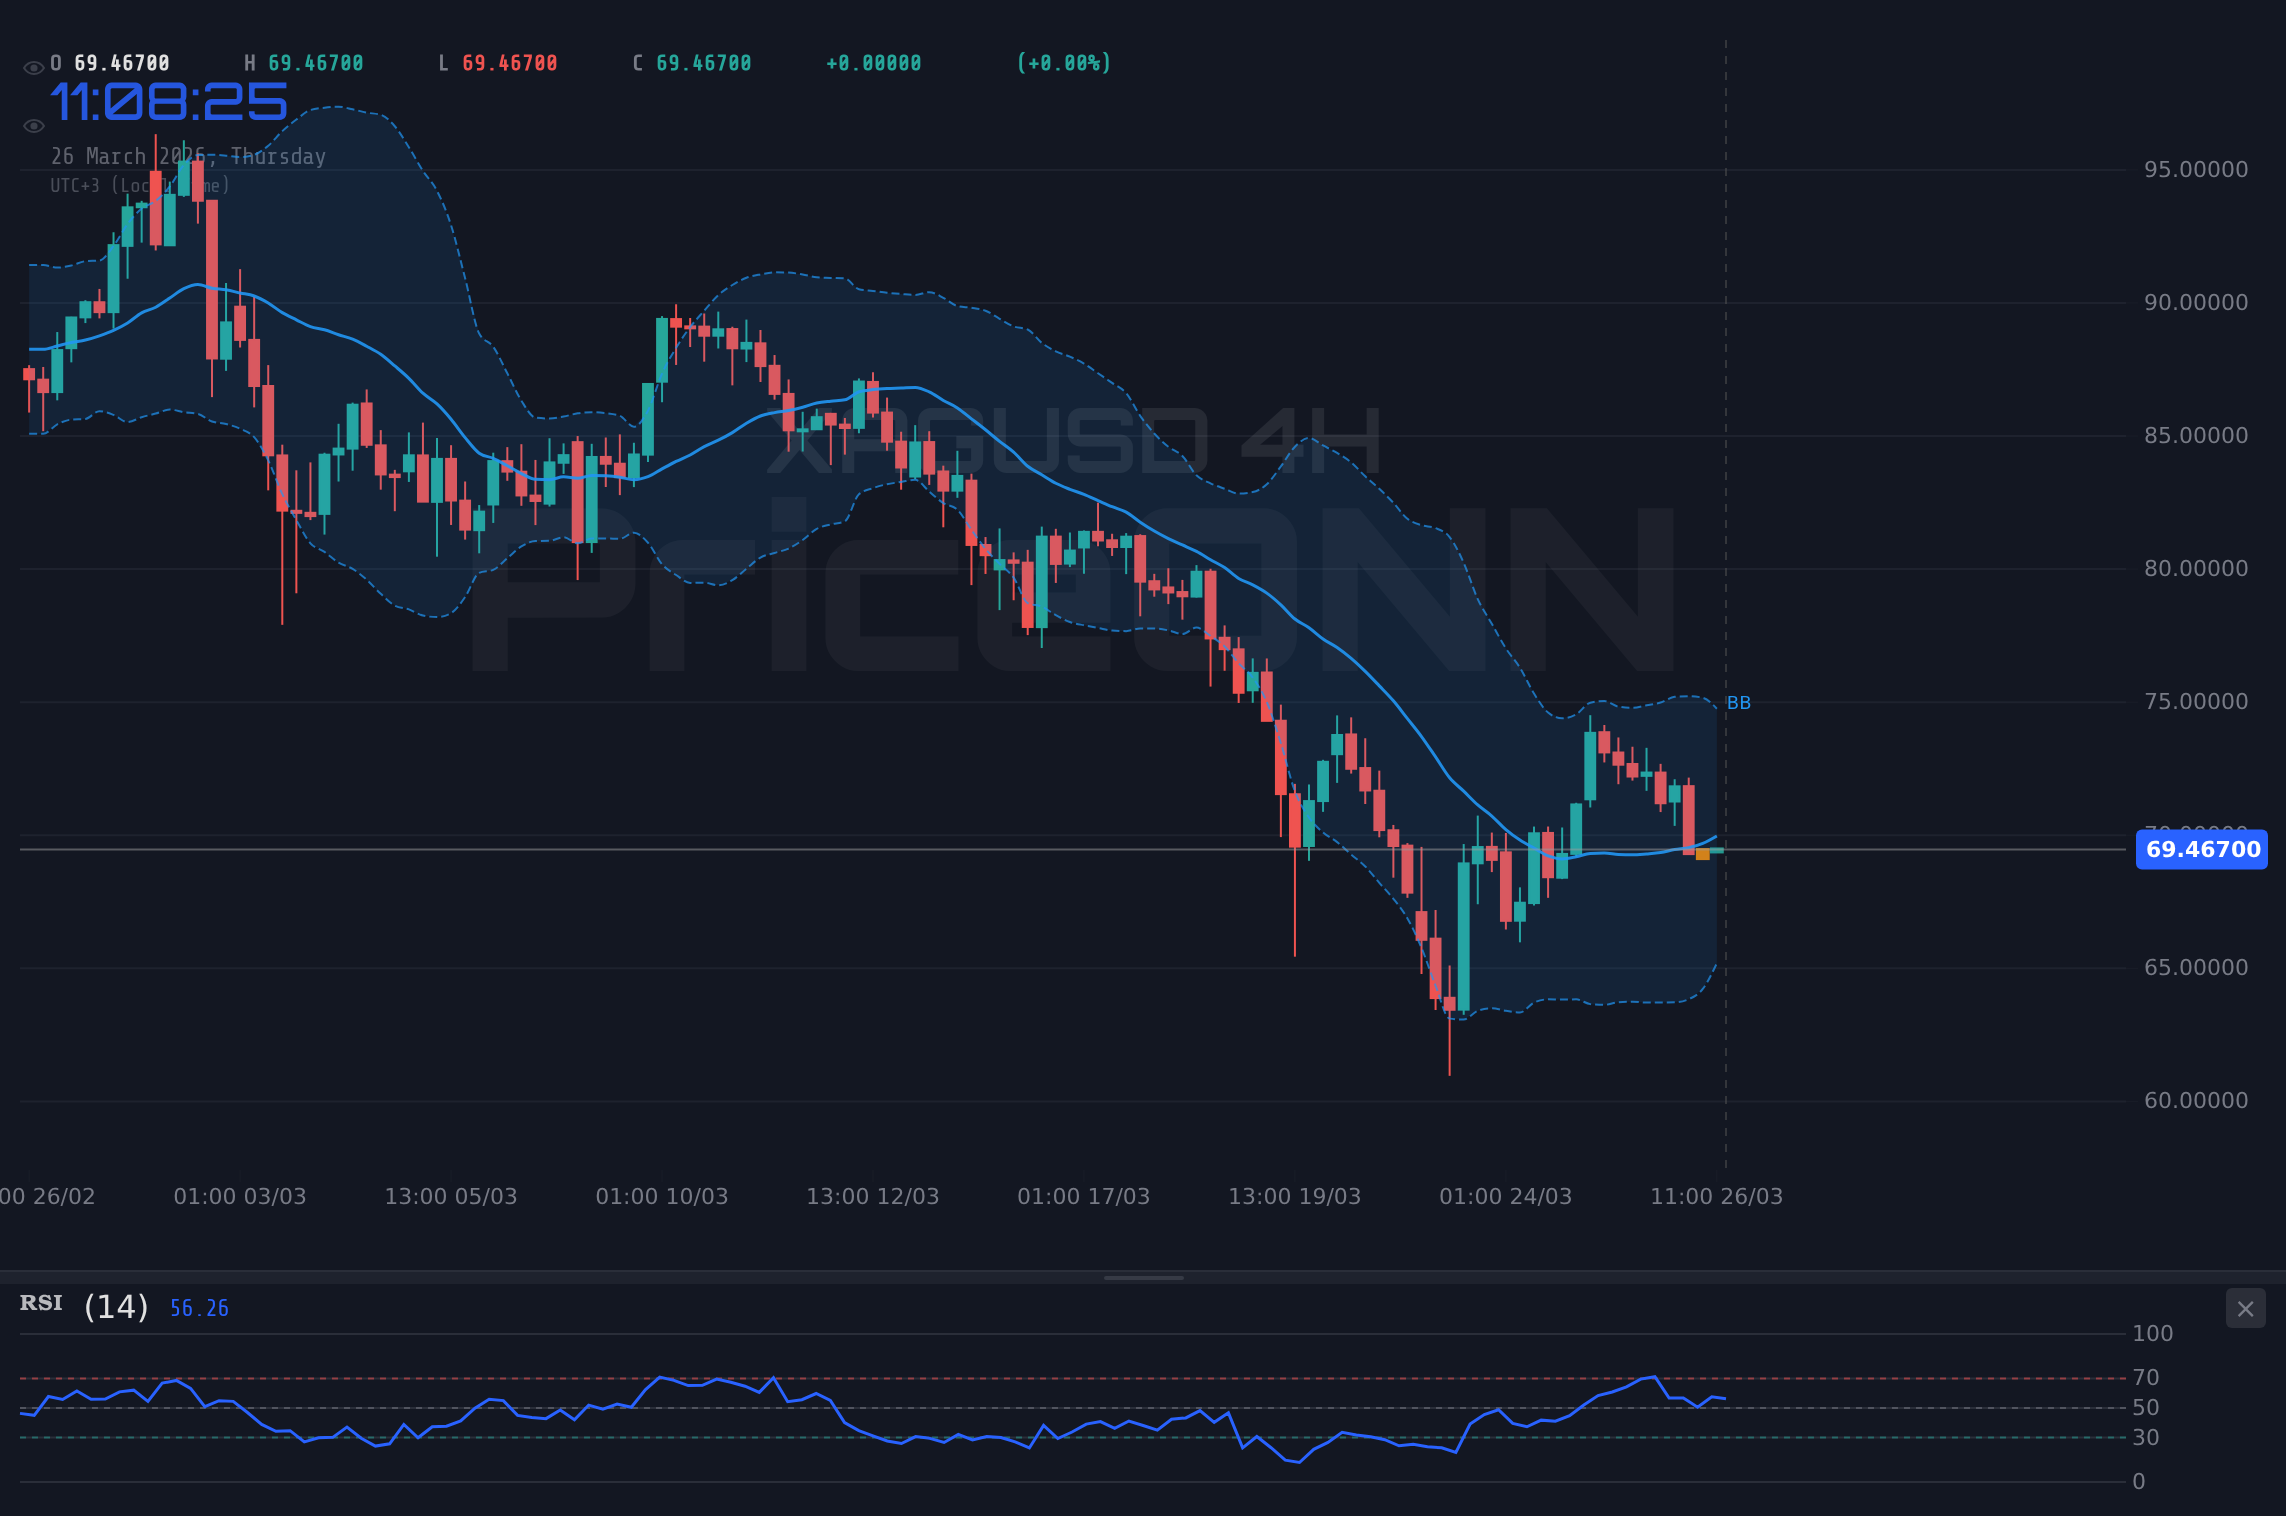
The current price action for XAGUSD at $69.44 is a critical juncture. The immediate support lies at $69.28, followed by $68.62 and $68.24. These levels are being closely monitored by market participants. On the resistance side, the immediate hurdle is at $70.32, then $70.69, and further up at $71.36. The fact that the price is currently hovering near the lower end of its daily range (68.99 - 72.17) and below the 4-hour and daily mid-Bollinger bands suggests that sellers are in control. The Stochastic oscillator on the 1-hour chart is at K=14.89, D=42.25, clearly indicating a bearish signal and oversold conditions, which could precede a short-term bounce, but the overall trend remains the dominant factor.
The broader market context is also playing a significant role. The US Dollar Index (DXY) is currently trading at 99.53, showing a daily increase of 0.23%. A strengthening dollar typically exerts downward pressure on dollar-denominated commodities like silver, as it becomes more expensive for holders of other currencies. Furthermore, geopolitical tensions, particularly those escalating in the Middle East, are a double-edged sword for precious metals. While they can sometimes drive safe-haven demand, the current narrative seems to be dominated by dollar strength and risk aversion that favors the dollar over gold and silver, especially when coupled with rising Treasury yields, though yield data isn't provided here.
The economic calendar adds another layer of complexity. Today, Thursday, March 26th, 2026, saw the release of US ISM Manufacturing PMI data. The actual figure came in at 52.4, exceeding the forecast of 51.5 and the previous reading of 51.6. This stronger-than-expected manufacturing data for the US could further bolster the dollar and potentially add to the headwinds facing silver. While this is positive for the dollar, it signals potential economic resilience which might not immediately translate into higher inflation expectations that typically benefit gold and silver as inflation hedges. We also saw a strong US ADP Non-Farm Employment data release at 6.926, far exceeding the forecast of -1.3, which further supports the dollar and may lead to expectations of strong upcoming NFP data.
Looking at the correlation with other markets, major indices like the S&P 500 and Nasdaq 100 are showing a bearish bias today. The S&P 500 is down 0.31% at 6570.8, and the Nasdaq 100 has fallen 0.38% to 24065.5. This decline in risk appetite typically supports safe-haven assets. However, the prevailing strength in the US Dollar is currently overshadowing this effect for silver. If the stock market continues to slide, we might see a shift in demand towards traditional safe havens, but for now, the dollar's strength appears to be the dominant force impacting XAGUSD.
The energy markets are also sending signals that could indirectly affect silver. Brent crude is trading higher at $103.33, up 1.69%, and WTI crude is also climbing, up 1.81% to $93.18. Rising oil prices can contribute to inflationary pressures, which historically benefits silver. However, the current market dynamics suggest that the immediate impact of rising oil prices is being absorbed by broader concerns about economic slowdown and dollar strength. The ADX on the daily Brent chart is a very strong 62.6, indicating a powerful uptrend, which could eventually feed into inflation concerns that support precious metals, but this effect is not currently visible in XAGUSD's price action.
Given the current technical and fundamental backdrop, the most probable scenario for XAGUSD in the short term appears to be a continuation of the bearish trend, testing lower support levels. The immediate trigger for further downside would be a decisive break below the $69.88 support level. If this occurs, the next significant targets would be the $69.44 current price level itself, followed by $69.28. The strong daily sell signal, coupled with negative momentum on MACD and oversold conditions on Stochastic on the 1-hour chart, suggests that downward pressure is likely to persist. The ADX readings across all timeframes also reinforce the bearish trend.
However, a bounce from the current levels is not entirely out of the question. If XAGUSD manages to hold above the $69.88 support and finds strength to reclaim the $70.32 resistance level, a short-covering rally could ensue. The trigger for such a move would be a sustained break above $70.32, with the first target being $70.69 and a more ambitious target at $71.36. This scenario would likely require a softening of the US dollar or a significant shift in risk sentiment back towards commodities. The RSI on the 1-hour chart at 37.12 is approaching oversold territory, and a cross above the 30 level could signal a potential short-term reprieve, though it would need confirmation from other indicators and price action.
A neutral, range-bound scenario is also possible, especially if the market awaits key economic data or geopolitical clarity. In this case, XAGUSD might oscillate between the current support near $69.44 and resistance around $70.32. This would be characterized by lower trading volumes and indecisive price action. The weak ADX readings on the 1-hour and 4-hour charts (16.38 and 12.18 respectively) can sometimes indicate a lack of strong trend, favoring consolidation. However, the daily ADX at 29.17 still points to a strong underlying trend, making a prolonged neutral phase less likely without a significant shift in market drivers.
The most compelling argument for the bearish scenario lies in the confluence of technical signals and fundamental drivers. The daily chart, with its 95% trend strength, MACD in negative territory, and RSI below 40, provides a strong bearish foundation. The strengthening DXY at 99.53 and the positive US ISM Manufacturing PMI (52.4) and ADP Non-Farm Employment (6.926) data further support the case for continued dollar strength, which typically weighs on silver. While rising oil prices could theoretically boost inflation and silver, the current market narrative doesn't seem to be prioritizing that factor over dollar strength and risk aversion. Therefore, the probability of a bearish continuation testing lower support levels appears to be the most likely outcome in the near term.
What I'm watching this week are a few key triggers. Firstly, the ability of XAGUSD to hold the $69.88 support level. A close below this on the 4-hour chart would likely accelerate selling. Secondly, I'm monitoring the DXY's trajectory; a sustained push above 100 would add significant pressure. Finally, upcoming economic data, particularly any further strong US employment or inflation figures, could solidify the bearish case. Conversely, any de-escalation in geopolitical tensions or a dovish shift in Fed rhetoric could offer silver a reprieve, but the current data doesn't strongly support that outlook.
Bearish Scenario: Downside Continuation
65% ProbabilityNeutral Scenario: Range-Bound Consolidation
25% ProbabilityBullish Scenario: Short-Covering Rally
10% ProbabilityFrequently Asked Questions: XAGUSD Analysis
What happens if XAGUSD breaks below the $69.88 support level?
If XAGUSD breaks decisively below the $69.88 support, the bearish trend is likely to accelerate. We could see a swift move towards the current price level of $69.44, and potentially further down towards the $69.28 support on the 1-hour chart, as selling pressure intensifies.
Should I consider buying XAGUSD at current levels near $69.44 given the oversold Stochastic on the 1-hour chart?
While the 1-hour Stochastic at K=14.89 is oversold, the overwhelming daily bearish trend suggests caution. A short-term bounce is possible, but it would be a high-risk trade. Wait for confirmation, such as a break above $70.32 resistance, before considering any bullish positions, as this scenario currently holds only a 10% probability.
Is the RSI at 37.12 on the 1-hour chart a sell signal for XAGUSD right now?
An RSI of 37.12 is in the neutral zone but trending downwards, aligning with the overall bearish sentiment. It's not an immediate aggressive sell signal on its own, but it confirms the lack of buying pressure and supports the bearish outlook. The stronger daily RSI at 31.75 indicates further downside potential.
How will the strong US ISM Manufacturing PMI and ADP data affect XAGUSD this week?
The stronger-than-expected US ISM Manufacturing PMI (52.4) and ADP Non-Farm Employment data (6.926) are likely to bolster the US Dollar. This strengthening dollar, combined with a potential increase in risk aversion, creates headwinds for silver (XAGUSD), reinforcing the bearish trend and making a move below $69.88 more probable.
| Indicator | Value | Signal | Interpretation |
|---|---|---|---|
| RSI (14) | 37.12 | Bearish | Nearing oversold on 1H, but still in neutral zone. Daily RSI at 31.75 signals further downside. |
| MACD Histogram | -0.25 | Bearish | Negative momentum across most timeframes, suggesting sellers are in control. |
| Stochastic | K:14.89, D:42.25 | Bearish | Oversold on 1H, but %K < %D confirms bearish trend. Daily Stochastic shows potential for upside but trend is dominant. |
| ADX | 23.23 | Bearish Trend | Moderate trend strength on 1H, stronger on 4H (29.95) and Daily (29.17), indicating sustained downward movement. |
| Bollinger Bands | Close below Middle Band | Bearish | Price is trading below the middle band on 1H and 4H, indicating downward pressure. |
The path forward for silver hinges on its ability to defend key support levels. While the immediate technical indicators on the 1-hour chart might suggest a potential for a bounce from oversold conditions, the broader trend is firmly bearish. The confluence of a strengthening US dollar, driven by positive economic data and geopolitical concerns, alongside the clear downtrend signals from daily technicals, paints a cautious picture. Investors and traders should remain vigilant, closely watching the $69.88 and $69.44 levels for any signs of capitulation or resilience. The market is currently favoring a bearish continuation, but a shift in sentiment or a break of key resistance could quickly alter the outlook.
Ultimately, navigating the current silver market requires a keen eye on both technical price action and the overarching macroeconomic narrative. The bearish trend appears dominant, but the market is dynamic. Key economic releases and geopolitical developments will be crucial in determining whether silver can find a footing or if further declines are on the horizon. For now, the bears seem to have the upper hand, but the $69.88 support level is the immediate battleground to watch.
Track markets in real-time
AI-powered analysis, technical indicators and real-time price data.
Join Our Telegram Channel
Breaking market news, AI analysis and trading signals instantly.
Join Channel