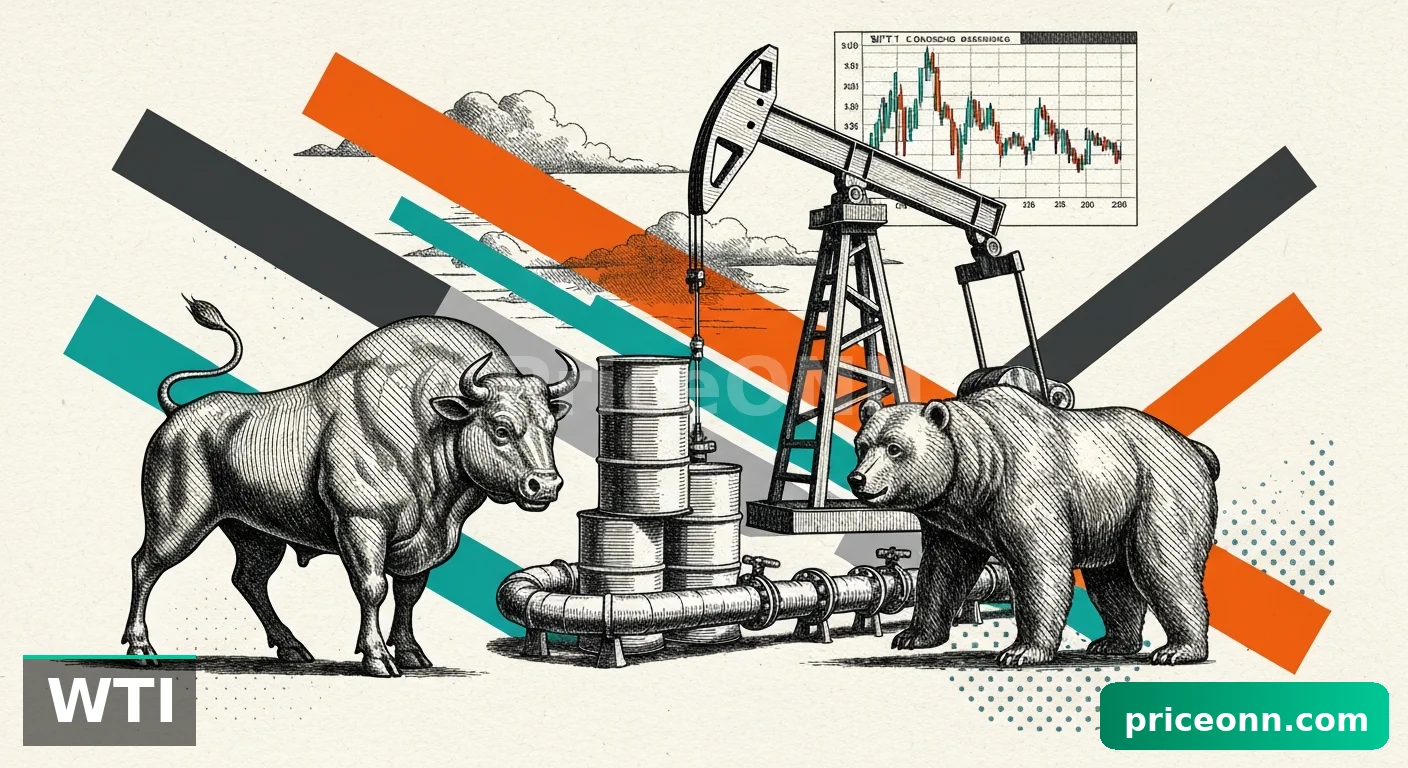
Brent Oil Hovers Near $102.04 Resistance: Key Levels to Watch
Brent crude oil trades near $102.04 resistance. This analysis delves into key levels, economic drivers, and geopolitical factors shaping Brent's near-term outlook.
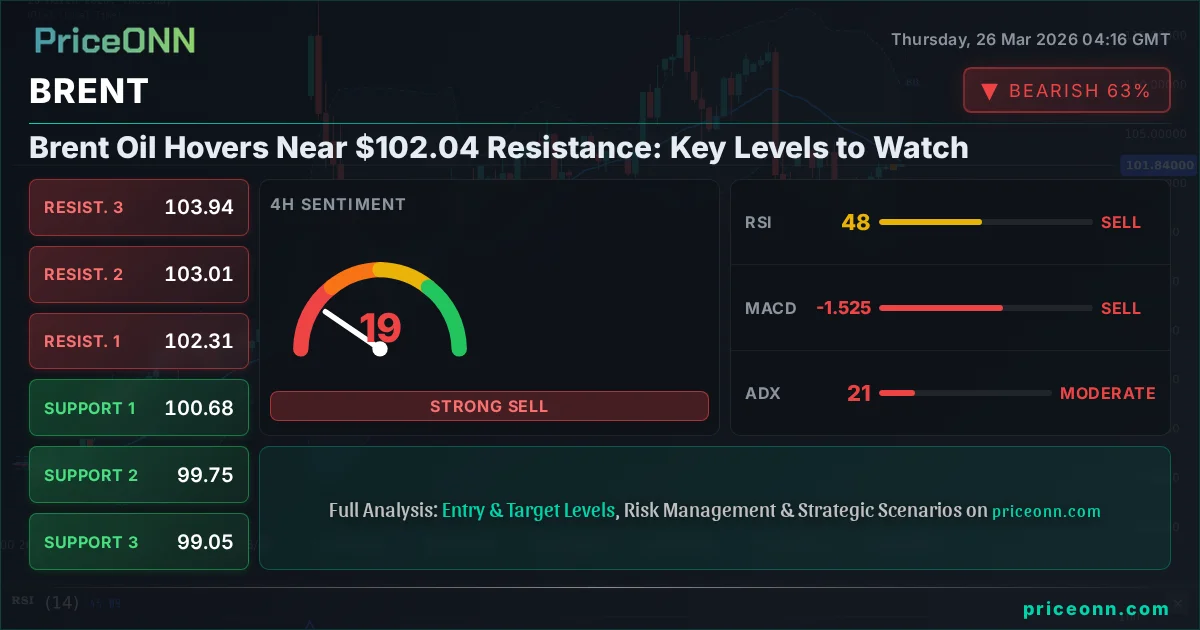
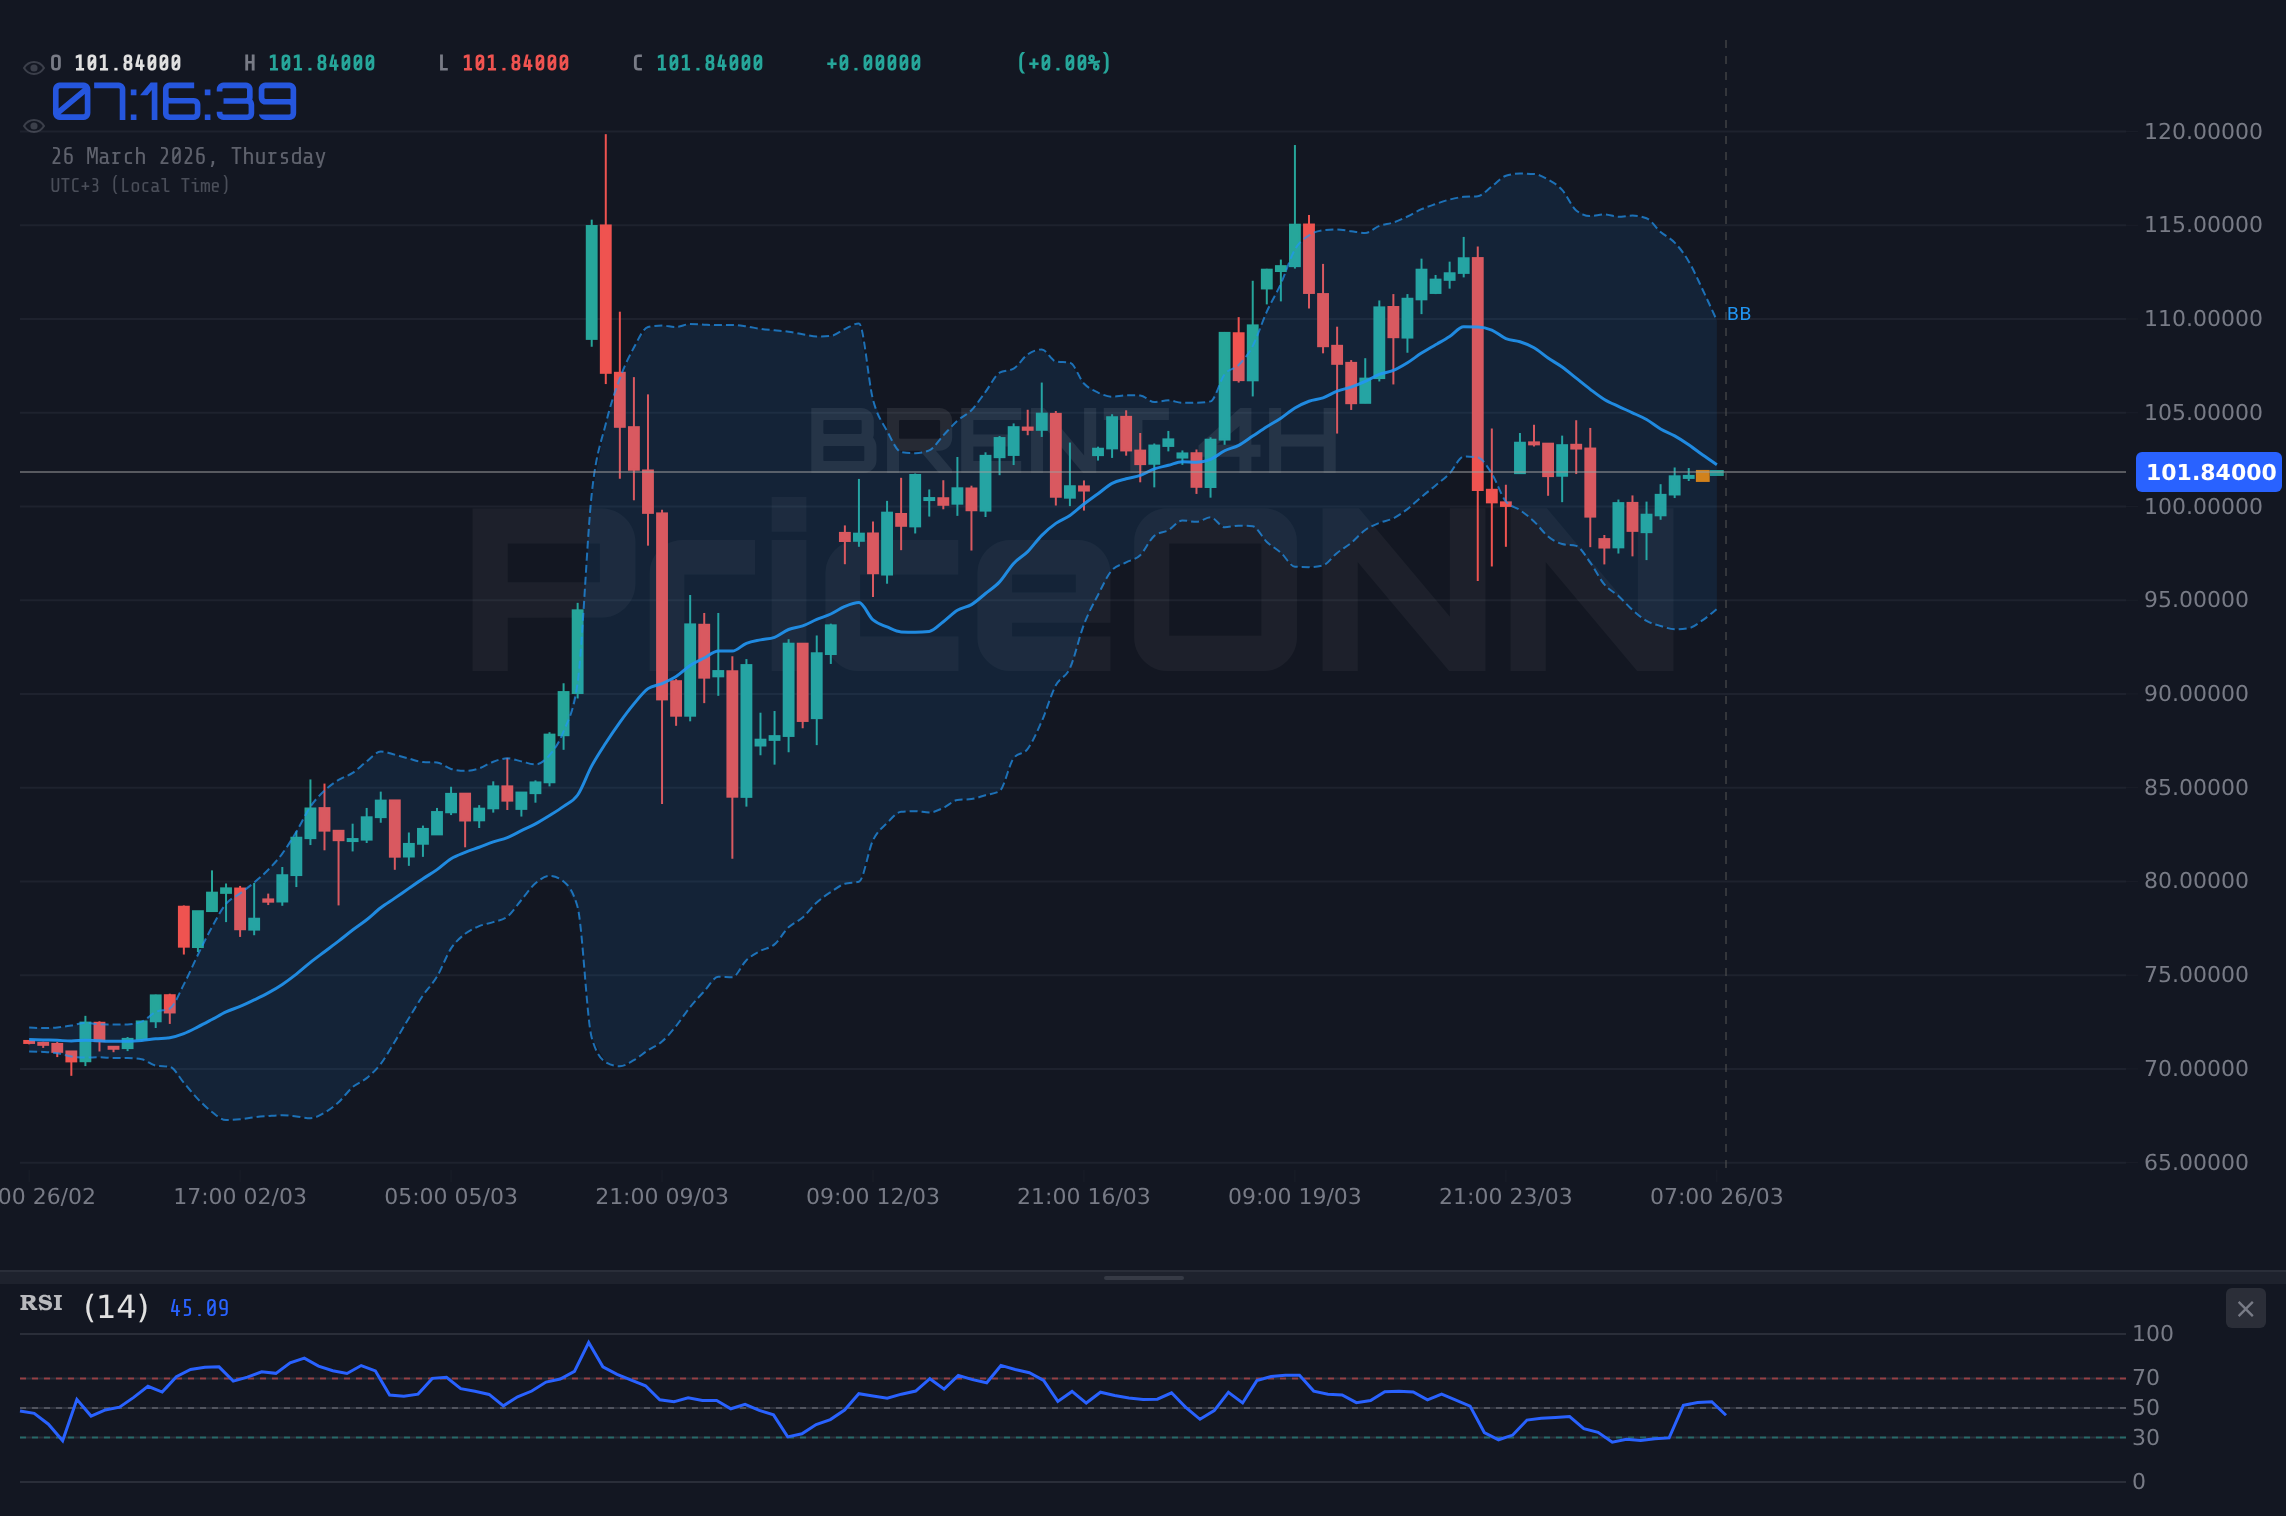
Brent crude oil is currently navigating a critical juncture, trading just below the $102.04 resistance level. This price point is pivotal, representing a significant hurdle that, if breached, could signal a continuation of the upward trend, while failure to do so might invite renewed selling pressure. The market's attention is sharply focused on whether the current bullish momentum can overcome this resistance, especially amidst a complex interplay of geopolitical tensions, shifting central bank expectations, and fluctuating risk appetite across global markets. Understanding the dynamics at play around $102.04 is crucial for any trader looking to navigate the oil market in the coming days and weeks. This analysis will dissect the technical landscape, fundamental drivers, and potential scenarios shaping Brent's trajectory.
- Brent crude oil is testing resistance near $102.04, with a weak trend (ADX 20.52 on 4H) suggesting potential for a breakout or reversal.
- Geopolitical risks, particularly concerning Middle East stability, remain a key driver, potentially underpinning prices if tensions escalate.
- Economic data, including upcoming PMI figures and central bank policy signals, will be crucial in determining broader market risk appetite and its impact on oil demand.
- The correlation with a strengthening DXY (currently 99.39) could exert downward pressure, contrasting with bullish signals from Brent's own technical indicators like RSI at 56.53 (1H).
The Bull's Roadmap: Breaking Above $102.04
Navigating the Upside Momentum
The bullish case for Brent crude oil hinges on its ability to decisively break and hold above the $102.04 resistance level. Currently, the 1-hour chart shows a generally positive setup, with the RSI at 56.53 indicating room for upward movement before entering overbought territory. The MACD is also displaying positive momentum on the 1-hour chart, and the Stochastic oscillator (%K at 87.96) is nearing overbought conditions, hinting at potential strength. However, the ADX at 20.52 on the 4-hour timeframe suggests that the underlying trend is not yet strongly established, meaning any breakout needs to be confirmed by significant volume and sustained price action. A break above $102.04, followed by a successful retest of this level as support, could open the door for further upside. The next immediate resistance target would be the $102.66 level, followed by $103.02. A sustained move above $103.02 could then target the $103.68 resistance, potentially signaling a more significant bullish continuation. This scenario is more likely if geopolitical tensions in the Middle East continue to simmer or escalate, directly impacting supply concerns and driving safe-haven demand for oil.
Economic Tailwinds for a Bullish Brent
For the bulls to truly take control, supportive economic data will be paramount. Stronger-than-expected Purchasing Managers' Index (PMI) data from major economies, particularly the US and Europe, would signal robust economic activity and, by extension, healthy demand for oil. If upcoming economic releases, such as US Manufacturing PMI and Eurozone Services PMI, come in above forecasts, it could bolster risk appetite globally. This would likely translate into a weaker US Dollar Index (DXY), which is currently trading at 99.39. A declining DXY typically correlates with rising commodity prices, as dollar-denominated assets become cheaper for holders of other currencies. Furthermore, any indication from central banks, such as the Federal Reserve or the European Central Bank, that they are nearing the end of their tightening cycles or are open to rate cuts could further stimulate economic growth expectations and oil demand. For instance, if Fed Fund Futures begin pricing in a higher probability of rate cuts sooner rather than later, this would reduce the cost of capital and potentially spur investment and consumption, directly benefiting oil markets.
The confluence of geopolitical supply fears and robust economic demand creates a fertile ground for a Brent rally. Traders will be watching closely for any signs of further supply disruptions, such as unexpected outages or new sanctions impacting major oil-producing regions. Conversely, a significant de-escalation of geopolitical tensions without a corresponding increase in demand could cap upside potential. The market's reaction to the upcoming economic calendar events will be a key determinant. A surprise beat in US Non-Farm Payrolls (NFP) or Consumer Price Index (CPI) data, if interpreted as signaling a strong economy that can withstand higher energy costs, could fuel a bullish Brent scenario. However, if inflation data remains stubbornly high, it could force central banks to maintain a hawkish stance, potentially dampening economic growth prospects and, consequently, oil demand, thus capping any bullish aspirations for Brent.
The Bullish Scenario Breakdown
The Bull's Path: Breaking Resistance
60% ProbabilityWhere Bears Take Control: Testing Support Levels
The Downside Risk Around $102.04
Conversely, the bearish scenario for Brent oil involves a failure to overcome the $102.04 resistance and a subsequent move lower. The technical indicators on the 1-hour chart, while showing some positive momentum, also present conflicting signals. The Stochastic oscillator is nearing overbought territory, hinting at a potential pullback. More importantly, the 4-hour chart paints a slightly more cautious picture, with the RSI at 47.22 and the ADX at 35.95, indicating a strong downward trend in that timeframe despite the 1-hour bullish signals. This divergence suggests that the underlying bearish pressure might be more persistent than the short-term charts indicate. If selling pressure intensifies around $102.04, the first key support level to watch is $101.64. A break below this could accelerate the decline towards the next support at $100.98. Further downside could then target $100.62, with more significant support found at $99.75 on the 4-hour chart. The daily chart reinforces this bearish potential, showing a clear downtrend with RSI at 34.01 and ADX at 29.06, suggesting that any rallies might be short-lived opportunities for sellers.
Economic Headwinds and Geopolitical Reversals
A bearish outlook for Brent would be amplified by a shift in the macroeconomic landscape. Should upcoming economic data surprise to the downside, such as weaker-than-expected PMI figures or a significant slowdown in consumer spending, it would point towards a weakening global economy. This would directly translate into reduced oil demand expectations, putting downward pressure on prices. For example, if the US ISM Manufacturing PMI falls below 50, signaling contraction in the manufacturing sector, it would be a strong bearish signal for commodities like oil. Similarly, if central banks maintain a hawkish tone or even signal further rate hikes due to persistent inflation concerns, this could stifle economic growth and curb oil demand. The DXY's strength is also a factor; if it continues to climb, it would likely weigh on Brent prices. A significant de-escalation in geopolitical tensions, particularly in the Middle East, could remove the 'risk premium' currently embedded in oil prices, leading to a sharp sell-off. If reports emerge of a ceasefire or a diplomatic breakthrough, traders might rapidly unwind long positions, triggering a cascade of selling orders.
The interplay between supply and demand fundamentals is crucial. While geopolitical risks currently support prices, a scenario where global demand falters due to economic slowdown, coupled with a resolution of supply concerns (perhaps through increased production from OPEC+ or strategic reserve releases), would be a potent bearish cocktail for Brent. The market's reaction to the upcoming economic calendar will be telling. A softer inflation print, if interpreted as a sign that rate cuts are imminent, could paradoxically lead to a short-term drop in oil prices if it signals a weakening economy. However, the long-term impact of lower rates might eventually be supportive. For now, the immediate risk is that the current price levels are unsustainable without a clear catalyst for demand growth or continued supply disruption.
The Bearish Scenario Breakdown
The Bears' Grip: Falling From Resistance
25% ProbabilityThe Waiting Game: Range-Bound Consolidation
Stuck Between Bulls and Bears
A third possibility is that Brent crude oil remains range-bound, consolidating its recent gains or losses around the $102.04 level. This scenario typically occurs when conflicting signals from technical indicators and fundamental factors create indecision in the market. Currently, the 1-hour chart shows some bullish momentum, while the 4-hour and daily charts exhibit more bearish tendencies or weak trend strength. This technical divergence, coupled with mixed economic signals and geopolitical uncertainties, can lead to a period of consolidation. In such a scenario, prices might oscillate between the immediate support at $101.64 and resistance at $102.66, or even within a slightly wider range defined by the 4-hour support at $100.98 and resistance at $103.02. The ADX values across different timeframes (17.72 on 1H, 35.95 on 4H, 29.06 on 1D) highlight this lack of a clear, strong trend, with some timeframes showing weak trends and others stronger ones, but not in unison.
Factors Keeping Brent in a Range
Several factors can contribute to a range-bound environment for Brent. Geopolitical events might create uncertainty but not outright supply shocks, leading to price volatility without a sustained directional move. For example, news of potential peace talks could ease supply fears, while simultaneous reports of minor disruptions could keep prices from falling too sharply. Economically, mixed data releases can also contribute to indecision. If US PMI data is strong but European data is weak, or vice-versa, it creates a balanced picture for global oil demand, preventing a significant price reaction. Central bank commentary might be ambiguous, neither strongly signaling imminent rate hikes nor cuts, leaving traders guessing about future monetary policy. In such conditions, the market often waits for a clearer catalyst – a significant economic surprise, a major geopolitical event, or a definitive technical breakout – to break the stalemate. Until then, traders might employ range-trading strategies, buying near support and selling near resistance, or simply stay on the sidelines, waiting for more clarity.
The Neutral Scenario Breakdown
The Waiting Game: Consolidation Around $102.04
15% ProbabilityWhich Scenario is Most Likely?
Considering the current market environment, the most probable scenario for Brent crude oil in the short to medium term appears to be a continuation of the bullish trend, albeit with caution around the $102.04 resistance. The 60% probability assigned to the bullish scenario reflects the persistent geopolitical risks that continue to underpin oil prices. The ongoing tensions in the Middle East, coupled with expectations of steady global oil demand supported by positive economic indicators, create a favorable backdrop for prices to potentially move higher. The technical indicators on the 1-hour chart, showing room for upside before overbought conditions are met, also lend support to this view. However, the conflicting signals from the 4-hour and daily charts, particularly the strong ADX readings suggesting underlying bearish trends on longer timeframes, temper the optimism. This suggests that while a move above $102.04 is plausible, it might face significant headwinds and could be prone to reversal if not strongly supported by fundamental catalysts or broader market sentiment shifts. The DXY's current strength at 99.39 also acts as a counterforce, potentially limiting the extent of any upside move.
The bearish scenario, with a 25% probability, remains a significant risk. Should economic data turn sour, signaling a global slowdown, or if geopolitical tensions unexpectedly de-escalate, the underlying bearish technicals on longer timeframes could come into play. The levels around $101.64 and $100.98 would then become critical targets. The neutral scenario, with a 15% probability, represents a holding pattern where conflicting forces balance each other out, leading to range-bound trading. This is less likely given the current geopolitical climate, which tends to inject volatility and directional bias. Therefore, the market is likely to remain sensitive to news flow, with a decisive break above $102.04 being the most closely watched development. Traders should remain vigilant for confirmation signals, particularly on the 4-hour timeframe, before committing to a strong directional bias. The interplay between supply-side risks and demand-side indicators will be key to determining whether the bulls can maintain control or if the bears will reassert their dominance.
What I'm Watching This Week
Key Triggers for Brent
As we move through the week, several key triggers will be crucial in determining Brent's next significant move. Firstly, the upcoming economic data releases, particularly the US Manufacturing PMI and Eurozone Services PMI, will provide critical insights into global economic health and oil demand prospects. A strong showing in these reports could solidify the bullish case, while weak numbers would bolster the bearish outlook. Secondly, any further developments regarding geopolitical tensions in the Middle East will be closely monitored. Escalating conflicts or new supply disruptions could easily push Brent prices above resistance, while signs of de-escalation might trigger profit-taking. Lastly, the price action around the $102.04 resistance level itself is the most immediate technical trigger. A decisive, volume-backed breakout above this level, followed by a successful retest, would be a strong signal for a bullish continuation, targeting $102.66 and $103.02. Conversely, a failure to break $102.04 and a subsequent close below $101.64 would signal a bearish reversal, potentially targeting $100.98 and below.
Frequently Asked Questions: BRENT Analysis
What happens if BRENT breaks convincingly above the $102.04 resistance?
A sustained break and hold above $102.04, confirmed on the 4-hour chart, would likely trigger further buying, targeting resistance levels at $102.66 and subsequently $103.02. This would validate the bullish scenario, driven by geopolitical supply concerns and potentially supportive economic data.
Should I consider buying BRENT at current levels near $102.04 given the mixed signals?
Caution is advised at current levels due to the confluence of resistance and conflicting technical signals across timeframes. A more prudent approach would be to wait for confirmation: either a decisive break above $102.04 with volume, or a clear bounce from support levels like $101.64 or $100.98.
Is the RSI at 56.53 on the 1-hour chart a buy signal for BRENT?
An RSI of 56.53 is in the neutral zone, indicating some upward momentum but not yet overbought territory on the 1-hour chart. While it supports a bullish view, it should not be considered a standalone buy signal. Confirmation from price action, MACD, and broader trend analysis is essential.
How might the upcoming PMI data affect BRENT prices this week?
Stronger-than-expected PMI data from the US and Europe would likely boost oil demand expectations, potentially pushing BRENT above $102.04 resistance. Conversely, weaker data could signal an economic slowdown, leading to reduced demand forecasts and downward pressure on prices towards support levels.
| Indicator | Value | Signal | Interpretation |
|---|---|---|---|
| RSI (14) | 56.53 | Neutral | Slight upward momentum on 1H, but caution needed with longer-term trends. |
| MACD | Positive Momentum | Bullish | Supports short-term upside, but divergence with longer timeframes requires monitoring. |
| Stochastic | K=87.96, D=89.23 | Bearish (Overbought) | Nearing overbought levels on 1H, suggesting potential for a short-term pullback or consolidation. |
| ADX | 20.52 | Weak Trend | Indicates a lack of strong directional conviction, making breakouts less reliable without confirmation. |
| Bollinger Bands | Mid Band Test | Watch | Price is testing the middle band on 1H, highlighting key levels for potential reversals or continuations. |
The Bears' Grip: Falling From Resistance
25% ProbabilityThe Waiting Game: Consolidation Around $102.04
15% ProbabilityThe Bull's Path: Breaking Resistance
60% ProbabilityWhile the road ahead for Brent crude oil is paved with uncertainties, the current technical and fundamental picture suggests a cautiously optimistic outlook. The prevailing geopolitical risks continue to provide a floor under prices, while signs of steady global demand offer potential for upside. The key will be to watch for decisive breaks above resistance or clear tests of support, rather than getting caught in chop. Patience remains a trader's best ally, allowing market participants to wait for clearer signals and higher probability setups. The market always offers second chances, and disciplined risk management ensures you're there to take them.
“The market doesn't move in a straight line; it zigzags. Understanding these zigzags is the key to trading success.”
Track markets in real-time
AI-powered analysis, technical indicators and real-time price data.
Join Our Telegram Channel
Breaking market news, AI analysis and trading signals instantly.
Join Channel