SP500 Tests $6,590 Resistance as Geopolitical Jitters Mount
The SP500 hovers around $6,590, facing resistance amid escalating Middle East tensions and mixed economic signals. What's next for the index?
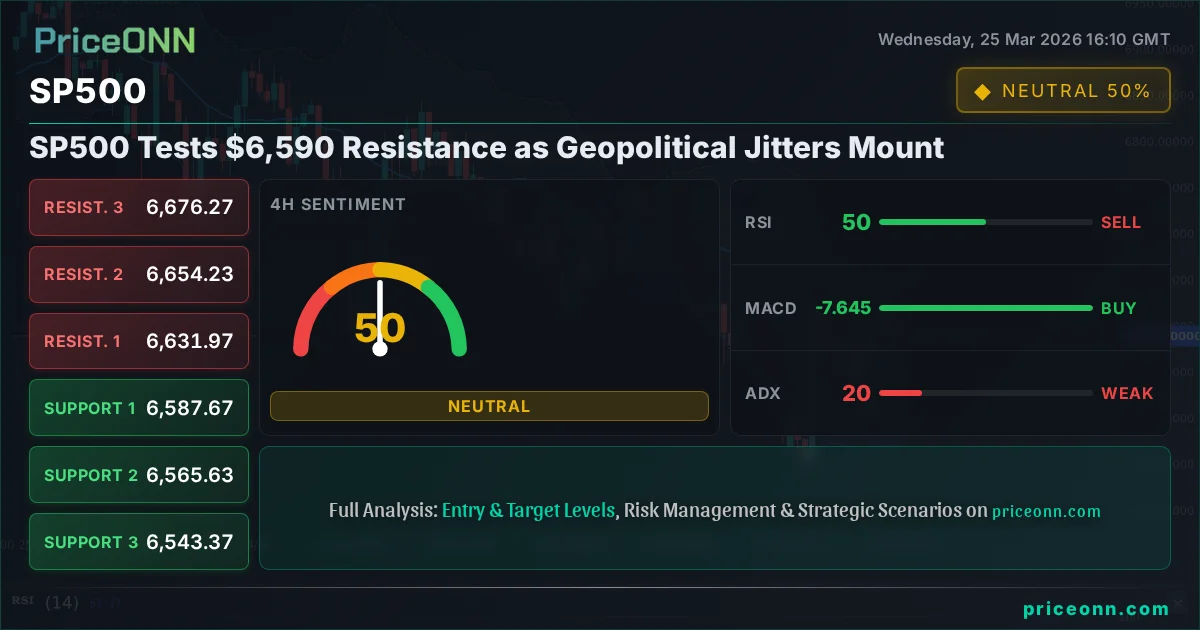
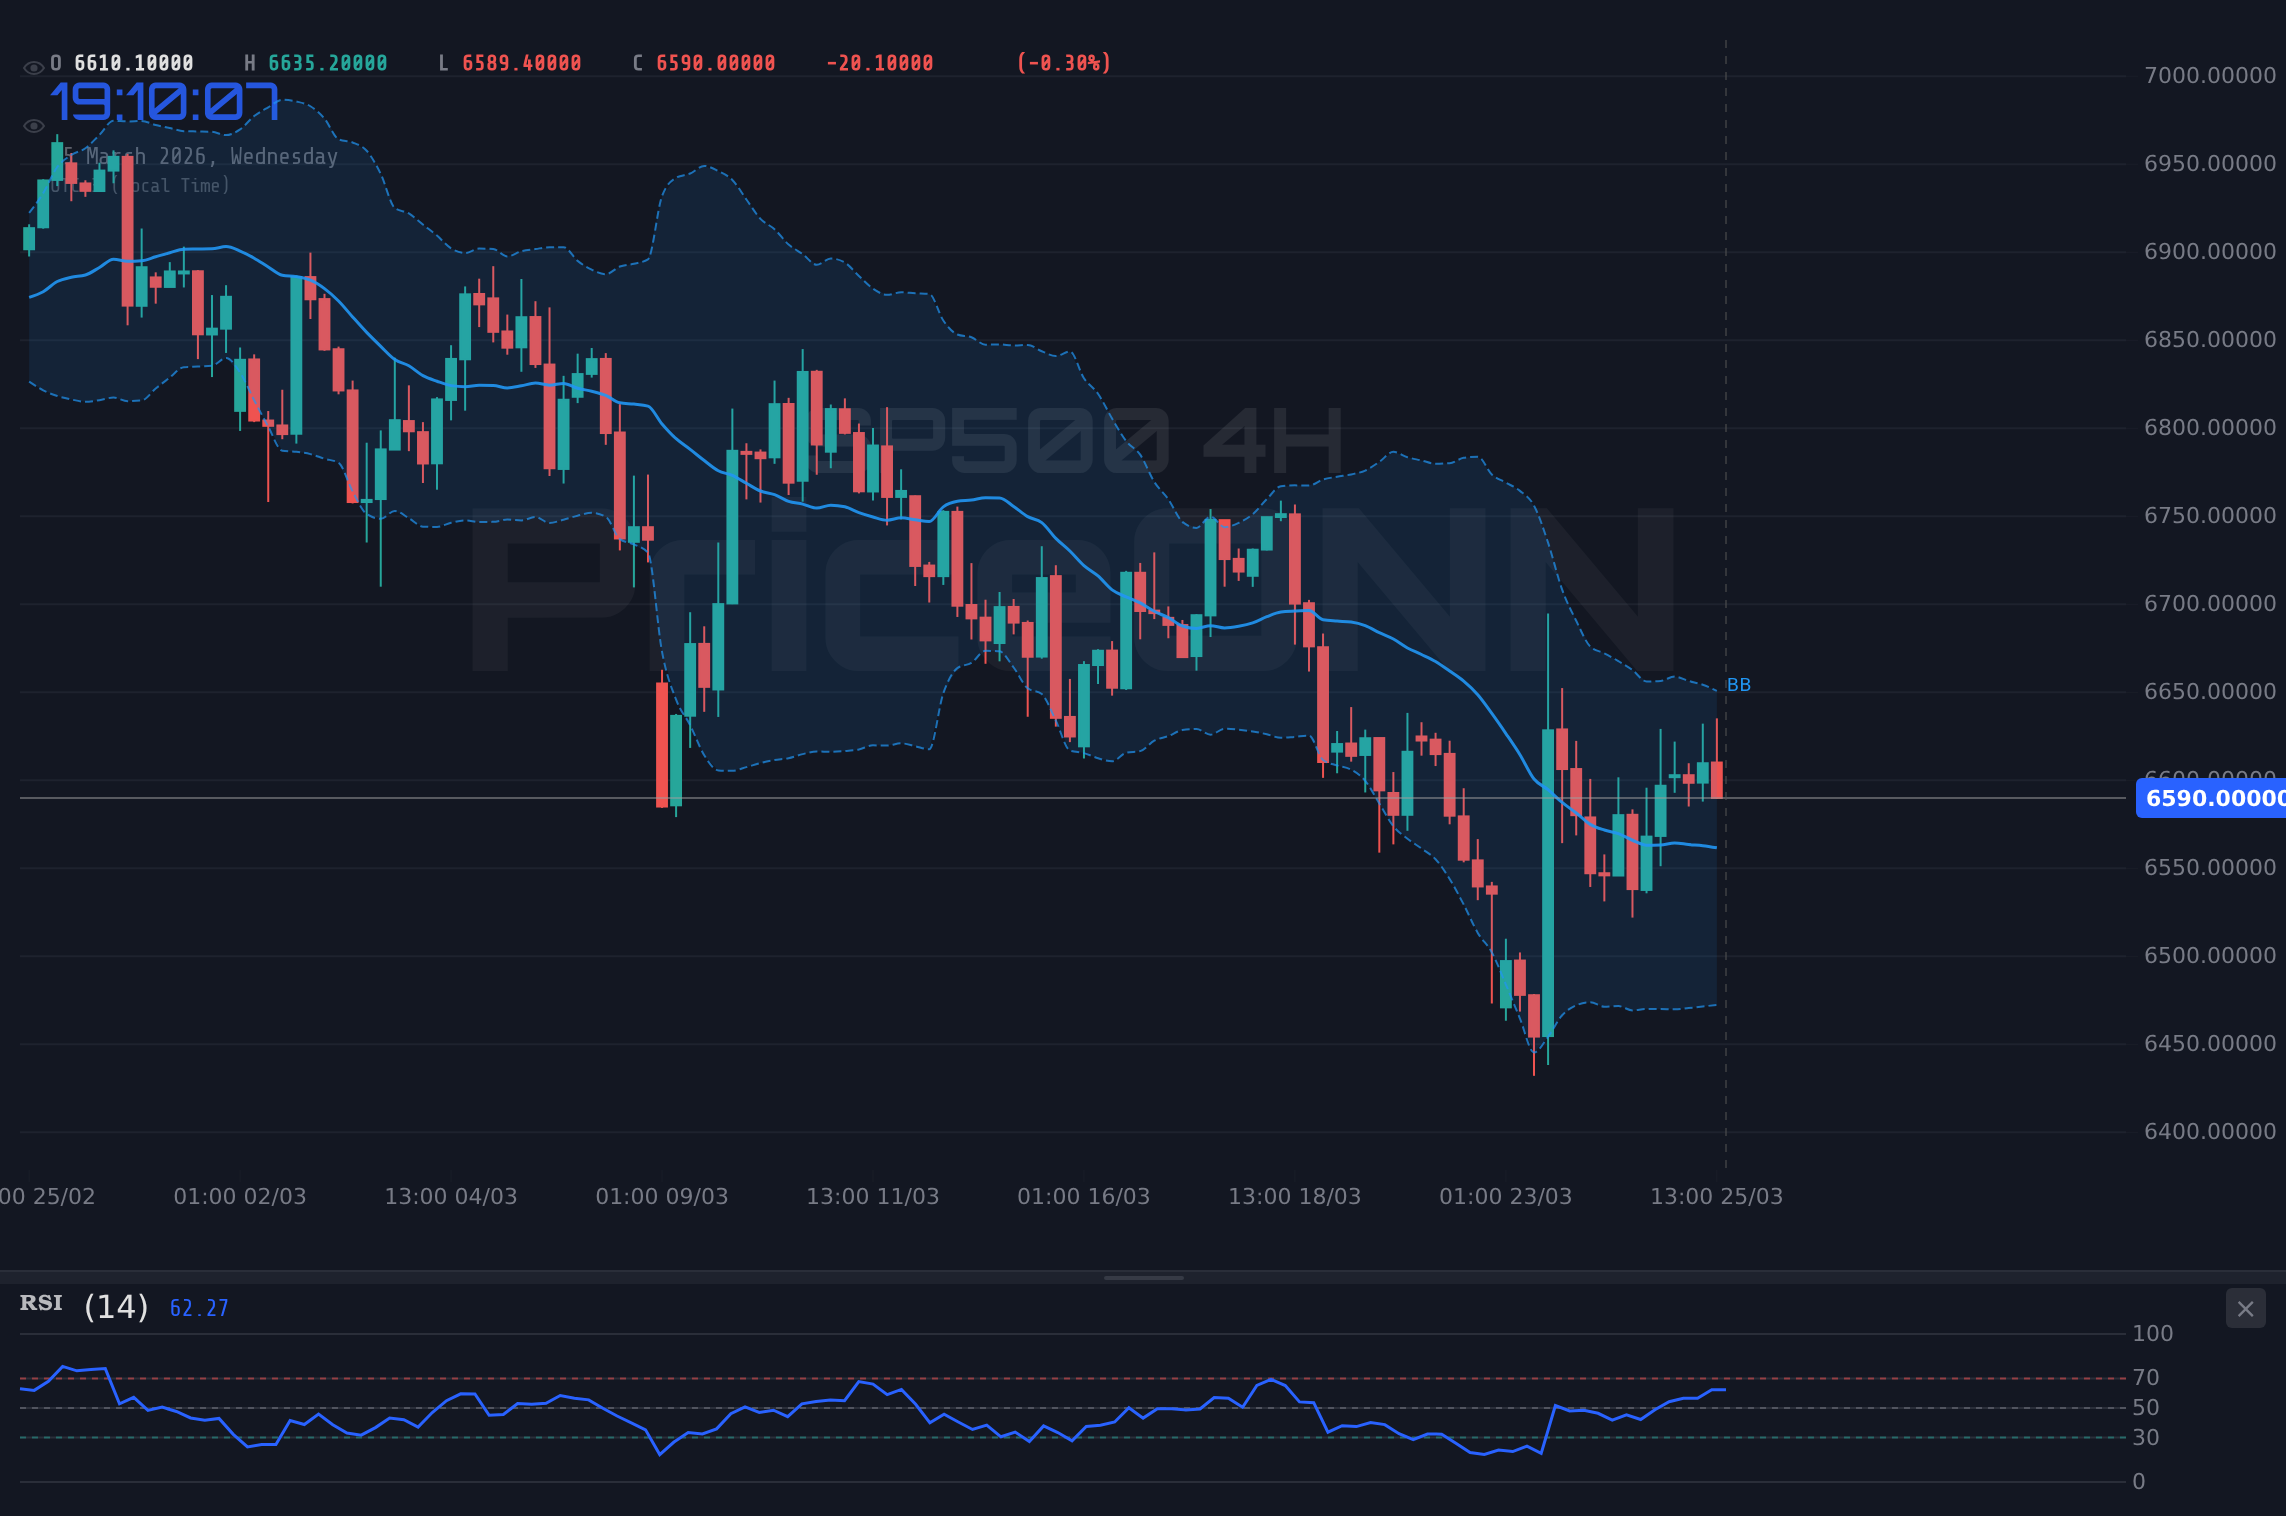
The SP500 is currently locked in a critical battle around the $6,590 mark, a level that's proving to be a significant hurdle as traders weigh escalating geopolitical risks against a backdrop of mixed economic data. This pivotal point, sitting just below the 4H resistance of $6,631.97, is where the market's next significant move will likely be decided. With the Dollar Index (DXY) showing strength, climbing to 99.39, and Brent crude oil pushing past $100.67, the inflationary pressures and safe-haven flows are becoming increasingly apparent, creating a complex environment for US equities.
The current market sentiment is a delicate balancing act. On one hand, the ongoing Middle East conflict continues to be a primary driver, pushing oil prices higher and fueling inflation expectations. This is directly reflected in the Brent crude oil price, which has surged to $100.67, and WTI crude oil, now at $90.55. Such commodity price spikes historically signal rising inflationary pressures, which could complicate the Federal Reserve's policy decisions. The market is grappling with the question of whether the Fed can navigate these inflationary headwinds without triggering a significant economic slowdown, a concern echoed in the rising recession odds reported by Wall Street economists, some placing them above 45%.
Adding to the complexity, the US Dollar Index (DXY) has shown notable strength, reaching 99.39. A stronger dollar typically exerts downward pressure on commodities priced in USD, and it also tends to make US equities less attractive to foreign investors. However, in the current environment, the dollar's strength might also be interpreted as a flight to safety, a response to the escalating global uncertainties. This dual nature of dollar strength - both a potential headwind for risk assets and a safe-haven indicator - creates a challenging interpretive landscape for traders attempting to gauge overall market risk appetite.
Technically, the SP500's 1-hour chart presents a mixed picture. While the overall trend is classified as bullish with 88% strength, the RSI(14) at 48.64 suggests a slight bearish eğilim, indicating that momentum might be waning. The MACD is below its signal line, reinforcing this cautious outlook. The Stochastic Oscillator, with K=31.48 and D=45.49, also points towards a potential downward move, indicating that the pair is not overbought but rather showing signs of weakness. The ADX at 15.75 signifies a weak trend, suggesting that the current price action might be more range-bound than indicative of a strong directional move, leaving the market in a state of indecision.
On the 4-hour timeframe, the picture becomes even more nuanced. The trend is neutral with 50% strength, reflecting the indecision in the market. However, the RSI(14) at 49.72 is hovering around the midpoint, offering no clear directional bias. The MACD, surprisingly, shows positive momentum with the MACD line above its signal line, contradicting the 1H timeframe. Stochastic levels, K=70.37 and D=60.98, are in the overbought territory, signalling potential profit-taking or a reversal. The ADX at 19.73 still indicates a weak trend. This divergence between timeframes, especially the conflicting signals from the MACD and Stochastic on different charts, highlights the current market's choppiness and the difficulty in establishing a clear direction.
The daily chart for the SP500 paints the most concerning picture, with a strong bearish trend identified (100% strength). The RSI(14) at 37.98 suggests that the index is moving away from overbought conditions and entering a zone that, historically, could precede further declines if not supported by fundamental shifts. The MACD is firmly in negative territory, below its signal line, a classic bearish indicator. Bollinger Bands are below the middle band, indicating downward pressure. The ADX at 45.56 is particularly noteworthy, signifying a strong downtrend. This robust bearish signal on the daily timeframe cannot be ignored, even if shorter timeframes show temporary resilience.
The Bull's Roadmap: Navigating Towards Higher Ground
For the bulls to regain control, the SP500 must first decisively break through the immediate resistance at $6,590. This level has acted as a ceiling in the 1H timeframe, and a sustained move above it, ideally with increasing volume, would be the first sign of renewed buying interest. Following this, the next significant hurdle lies at the 4-hour resistance level of $6,631.97. A break and hold above this point would invalidate the short-term bearish signals and could open the door for a move towards the next resistance at $6,643.40 on the daily chart. Confirmation of this bullish scenario would require a combination of factors: a cooling of geopolitical tensions, a less hawkish tone from the Federal Reserve, and perhaps stronger-than-expected economic data that doesn't overtly point to a recession.
The RSI on the 1-hour chart needs to push above 50, ideally towards 60, to confirm strengthening bullish momentum. Simultaneously, the MACD would need to cross back above its signal line, and the ADX would ideally need to show a decrease in trend strength below 20, indicating that the previous downtrend is losing steam rather than a new one beginning. On the 4-hour chart, the Stochastic needs to move out of the overbought territory or at least hold its current levels without a sharp reversal, while the MACD continues to show positive momentum. The daily timeframe remains the biggest challenge; for a sustained bullish move, the RSI needs to climb decisively above 40, and the MACD must eventually cross back above its signal line, breaking the strong bearish trend.
A key factor to watch would be how the market interprets upcoming economic data. For instance, if the upcoming USD economic data, such as the PMI readings (actual 52.4, forecast 51.5), continue to show resilience, it might support the dollar and put pressure on equities, or it could be interpreted as a sign of economic strength that the SP500 can eventually rally on. This ambiguity means that price action around the $6,590 and $6,631.97 levels will be paramount. A clean break above $6,643.40, the daily resistance, would be a significant bullish development, potentially targeting the $6,689.90 level and beyond.
Where Bears Take Control: The Downside Risk Scenario
The bearish scenario gains traction if the SP500 fails to hold its ground at the current $6,590 level. A close below this psychological mark on the 1-hour chart would be the first indication of selling pressure. This would likely be exacerbated by a break of the 1-hour support at $6,540.32, which would then target the 4-hour support at $6,543.37. If the selling pressure intensifies, driven by deteriorating geopolitical news or unexpectedly weak economic data, the index could easily fall towards the daily support level of $6,536.20. A decisive breach of this level would confirm the bearish trend on the daily chart, potentially opening up a cascade towards $6,475.50 and further down.
The technical indicators on the shorter timeframes already hint at this possibility. The 1-hour RSI is trending down, MACD is negative, and Stochastic is showing a bearish signal. If these conditions persist or worsen, a move lower is highly probable. On the 4-hour chart, while the MACD is positive, the Stochastic in the overbought zone is ripe for a reversal, which could align with the bearish momentum seen on the 1-hour chart. The daily chart's strong bearish trend (ADX at 45.56) provides a solid foundation for a downward move, meaning that any break below key support levels could lead to a rapid acceleration of losses.
Geopolitical events remain the primary wildcard. Any escalation in the Middle East or unexpected news from major central banks could trigger a sharp risk-off move, leading to a sell-off in equities. For example, if oil prices continue to surge due to supply disruptions, triggering fears of runaway inflation, the market might price in a more aggressive Fed stance, which would be detrimental to stock prices. The unexpected build in US crude oil inventories (2.3 million barrels) might offer a temporary reprieve for oil prices, but the underlying supply concerns from the Middle East likely overshadow this data point. Furthermore, if the DXY continues its ascent above 99.50, it would add another layer of pressure on the SP500.
The Waiting Game: Range-Bound Consolidation
Given the conflicting signals across different timeframes and the uncertainty surrounding geopolitical events and economic data, a period of consolidation around the $6,590 level is also a distinct possibility. In this scenario, the SP500 might trade within a defined range, unable to muster the conviction for a significant breakout in either direction. The immediate resistance at $6,590 and the 4-hour resistance at $6,631.97 would cap upside moves, while the 1-hour support at $6,540.32 and the 4-hour support at $6,543.37 would act as floors.
This range-bound environment would be characterized by choppy price action, where short-term traders might find opportunities, but longer-term trends remain unclear. The ADX values across all timeframes (1H: 15.75, 4H: 19.73, 1D: 45.56) predominantly indicate weak to moderate trending conditions, especially on the shorter timeframes, which supports the idea of a consolidation phase. The RSI values hovering around the 50 mark on the 1H and 4H charts also reflect this indecision. However, the strong bearish trend on the daily chart (ADX 45.56) suggests that any consolidation might be a temporary pause before a potential move lower.
For consolidation to persist, key economic releases would need to be largely in line with expectations, and geopolitical news would need to remain relatively stable, or at least not escalate dramatically. If major catalysts are absent, traders might adopt a wait-and-see approach, leading to sideways price action. This could also be a period where institutional players are repositioning themselves ahead of major events like upcoming Fed speeches or significant economic reports. The market might be looking for more clarity on the inflation outlook and the Fed's reaction function before committing to a new direction.
Bearish Scenario: Pressure Mounts Below $6,590
60% ProbabilityNeutral Scenario: Choppy Consolidation Around $6,590
30% ProbabilityBullish Scenario: Breaking the Resistance Barrier
10% ProbabilityGiven the current technical indicators, particularly the strong bearish trend on the daily chart (ADX 45.56) and the immediate resistance at $6,590, the most probable scenario is a continuation of downward pressure or consolidation. The geopolitical backdrop and rising oil prices further support a cautious, risk-off sentiment, making a strong bullish breakout less likely in the short term. Therefore, the 60% probability assigned to the bearish scenario reflects the confluence of technical weakness and fundamental headwinds. The neutral scenario, with a 30% probability, acknowledges the market's current indecision and the possibility of range-bound trading.
The bullish scenario, with only a 10% probability, would require a significant shift in market sentiment, such as de-escalation in the Middle East, dovish signals from the Fed, or surprisingly strong economic data that contradicts recession fears. Until such catalysts emerge, the path of least resistance appears to be downwards or sideways.
What I'm Watching This Week
My attention is sharply focused on a few key triggers that will dictate the SP500's next move. Firstly, the price action around the critical $6,590 level is paramount. A decisive break below this on a 1-hour closing basis would confirm the bearish bias. Secondly, I'll be closely monitoring oil prices; any further surge above $102 for Brent or $92 for WTI could ignite inflation fears and trigger a risk-off sentiment. Thirdly, upcoming US economic data, particularly any releases that significantly deviate from forecasts, will be crucial. For instance, a sharper-than-expected contraction in PMI or a weaker jobs report could accelerate the bearish trend. Conversely, surprisingly strong data might offer a temporary reprieve, but the overarching geopolitical concerns might limit any significant upside.
Frequently Asked Questions: SP500 Analysis
What happens if SP500 breaks below the $6,590 support level today?
If the SP500 closes below $6,590 on the 1-hour chart, it signals increasing bearish momentum. This could lead to a test of the next support at $6,540.32, with a potential downside target towards the daily support at $6,475.50 if the trend accelerates.
Should I consider buying the SP500 at current levels around $6,590 given the mixed signals?
Buying at current levels carries significant risk due to the immediate resistance at $6,590 and the strong bearish signals on the daily chart. A more prudent approach would be to wait for confirmation of a bullish reversal, such as a sustained break above $6,631.97, or to look for shorting opportunities on a confirmed break below $6,590.
Is the RSI at 48.64 on the 1-hour chart a sell signal for the SP500 right now?
An RSI of 48.64 is in neutral territory but trending downwards, suggesting waning bullish momentum rather than a definitive sell signal. While it doesn't warrant an immediate sell, it indicates caution and aligns with the potential for downside if key support levels are breached.
How will the ongoing Middle East tensions and rising oil prices affect the SP500 this week?
Escalating geopolitical tensions and higher oil prices feed inflation concerns, potentially pressuring the SP500 by increasing the risk of further Fed tightening or economic slowdown. This could lead to a risk-off sentiment, pushing the index towards its support levels, particularly if the DXY continues to strengthen above 99.50.
Track markets in real-time
AI-powered analysis, technical indicators and real-time price data.
Join Our Telegram Channel
Breaking market news, AI analysis and trading signals instantly.
Join Channel