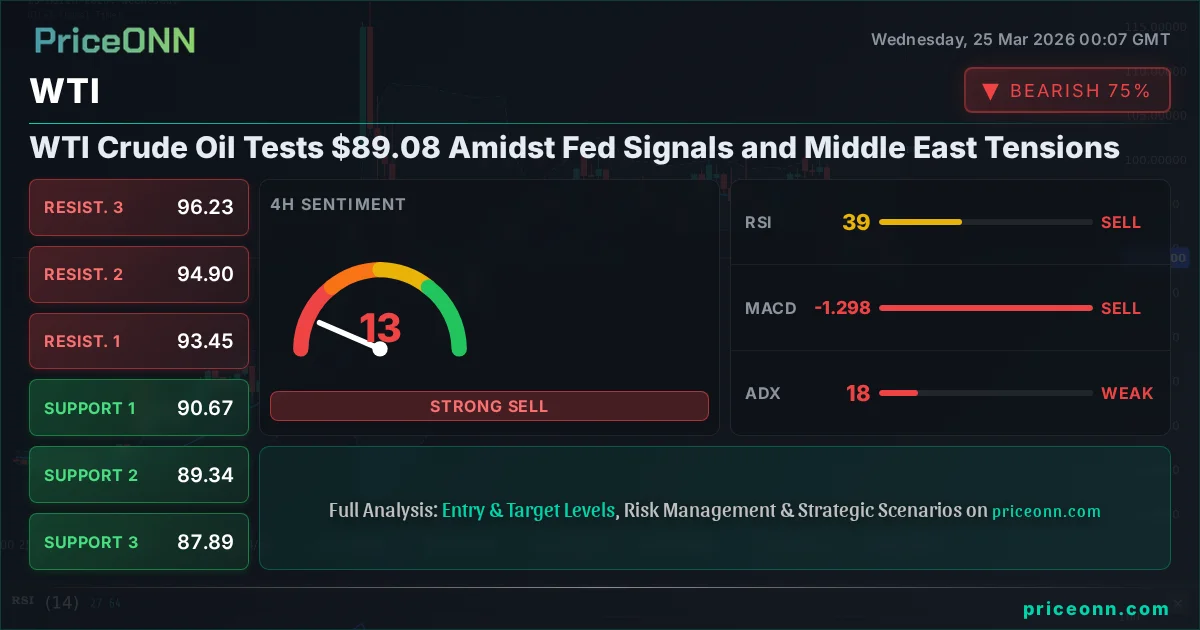
WTI Crude Oil Tests $89.08 Amidst Fed Signals and Middle East Tensions
WTI crude oil hovers near $89.08 as traders weigh hawkish Fed signals and escalating geopolitical risks in the Middle East. Analysis suggests a critical juncture ahead.
WTI crude oil is currently navigating a pivotal moment, trading at $89.08 as the market grapples with a confluence of factors including hawkish Federal Reserve signals, persistent geopolitical tensions in the Middle East, and the ongoing debate around global supply and demand dynamics. This price point finds WTI hovering near its immediate resistance levels, making the next few trading sessions crucial for determining its short-to-medium term trajectory. The interplay between inflationary pressures, central bank policy expectations, and actual physical market flows creates a complex tapestry that traders must meticulously unravel.
- WTI trades near $89.08, facing resistance at $89.69, with the 1H chart showing a weak trend (ADX: 14.61).
- Critical support for WTI sits at $88.15, a level that must hold to prevent a sharper decline towards $87.32.
- The 1D chart shows a strong bullish trend (ADX: 57.93), but current 1H indicators suggest a short-term pullback is possible.
- Hawkish Fed signals and Middle East tensions are key macro drivers influencing WTI's correlation with DXY and gold.
The Bull's Roadmap: Navigating Towards $90+
Holding the Line at $89.08
For WTI crude to extend its bullish momentum, maintaining a foothold above the current $89.08 mark is paramount. The 1-hour technical indicators, while mixed, lean towards a potential continuation, with a strong buy signal (7 out of 8 indicators) and positive MACD momentum. However, the weak trend strength indicated by the ADX at 14.61 suggests that any upward move might lack conviction and could be susceptible to sharp reversals. Traders are keenly watching the $89.69 level as the first significant hurdle. A decisive break and hold above this resistance, ideally with increasing volume, would signal a potential continuation towards the next resistance at $90.40 and then $91.23. The bullish sentiment on the 1-hour timeframe, despite the conflicting signals on longer timeframes, suggests that short-term traders might be looking for an entry on any dips towards the $88.15 support, anticipating a move higher.
The Influence of Global Demand and OPEC+ Dynamics
The fundamental picture for WTI remains a delicate balancing act between global demand expectations and supply-side management. While China's economic indicators have shown some resilience, concerns linger about the pace of its recovery, which is a critical component of global oil demand. The recent surge in oil prices, with Brent crude futures climbing over 2% to $98.25 and WTI crude futures following suit, was primarily driven by geopolitical instability in the Middle East. This narrative, however, needs to be assessed against the backdrop of OPEC+ production decisions. If the cartel maintains its output cuts, particularly Saudi Arabia's voluntary reduction of 1 million barrels per day, it could provide a floor under prices. The market is also paying close attention to inventory levels. Significant draws in crude oil inventories would further support the bullish case, while builds could quickly dampen sentiment. The current price action near $89.08 suggests that the market is pricing in some of these supply constraints, but a sustained rally will likely require stronger demand signals or further supply disruptions.
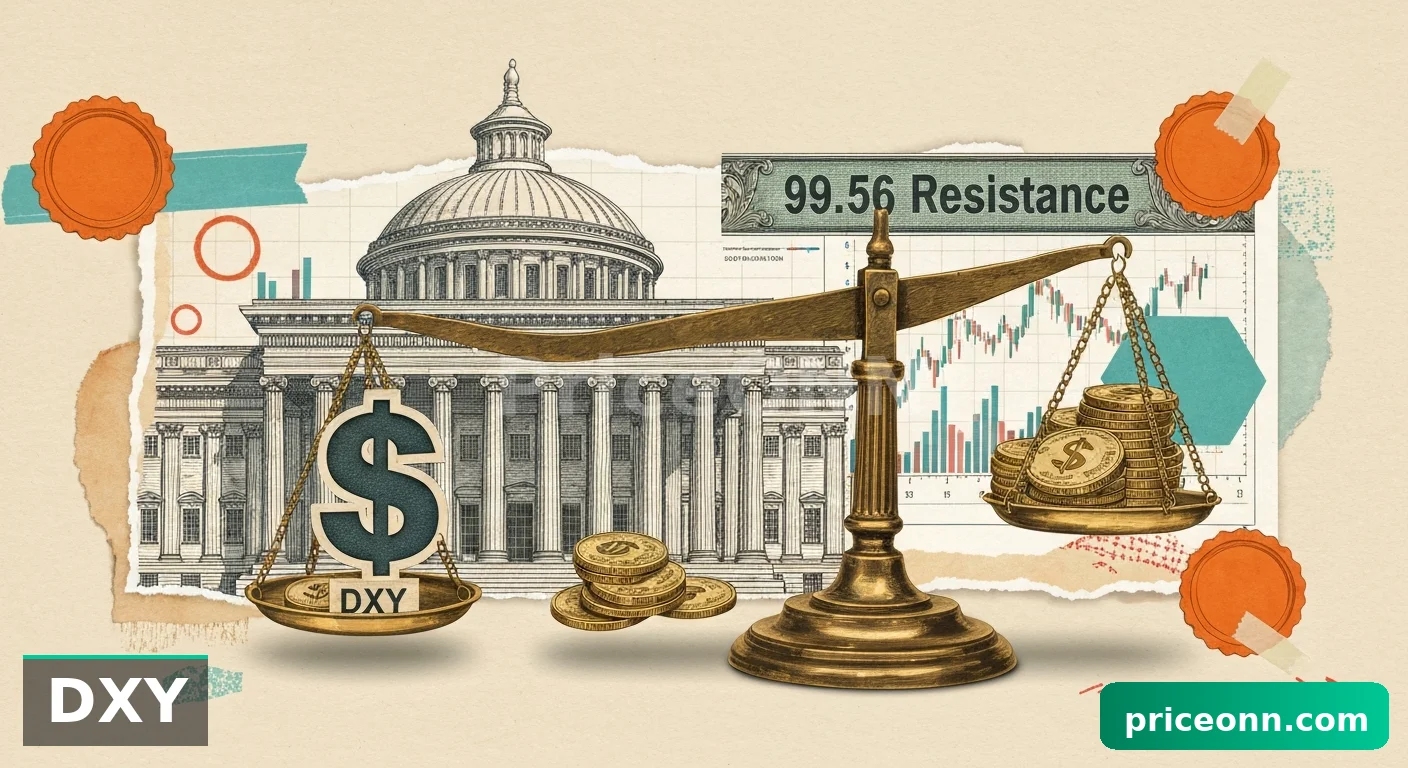
Correlation with DXY and Equity Markets
The relationship between WTI and the US Dollar Index (DXY) is a key factor to monitor. Currently, the DXY is trading at 98.95, showing a slight daily increase. Historically, a strengthening dollar often puts downward pressure on dollar-denominated commodities like oil, as they become more expensive for holders of other currencies. However, this relationship can be nuanced. If the dollar's strength is driven by safe-haven demand amid escalating geopolitical tensions, as suggested by some recent news, it can coincide with higher oil prices due to the underlying risk-off sentiment. The DXY's 1-hour trend is neutral with a slight bearish lean (ADX: 17.57), while the daily trend is bullish (ADX: 32.74). This divergence means the dollar's impact on WTI could be inconsistent in the short term. Similarly, equity markets provide context. The SP500 is at 6599.3, showing a daily rise, suggesting risk appetite is present. A sustained rally in equities typically supports oil prices, while a sharp sell-off could signal broader economic concerns that would weigh on crude demand.
Where Bears Take Control: Testing Lower Ground
The $88.15 Support Threshold
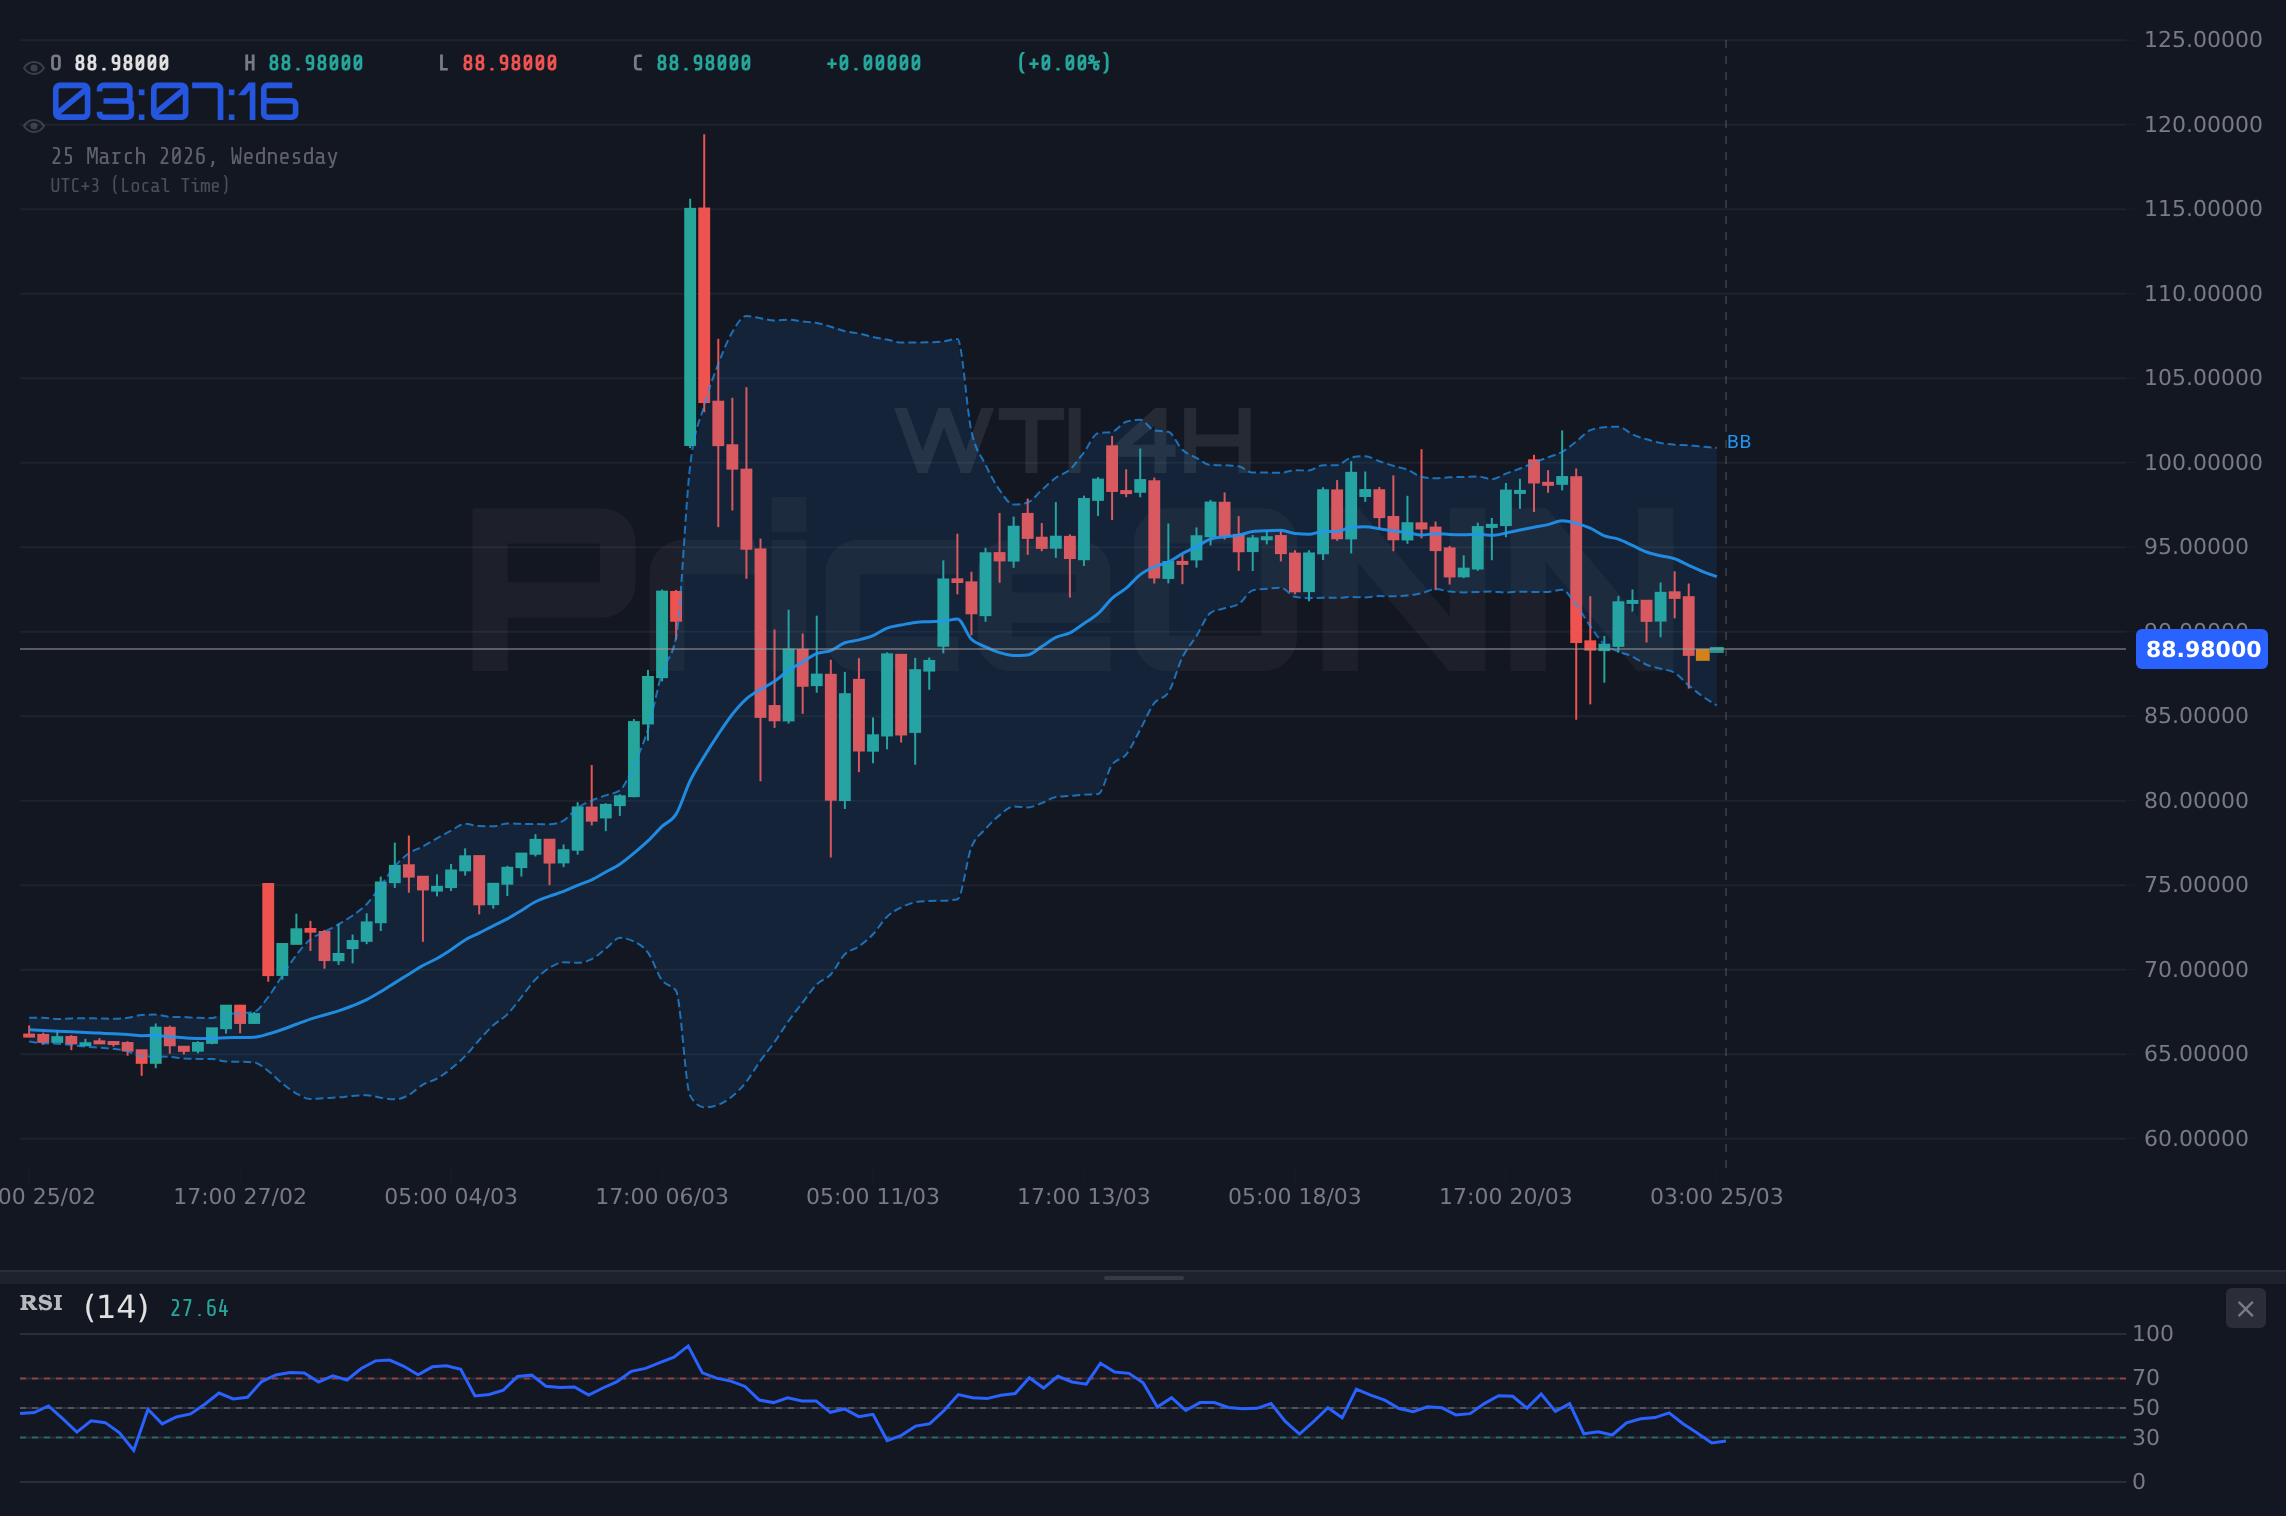
The bearish scenario for WTI hinges on its ability to break below key support levels. The immediate support on the 1-hour chart is at $88.15. A close below this level would invalidate the short-term bullish setup and likely trigger stop-loss orders, accelerating a move towards the next support at $87.32. On the 4-hour chart, support is found at $90.67, $89.34, and $87.89. The $89.34 level is particularly significant as it aligns with the current price action and the 4-hour chart's neutral trend (ADX: 17.6). If WTI fails to hold the $89.08 mark and subsequently breaks below $88.15, the bears could gain significant traction, targeting the $87.32 and $86.61 levels. The daily chart, despite its strong bullish trend (ADX: 57.93), shows significant support at $82.04, $74.86, and $64.92. While these are longer-term levels, a decisive break of the immediate supports could signal a deeper correction, especially if macroeconomic headwinds intensify.
The Impact of Easing Geopolitical Tensions and Supply Surges
A significant risk to the current bullish narrative for WTI would be a de-escalation of geopolitical tensions in the Middle East. If diplomatic efforts yield positive results and the immediate threat of supply disruptions diminishes, the risk premium embedded in oil prices could quickly evaporate. Recent news indicating a potential 'peace pivot' and skepticism surrounding it highlights the market's sensitivity to these developments. Furthermore, any unexpected increase in non-OPEC supply, such as a faster-than-anticipated rise in US shale production or the release of strategic petroleum reserves, could also pressure prices downwards. The US Energy Information Administration (EIA) inventory data, due later this week, will be critical. A larger-than-expected build in crude oil stocks could signal weakening demand or robust supply, leading to a bearish price reaction. The current ADX values across timeframes are generally low on the 1-hour and 4-hour charts (14.61 and 17.6 respectively), suggesting that the market is not yet strongly committed to a directional move. This makes WTI vulnerable to sharp reversals if the fundamental narrative shifts.
Central Bank Tightening and Demand Destruction Concerns
While current inflation data from Australia remained steady at 3.8%, the broader global inflationary picture remains a concern for central banks. Hawkish signals from the Federal Reserve, even if they are pausing rate hikes, can still dampen economic activity and, consequently, oil demand. If Fed officials continue to emphasize the need to keep interest rates higher for longer, citing persistent inflation, this could lead to slower economic growth in major economies like the US and Europe. Such a scenario raises concerns about 'demand destruction' – where high energy prices and tighter monetary policy curb economic activity to the point where oil consumption falls. The recent strength in the US Dollar Index (DXY) towards 99.50, buoyed by rising Treasury yields and hawkish Fed signals, already adds a headwind for oil prices. A sustained period of tighter monetary policy globally could significantly impair the demand side of the oil market, pushing WTI prices lower despite supply constraints.
The Waiting Game: Stuck in a Range?
Consolidation Around $89.08
Given the conflicting signals across different timeframes and indicators, WTI could enter a period of consolidation around the current $89.08 level. The 1-hour chart shows a strong buy signal, but the weak trend strength (ADX 14.61) suggests a lack of conviction. Conversely, the 1-hour chart's RSI at 38.01 indicates a bearish sentiment, while the daily chart's RSI at 57.09 suggests a neutral to slightly bullish leaning. This tug-of-war between short-term momentum and longer-term trend signals creates conditions for range-bound trading. In such a scenario, prices might oscillate between the immediate support at $88.15 and resistance at $89.69. The ADX values on the 1-hour and 4-hour charts are relatively low, reinforcing the idea of a choppy, directionless market in the near term. Traders would likely adopt a range-trading strategy, buying near support and selling near resistance, awaiting a clearer directional signal. The key would be to watch for increased volatility and volume that could signal the end of this consolidation phase.
Economic Calendar Watchlist: Key Data Points
The upcoming economic calendar holds several events that could provide the catalyst for breaking WTI out of its current range. Crucially, the US EIA crude oil inventory data is a primary focus. Any significant drawdowns would likely support prices, while builds could trigger a sell-off. On the macroeconomic front, upcoming US data releases, such as PMI figures and employment data (if any are scheduled in the coming days, though not explicitly listed in the provided data for the immediate 3-7 day window), will be closely watched for indications of economic health and their potential impact on oil demand. The market's reaction to any shifts in Federal Reserve rhetoric will also be critical. If Fed officials continue to signal a higher-for-longer interest rate environment, it could dampen economic growth expectations and weigh on oil prices. For now, the focus remains on the immediate supply-demand balance and geopolitical headlines.
What I'm Watching: Triggers for the Next Move
The market is at a critical juncture. The bullish trend on the daily chart is strong (ADX: 57.93), but short-term indicators and immediate resistance levels suggest caution. The immediate price action around $89.08 is the key battleground. I'll be watching for a decisive close above $89.69 on the 1-hour chart, ideally accompanied by an increase in volume and a strengthening ADX, as a bullish confirmation. Conversely, a break and sustained hold below $88.15 would signal a bearish reversal, potentially targeting $87.32. The geopolitical situation in the Middle East remains a wildcard; any escalation or de-escalation could rapidly shift the sentiment and price direction. Furthermore, the upcoming EIA inventory report will be a critical data point to watch for immediate directional cues.
Bearish Scenario: The Downside Risk
35% ProbabilityNeutral Scenario: Range-Bound Chop
30% ProbabilityBullish Scenario: Breaking Higher
35% ProbabilityFrequently Asked Questions: WTI Analysis
What happens if WTI breaks below the $88.15 support level?
If WTI closes below $88.15 on the 1-hour chart, it would invalidate the short-term bullish setup and could trigger a move towards $87.32. This scenario is supported by a potential shift in market sentiment if geopolitical tensions ease or if US crude inventories rise unexpectedly.
Should I buy WTI at current levels near $89.08 given the mixed technical signals?
Buying at current levels carries risk due to the weak 1-hour trend (ADX 14.61) and immediate resistance at $89.69. A more prudent approach might be to wait for a confirmed breakout above $89.69 or a pullback to $88.15 support, depending on your risk tolerance and trading strategy.
Is the RSI at 38.01 on the 1H chart a sell signal for WTI right now?
An RSI of 38.01 on the 1-hour chart indicates bearish momentum in the short term, suggesting potential for a pullback. However, it's not yet in oversold territory, and the daily chart RSI at 57.09 remains neutral. Confirmation from price action and other indicators would be needed for a definitive sell signal.
How will upcoming US economic data, like PMI, affect WTI this week?
Stronger-than-expected PMI data would signal robust economic activity, potentially boosting oil demand and supporting WTI prices. Conversely, weaker data could raise concerns about economic slowdown, negatively impacting WTI. Traders will also watch for any shifts in Fed policy expectations driven by this data.
The energy market remains a dynamic arena, with WTI crude oil poised at a critical juncture. While the daily chart paints a bullish picture with strong trend strength (ADX: 57.93), the immediate intraday charts present a more cautious outlook, characterized by weak trend conviction and key resistance levels just above the current price of $89.08. The interplay of geopolitical risks, potential supply disruptions, and evolving central bank policies creates significant volatility. For traders, patience and a disciplined approach are key. Waiting for clear confirmation of a breakout above $89.69 or a decisive break below $88.15 will be crucial for navigating the potential price swings. The market is not yet offering a definitive path, so vigilance and adaptability will be the most valuable tools in the coming sessions.
| Indicator | Value | Signal | Interpretation |
|---|---|---|---|
| RSI (14) | 38.01 | Bearish | Short-term bearish momentum indicated. |
| MACD Histogram | -0.38 | Bearish | Negative momentum on 1H chart. |
| Stochastic | K=32.66, D=55.49 | Bearish | Bearish crossover on 1H chart. |
| ADX | 34.14 | Strong Trend | Strong downtrend on 1H chart. |
| Bollinger | Middle Band | Watch | Price below middle band on 1H. |
Track markets in real-time
AI-powered analysis, technical indicators and real-time price data.
Join Our Telegram Channel
Breaking market news, AI analysis and trading signals instantly.
Join Channel