Silver Dips: $67.14 Tests Support Near $63.11 as ADX Signals Strong Downtrend
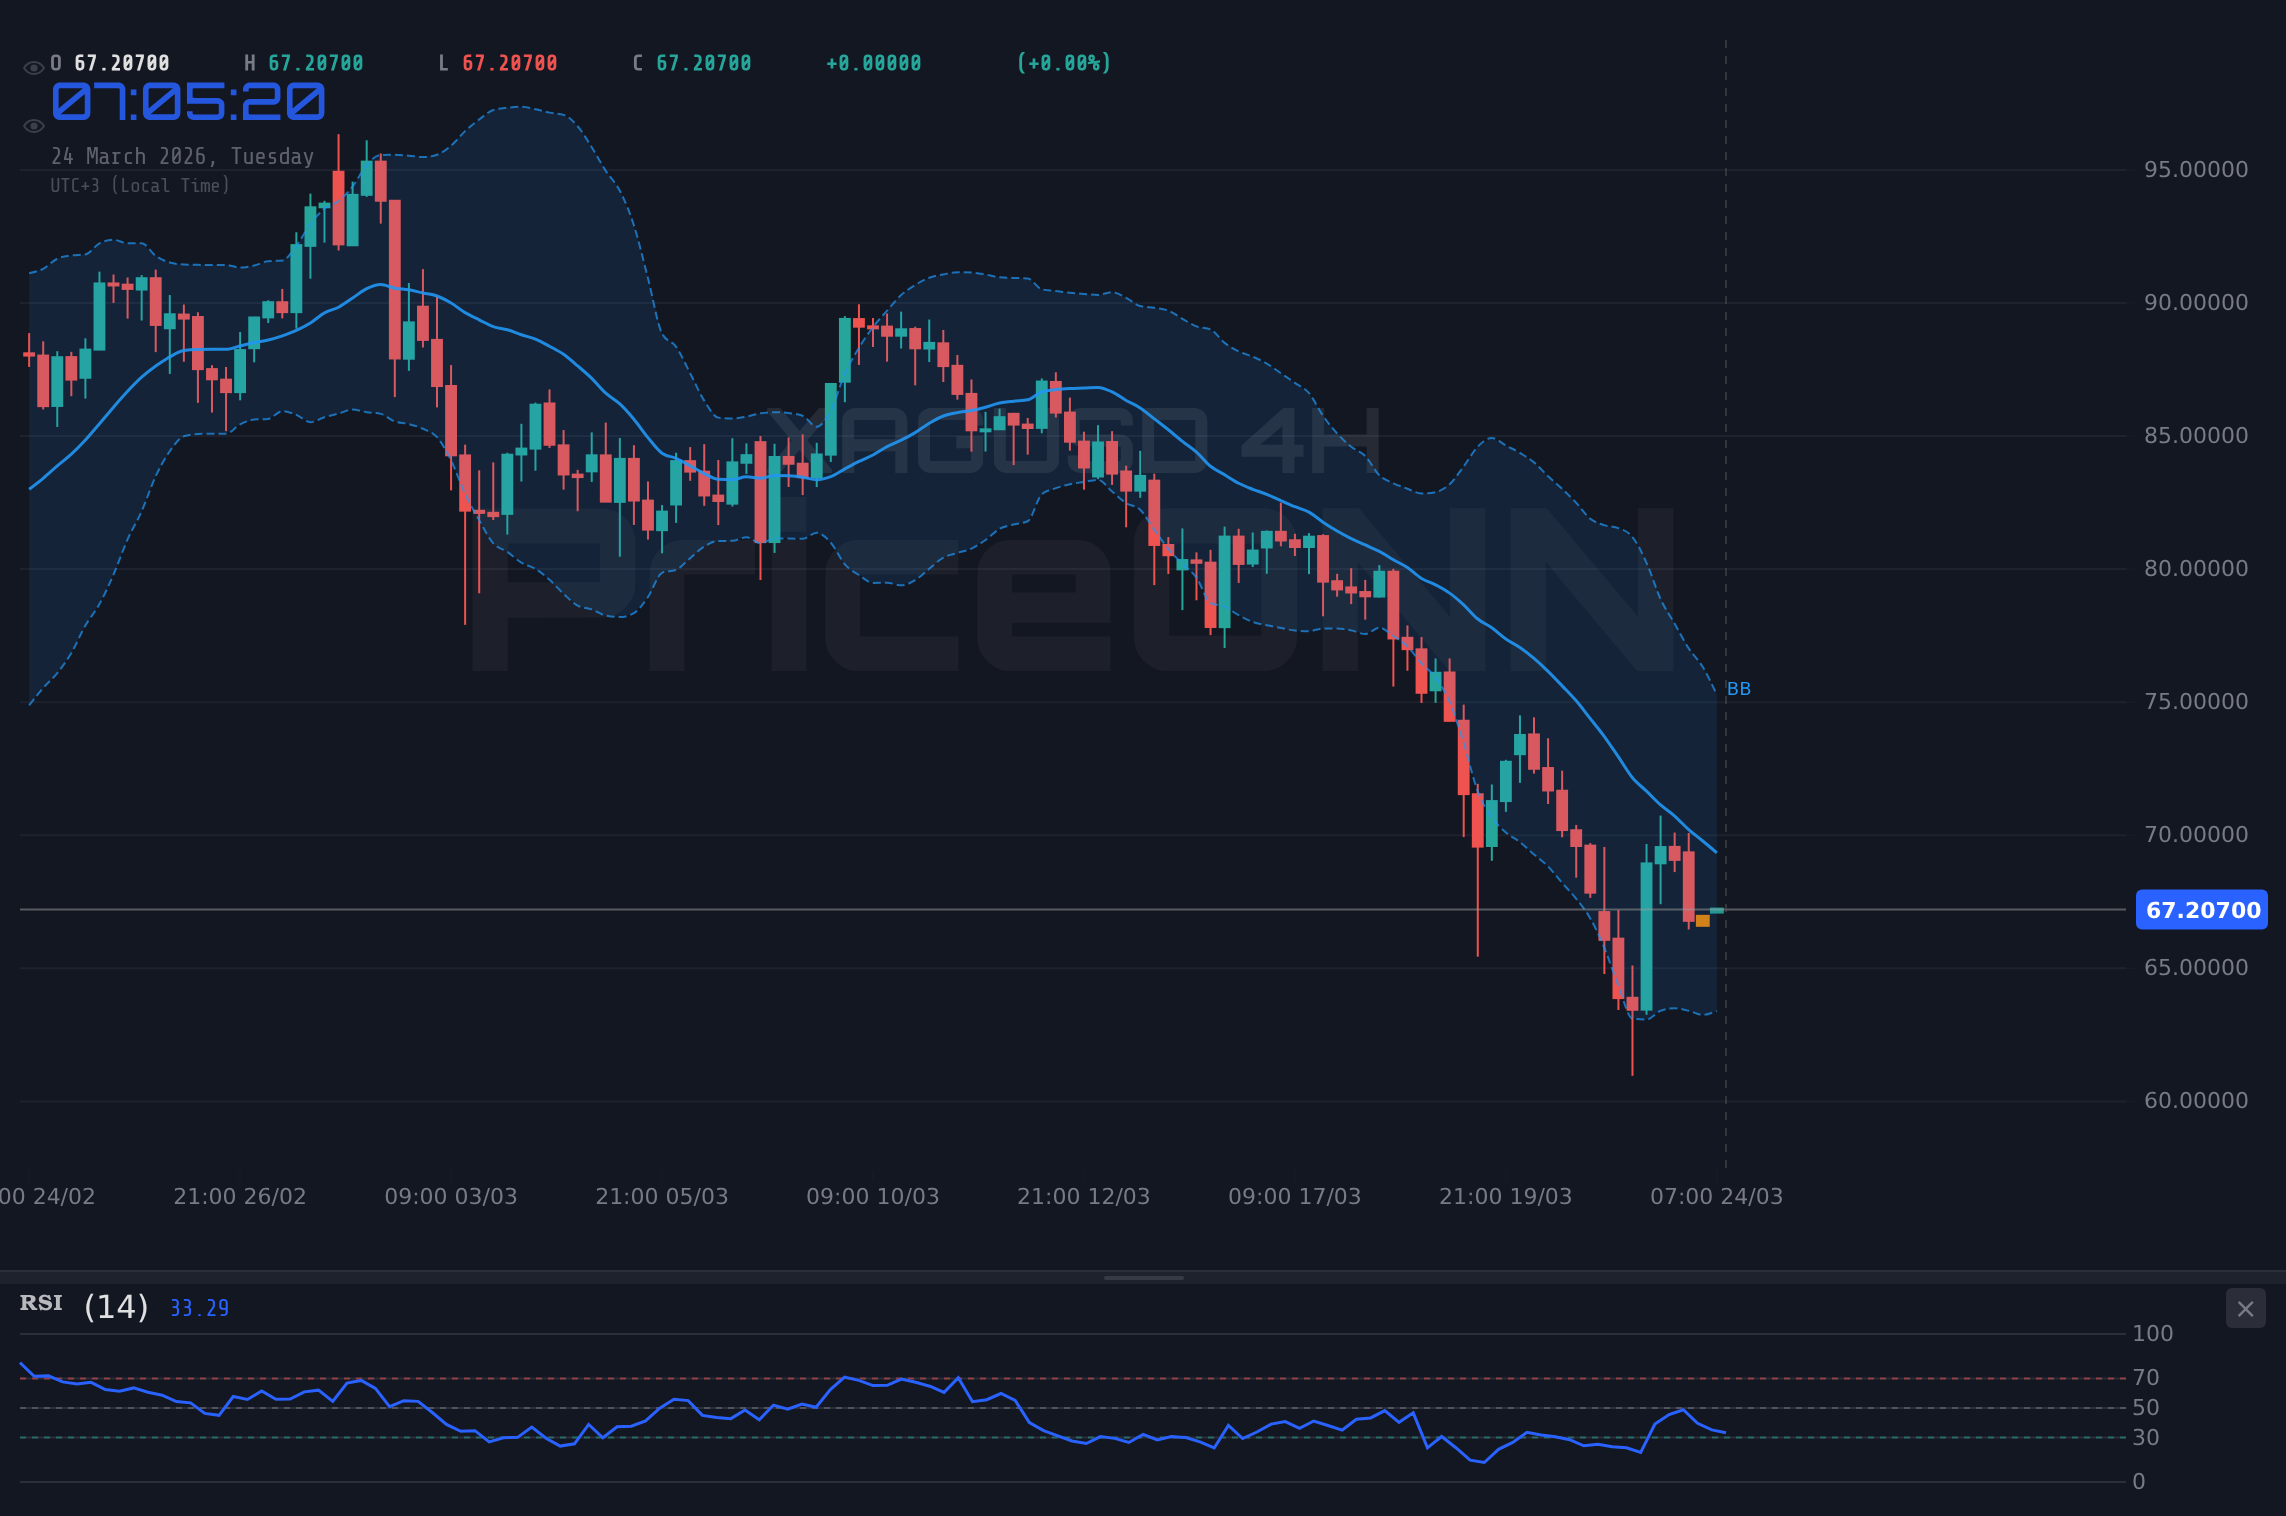
Silver (XAGUSD) is trading at $67.14, showing a strong bearish trend on the 4-hour chart (ADX 55.49). Key support lies at $63.11, while resistance is eyed at $72.89.
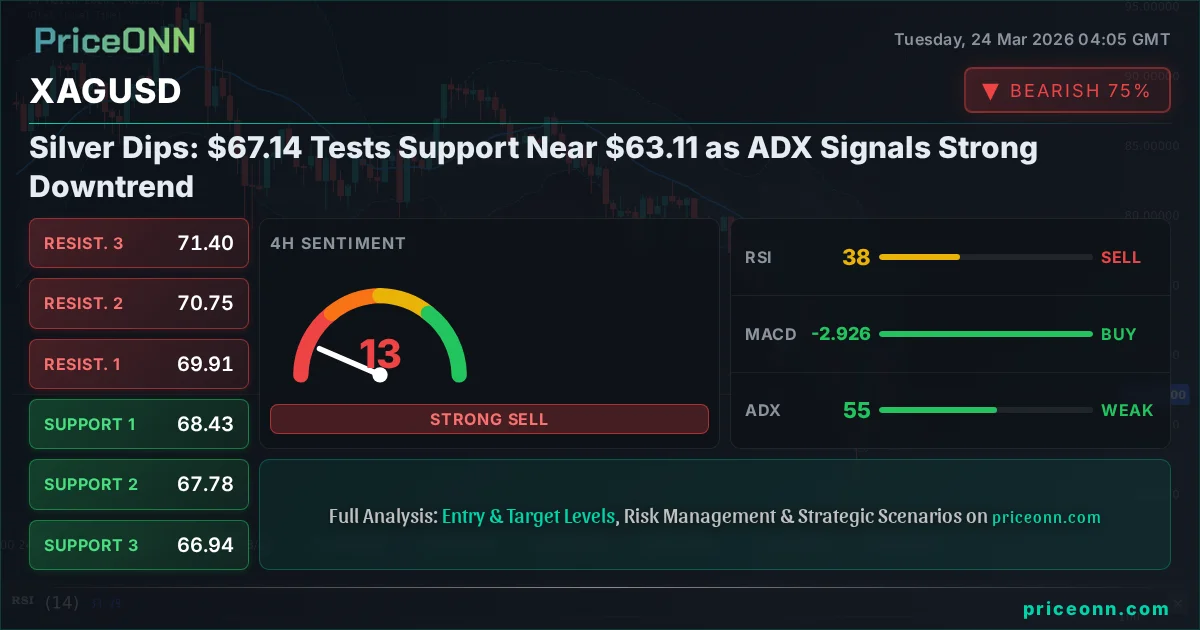
Silver (XAGUSD) is currently navigating a challenging period, trading at $67.14 after a notable dip. The downward momentum is significant, particularly on the 4-hour timeframe, where the Average Directional Index (ADX) screams a robust trend at 55.49. This suggests that the bears are firmly in control, pushing the price towards critical support levels. For traders watching the current silver price XAGUSD today analysis, the immediate focus is on whether the $63.11 floor can hold. The interplay between these levels, coupled with broader market sentiment and macroeconomic undercurrents, will dictate silver's next move.
- XAGUSD is trading at $67.14, with a strong bearish trend indicated by a 4H ADX of 55.49.
- Key support for silver is identified at $63.11, while the nearest resistance is at $72.89.
- The RSI(14) on the 4H chart is at 37.51, nearing oversold territory, suggesting potential for a rebound if support holds.
- Broader market correlations, including a rising DXY at 99.18 and a falling SP500 at 6553.05, contribute to the bearish pressure on silver.
The precious metals complex, particularly silver, is often seen as a barometer for global economic health and risk appetite. Today, XAGUSD is reflecting a risk-off sentiment, exacerbated by a strengthening US Dollar Index (DXY) now at 99.18 and a palpable downturn in major equity indices like the SP500, which has shed 0.41% to 6553.05. This correlation is not new; when the dollar strengthens and equity markets falter, assets like silver often come under pressure as investors flock to safer havens or reduce overall risk exposure. The current price action for XAGUSD today analysis clearly paints a picture of bearish dominance, with multiple timeframes aligning to signal further downside potential.
Delving into the technical indicators, the 4-hour chart presents a compelling, albeit bearish, narrative. The ADX, a measure of trend strength, stands at a formidable 61.54, indicating a very strong downtrend is in play. This is corroborated by the RSI(14) at 29.93, firmly within the oversold territory. While oversold conditions can sometimes precede a reversal, in the context of such a strong trend, they can also signal that more downside is possible before any significant correction occurs. The MACD is below its signal line, reinforcing the negative momentum. Bollinger Bands are also hugging the lower band, a classic sign of selling pressure. The divergence in Stochastic signals, where %K is above %D, offers a sliver of hope for a short-term bounce, but the overwhelming trend strength suggested by the ADX cannot be ignored. This is a market where caution is paramount for any silver price forecast.
Looking at the daily timeframe for XAGUSD, the picture becomes slightly more nuanced, though still predominantly bearish. The ADX here is lower at 25.72, indicating a moderately strong downtrend rather than the extreme strength seen on the 4H chart. The RSI(14) at 26.22 is deeply oversold, presenting a potential contrarian opportunity for those looking for a bottoming formation. However, the MACD remains negative, and the price is trading below the middle Bollinger Band, suggesting the downtrend is still the dominant force. The Stochastic K and D lines are in the oversold region, with K above D, hinting at a potential shift. This conflicting signal between the higher timeframes' strong bearish trend and the daily's oversold conditions creates a zone of uncertainty. It's a classic case of short-term exhaustion versus medium-term trend, making the XAGUSD support and resistance levels particularly critical.
The immediate price action is centered around the support levels provided. On the 1-hour chart, the first line of defense is seen at $4321.58, followed by $4277.23 and $4248.48. These are the levels traders are watching closely. However, the more significant support levels, based on the daily chart, are considerably lower: $4158.15, $3909.96, and a substantial $3720.98. Given the current price of $67.14, these lower daily support levels are currently out of reach, but they represent the ultimate targets if the bearish trend accelerates dramatically. For now, the focus remains on the immediate 1H and 4H supports. A decisive break below $4321.58 on the 1H chart would confirm the immediate bearish bias, while a hold and bounce could signal a temporary reprieve.
Resistance levels are equally important for understanding the potential upside for XAGUSD. On the 1-hour chart, resistance is marked at $4394.68, $4423.43, and $4467.78. These are the levels that would need to be cleared for any short-term bullish sentiment to emerge. On the 4-hour chart, resistance is seen at $4454.58, $4502.83, and $4538.79. The daily resistance, however, looms much higher at $4595.32, $4784.3, and $5032.49. The significant gap between the current price of $67.14 and these daily resistance points underscores the depth of the current downtrend. For any meaningful recovery to occur, silver would need to overcome not only the immediate selling pressure but also establish a firm foothold above several key resistance zones, a task that seems formidable given the current market conditions and the strong ADX readings.
The broader economic backdrop is crucial for understanding the fundamental drivers behind silver's current predicament. Inflationary pressures, while still a concern globally, may be showing signs of cooling in some regions, reducing the urgency for aggressive monetary tightening. However, geopolitical tensions, particularly in the Middle East, continue to inject volatility into energy markets and, by extension, commodity prices. Recent reports indicate that crude oil prices experienced a sharp sell-off, with Brent falling over 12% and WTI dropping more than 10%, due to diplomatic efforts. This easing in energy price spikes could indirectly reduce some inflationary concerns, potentially lessening the appeal of commodities like silver as an inflation hedge. The market is now keenly watching upcoming economic data, including PMI reports and employment figures, for further clues on the path of inflation and interest rates.
The US Dollar Index (DXY) is currently at 99.18, showing a clear upward trajectory. This strength in the dollar is a significant headwind for silver. Typically, a stronger dollar makes dollar-denominated commodities like silver more expensive for holders of other currencies, thereby dampening demand. Furthermore, a rising dollar often coincides with higher US Treasury yields, which increases the opportunity cost of holding non-yielding assets like silver. The current market sentiment suggests that investors are favoring the dollar as a safe-haven asset amidst global uncertainties, further reinforcing the bearish pressure on silver. This correlation between DXY and XAGUSD is a key element in any XAGUSD today analysis.
The equity markets are also providing a bearish signal for silver. The SP500 is down 0.41% at 6553.05, and the Nasdaq 100 has fallen 0.47% to 24069.13. This risk-off sentiment in equities often spills over into commodity markets. When investors become fearful, they tend to liquidate riskier assets, including commodities, and move towards perceived safer assets. While gold is often considered the primary safe-haven, silver's industrial demand component makes it more sensitive to economic slowdowns. The current weakness in stock markets suggests that economic growth concerns are weighing on investor minds, which is generally negative for industrial metals like silver. The XAGUSD price forecast must therefore consider this broader risk appetite.
The recent news regarding geopolitical tensions, while showing signs of de-escalation in some areas, continues to cast a shadow over energy markets. Reports of diplomatic efforts potentially easing crude oil prices could reduce some of the inflation premium that has benefited commodities. However, the situation remains fluid, and any resurgence in tensions could quickly reignite demand for silver as a hedge against inflation and geopolitical uncertainty. The market is currently processing mixed signals: easing energy prices suggest less inflationary pressure, but ongoing geopolitical risks keep safe-haven demand alive. This delicate balance makes the current XAGUSD market sentiment analysis particularly important for traders.
Examining the technical indicators further, the 1-hour RSI at 45.68 is in neutral territory but trending downwards, aligning with the bearish bias. The MACD here is negative, indicating bearish momentum. The Stochastic oscillator on the 1H is showing a bearish signal (%K < %D) and is moving towards oversold territory. The ADX at 20.27 on the 1H suggests a moderately trending market, not yet in a strong trend, but leaning towards a downtrend. This short-term picture suggests that while a bounce is possible, the path of least resistance appears to be downwards. The XAGUSD trading signals should therefore be approached with caution, looking for confirmation before entering any positions.
On the 4-hour chart, the RSI at 37.51 is nearing oversold conditions, which could offer a short-term buying opportunity if key support levels hold. However, the ADX at 61.54 signifies a very powerful downtrend, implying that oversold conditions might persist or even deepen before any significant reversal. The MACD is negative, and Bollinger Bands are below the middle band, reinforcing the bearish outlook. The Stochastic oscillator shows %K above %D, suggesting a potential upward move, but this is against a very strong trend. This conflict between indicators on the 4H chart highlights the importance of risk management. The XAGUSD key levels analysis must prioritize the strong trend signals.
The daily chart paints a picture of oversold conditions with an RSI at 26.22 and Stochastic deeply in the oversold zone. This suggests that silver might be due for a bounce, but the ADX at 25.72 still indicates a downtrend is in place. The MACD is negative, and prices are below the middle Bollinger Band, confirming the bearish bias. The conflict between the oversold daily indicators and the strong bearish trend on the 4H chart creates a critical juncture. Traders looking for XAGUSD breakout opportunities should be wary of false signals in either direction. Confirmation of a sustained move above resistance or a decisive break below support will be crucial.
Given the current technical setup and market correlations, the prevailing bias for XAGUSD is bearish. The strong ADX readings on the 4H and 1D charts, coupled with the strengthening dollar and risk-off sentiment in equities, point towards potential further downside. While oversold conditions on the daily chart might offer a temporary reprieve, the overwhelming trend strength suggests that any rallies are likely to be met with selling pressure. The key levels to watch remain the support at $63.11 and resistance at $72.89 on the daily timeframe. A break below $63.11 would open the door for a significant decline, while a sustained move above $72.89 would be needed to signal a potential trend change. For now, the XAGUSD market sentiment analysis leans towards caution and favoring short positions on any bounces towards resistance.
The economic calendar presents several key events that could influence silver's trajectory in the coming days. Upcoming inflation data, such as CPI releases, will be closely scrutinized for signs of persistent price pressures, which could bolster silver's appeal as an inflation hedge. Similarly, employment figures like Non-Farm Payrolls (NFP) will provide insights into the health of the US economy and guide Federal Reserve policy expectations. Any indication of a hawkish shift from the Fed could strengthen the dollar and pressure silver, while signs of economic weakness might support safe-haven demand for precious metals. The market is also anticipating PMI data from major economies, which will offer a snapshot of global manufacturing and services activity.
The recent news highlighting potential de-escalation in Middle East tensions, leading to a drop in crude oil prices, has somewhat dampened the inflation hedge narrative for commodities. If this trend continues, it could reduce the fundamental support for silver. However, geopolitical risks are notoriously unpredictable, and any renewed flare-up could instantly shift market sentiment back towards safe-haven assets. The interplay between these macro factors and the clear bearish technical signals on XAGUSD creates a complex trading environment. The XAGUSD trading signals derived from technical indicators should be considered within this broader fundamental context.
The technical picture for XAGUSD is predominantly bearish, characterized by strong downtrend signals on multiple timeframes, particularly the 4-hour chart. The current price of $67.14 is being tested against key support levels, with the daily support at $63.11 being a significant point of interest. While oversold conditions on the daily chart hint at a potential for a bounce, the prevailing trend strength suggests that rallies may be short-lived. The strengthening dollar and risk-off sentiment in equity markets further contribute to the bearish outlook. Traders should exercise caution, monitor key levels closely, and await clear confirmation before committing to any positions. Patience, coupled with disciplined risk management, will be crucial in navigating these choppy market conditions.
Bearish Scenario: Trend Continuation
70% ProbabilityNeutral Scenario: Consolidation and Range Play
20% ProbabilityBullish Scenario: Oversold Bounce
10% Probability| Indicator | Value | Signal | Interpretation |
|---|---|---|---|
| RSI (14) | 37.51 | Neutral | Nearing oversold on 4H, but strong trend persists. |
| MACD | Negative | Bearish | Momentum favors sellers. |
| Stochastic | K=67.23, D=39.21 | Bullish Signal | Potential short-term bounce signal, but against strong trend. |
| ADX | 61.54 | Strong Trend | Confirms a very strong downtrend on 4H. |
| Bollinger Bands | Below Middle Band | Bearish | Price action indicates selling pressure. |
Frequently Asked Questions: XAGUSD Analysis
What happens if XAGUSD breaks below the $63.11 support level?
A break below $63.11 (S1 Daily) would invalidate the neutral scenario and confirm the bearish trend. The next significant support level to watch would be $57.15 (S2 Daily), potentially targeting $53.33 (S3 Daily) if the downtrend accelerates.
Should I buy XAGUSD at current levels of $67.14 given the oversold RSI on the daily chart?
Buying at $67.14 carries significant risk due to the strong bearish trend on the 4H chart (ADX 61.54). While the daily RSI is oversold, a bullish scenario requires holding above $63.11 and seeing clear bullish divergence. A 10% probability is assigned to this scenario, suggesting caution.
Is the ADX at 61.54 a sell signal for XAGUSD on the 4-hour chart?
An ADX reading of 61.54 indicates an extremely strong trend, in this case, a downtrend. While not a direct sell signal itself, it confirms the dominance of the bearish momentum and suggests that any upward corrections are likely to face significant selling pressure.
How will the rising DXY at 99.18 affect XAGUSD this week?
A rising DXY generally puts downward pressure on XAGUSD, as it makes dollar-denominated commodities more expensive for foreign buyers and increases the opportunity cost of holding non-yielding assets. The current DXY level of 99.18 reinforces the bearish outlook for silver, especially if it continues to climb.
Track markets in real-time
AI-powered analysis, technical indicators and real-time price data.
Join Our Telegram Channel
Breaking market news, AI analysis and trading signals instantly.
Join Channel