GBPUSD Hovers Near $1.34: Bearish Trend Tests Support at $1.3280
GBPUSD trades around $1.34, with a bearish trend testing critical support near $1.3280. Key economic data and DXY movements are crucial.
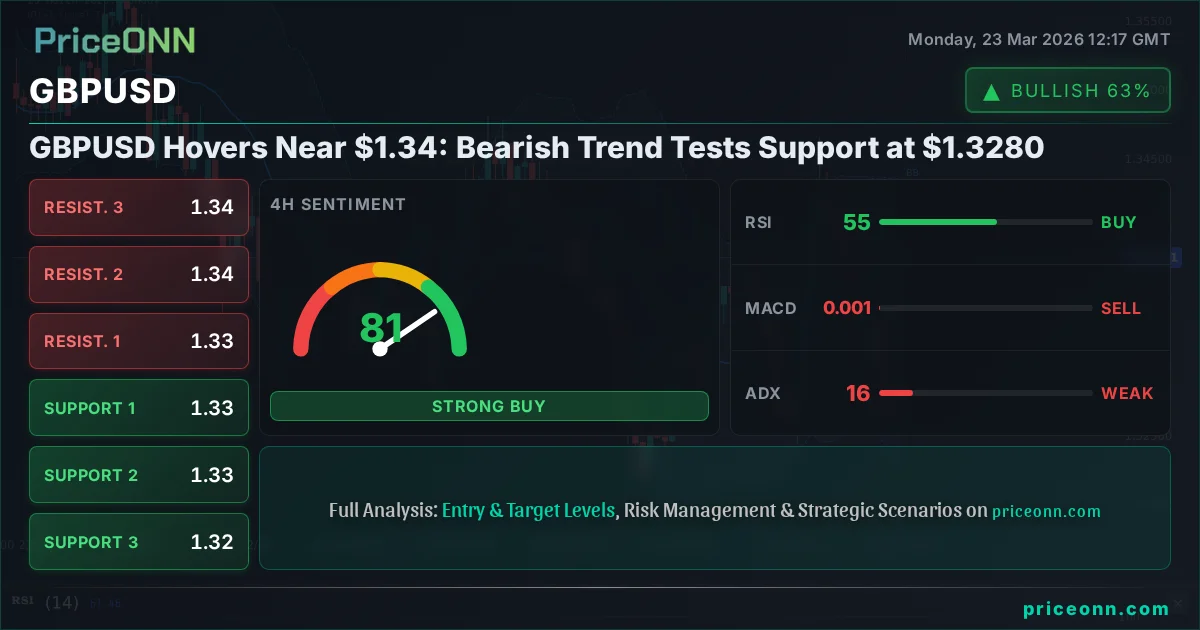
GBPUSD is currently locked in a bearish trend, hovering just above the significant $1.34 mark. This pivotal price action brings the critical support level at $1.3280 into sharp focus. As traders digest mixed signals from the UK economy and a strengthening US Dollar, the question on everyone's mind is whether this key support will hold, or if the pair is destined for further declines. Understanding the interplay between fundamental drivers, technical indicators, and broader market sentiment is paramount for navigating this volatile pair.
- GBPUSD is trading near $1.34, with a bearish trend pressuring key support at $1.3280.
- The US Dollar Index (DXY) is currently at 99.36, its strength correlating with downward pressure on GBPUSD.
- RSI on the 1D chart sits at 44.13, indicating room for further downside before becoming oversold.
- Upcoming UK inflation data and Fed policy expectations will be critical catalysts this week.
The Bearish Undercurrent: Why GBPUSD Is Under Pressure
The narrative surrounding GBPUSD has been decidedly bearish in recent weeks, a sentiment reinforced by the current market data. The pair is trading at $1.34, a level that belies the underlying pressure. The daily change of -0.19% (-0.00256) might seem minor, but it's part of a larger downtrend that has seen GBPUSD test lower grounds. This persistent weakness is largely driven by a confluence of factors, primarily centered around monetary policy divergence and economic outlooks between the UK and the US. The US Dollar Index (DXY), currently at 99.36, continues to exert gravitational pull, acting as a significant headwind for the Sterling.
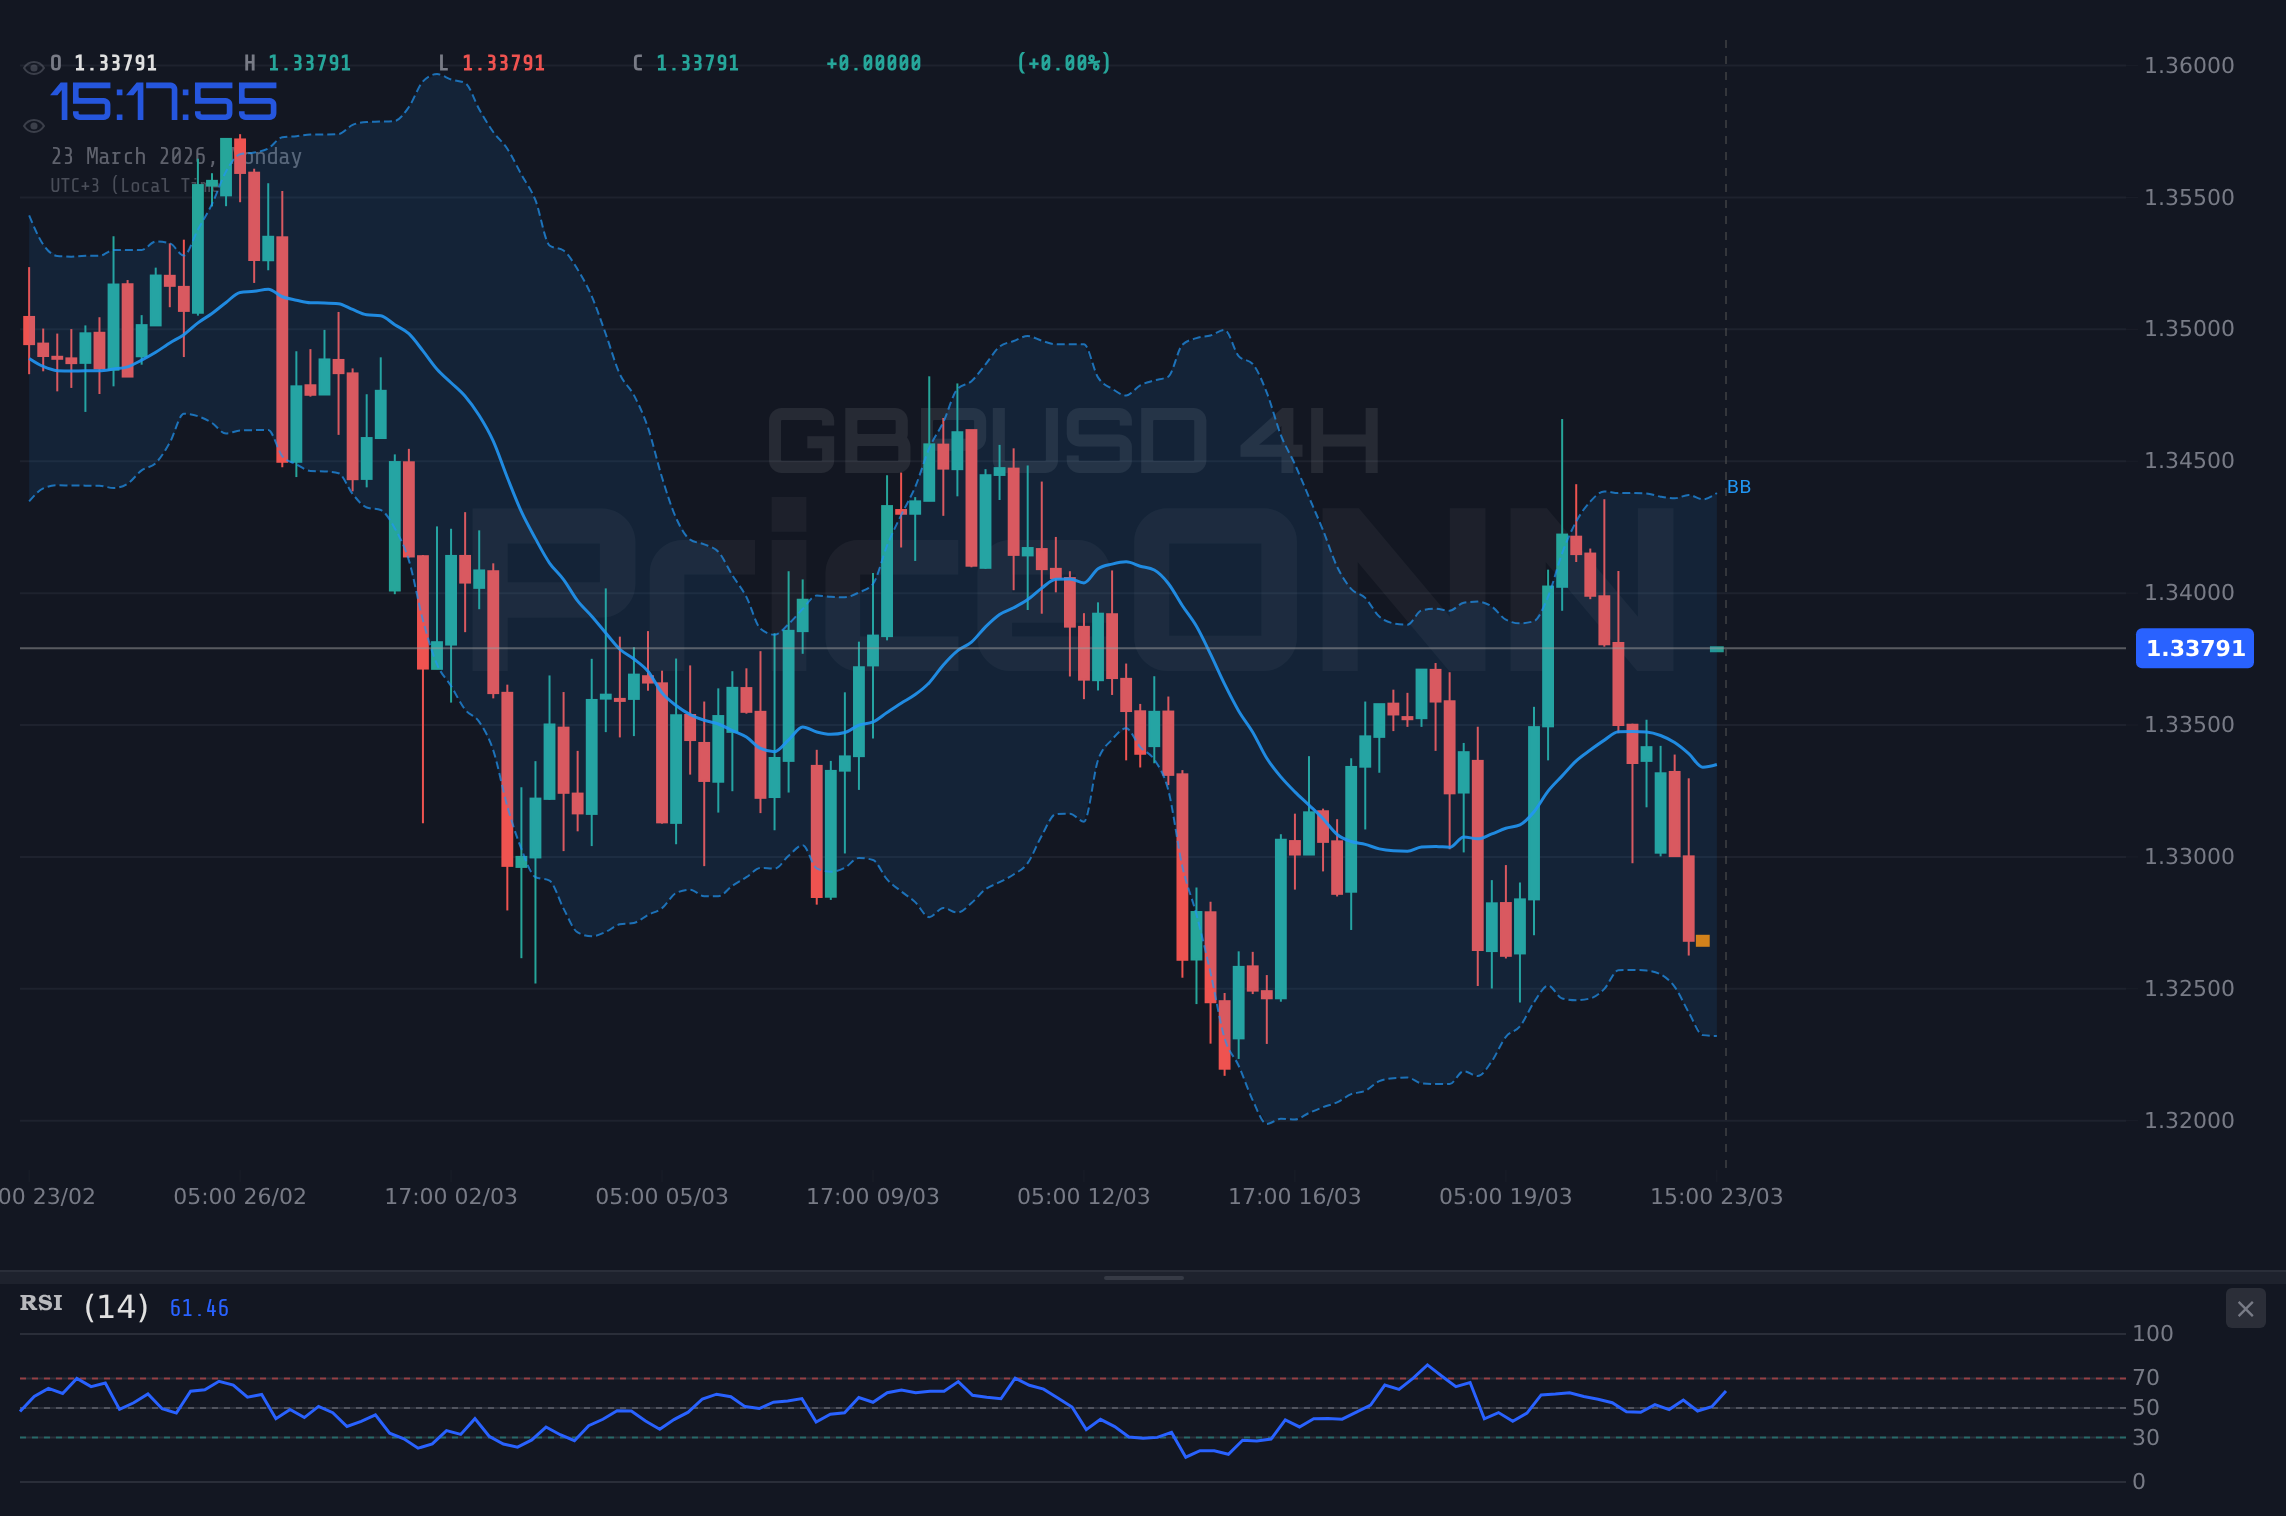
On the 1-Day chart, the ADX stands at a strong 29.09, confirming a robust downward trend. This is not a market where bulls are in control; rather, sellers have been steadily pressing their advantage. The RSI(14) is hovering at 44.13, a reading that suggests there's still considerable room to move lower before entering oversold territory. This indicates that the bearish momentum has not yet exhausted itself, and further downside is plausible. The MACD is also signaling negative momentum, with the MACD line below its signal line, reinforcing the bearish bias. This technical picture suggests that any rallies are likely to be met with selling pressure, making the current support levels critical watch zones.
The fundamental backdrop further supports this bearish thesis. Recent economic data from the UK has been mixed, at best, raising concerns about the Bank of England's (BoE) ability to manage inflation without stifling growth. Conversely, the US economy, while facing its own challenges, has shown more resilience in certain sectors, leading the Federal Reserve to maintain a hawkish stance. This policy divergence is a powerful driver in the forex market, often leading to a stronger USD against currencies like the GBP.
Navigating the Support Zone: What Lies Below $1.3280?
The immediate focus for traders is the support zone beginning around $1.3280. On the 1-Day chart, the first significant support level is identified at $1.3279. Should this level falter, the next technical floor appears at $1.32165, followed by a more substantial level at $1.31353. A decisive break below $1.3280 would signal a significant loss of control for the bulls and likely accelerate selling pressure. The Bollinger Bands on the 1-day chart are also showing the price trading below the middle band, indicating a bearish trend and potential for further downside movement towards the lower band.
The stochastic indicator on the 1-day chart (K=55.42, D=40.54) shows a bullish crossover, which might suggest a potential short-term bounce. However, this is occurring within a broader bearish context, and such signals can often be traps in a strong downtrend, leading to what traders call a 'bear trap'. The ADX at 29.09 confirms the trend's strength, suggesting that any counter-trend moves might be short-lived unless accompanied by a significant shift in fundamental drivers.
Traders will be closely watching the interplay between the DXY and GBPUSD. With the DXY at 99.36 and showing a bullish trend on the 4H timeframe (ADX 16.36), a stronger dollar environment persists. This correlation means that any further upside in the dollar index could translate to further downside for GBPUSD, especially if US yields continue to climb, making dollar-denominated assets more attractive.
The Role of Inflation and Central Bank Policy
The inflation outlook remains a critical determinant for both the Bank of England and the Federal Reserve, and consequently, for GBPUSD. Recent commodity price movements, particularly the tumble in gold to $4,460, suggest some easing of inflation fears, but elevated oil prices (Brent at $105.46, WTI at $92.63) continue to embed inflationary pressures globally. This creates a challenging environment for central bankers. If UK inflation proves more persistent than anticipated, the BoE might be forced to adopt a more hawkish stance than the market currently prices in. Conversely, any sign of cooling US inflation could temper the Fed's hawkishness, potentially offering some respite to GBPUSD.
The market's expectation regarding future interest rate hikes plays a crucial role. Traders are constantly assessing the probability of rate changes, and any data that shifts these expectations can cause significant price swings. For instance, a stronger-than-expected UK inflation report could lead to increased BoE rate hike expectations, potentially bolstering the Sterling. Conversely, a cooler US inflation reading could dampen Fed hike expectations, weakening the Dollar and offering a reprieve for GBPUSD. The current technical setup, however, suggests that the bears are in the driving seat, and a fundamental catalyst would be needed to reverse this trend decisively.
The Bullish Counter-Argument: Can Sterling Find Its Footing?
Despite the prevailing bearish sentiment, there are scenarios where GBPUSD could find support and even mount a recovery. The 1-Day chart shows a stochastic crossover (K=55.42, D=40.54), which, while occurring in a bearish trend, could signal a short-term reversal or a significant bounce. If GBPUSD manages to hold the $1.3280 support, bulls might step in, looking to push the price back towards the $1.33 handle and potentially higher.
A key trigger for a bullish reversal would be a significant shift in the fundamental narrative. For example, unexpectedly strong UK economic data, such as a robust GDP print or a sharp decline in inflation, could force a re-evaluation of BoE policy expectations. This might lead to increased demand for Sterling as markets price in a more hawkish BoE. Additionally, a weakening US Dollar, perhaps driven by signs of cooling US inflation or a dovish pivot from the Fed, would significantly ease the pressure on GBPUSD and could provide the impetus for a move higher.
Technically, a sustained break above the 1-hour resistance at $1.32979 would be the first sign of bulls regaining some control. A move above the 4-hour resistance at $1.33645 would be more significant, suggesting the immediate bearish pressure is abating. A decisive push above the daily resistance at $1.34227 would be required to signal a more substantial trend change, targeting higher levels such as $1.35039.
The Waiting Game: Consolidation Around the Current Levels
It's also plausible that GBPUSD could enter a period of consolidation, trading within a defined range, particularly if upcoming economic data proves inconclusive or contradictory. The 4-hour chart shows a neutral trend (Power: 50%) with ADX at a weak 16.85, indicating a lack of strong directional momentum in that timeframe. This could lead to a period where price oscillates between the established support and resistance levels. In such a scenario, scalpers and range traders might find opportunities, but the lack of a clear trend could frustrate swing traders.
A neutral scenario would likely unfold if key economic events provide mixed signals. For example, if UK inflation comes in slightly cooler than expected, but US inflation remains stubbornly high, the conflicting pressures could lead to a stalemate. Similarly, if the Fed signals a pause but the BoE remains cautious about inflation, the resulting uncertainty could keep GBPUSD range-bound. In this case, the pair might trade sideways, perhaps between $1.3200 and $1.3400, until a clearer fundamental driver emerges.
The 1-hour chart's general signal is 'BUY' (Al: 7, Sat: 1, Nötr: 0), while the 4-hour and 1-day charts lean towards 'SELL'. This divergence suggests that short-term sentiment might differ from the longer-term trend, a common characteristic of consolidation phases. Traders would need to exercise caution, perhaps waiting for a clearer signal from the higher timeframes or for price to break decisively out of the current range.
Bearish Scenario: The Descent Continues
65% ProbabilityNeutral Scenario: Range-Bound Stalemate
25% ProbabilityBullish Scenario: A Sterling Recovery
10% ProbabilityWhat's Next for GBPUSD: Key Triggers to Watch
Looking ahead, the coming week is packed with potentially market-moving events for GBPUSD. The primary focus will be on inflation data releases from both the UK and the US. For the UK, CPI figures will be crucial in shaping expectations for the Bank of England's next move. A higher-than-expected print could bolster Sterling, while a lower print might reinforce the bearish trend. On the US side, any indication that inflation is cooling could lead to a weaker dollar, offering GBPUSD a potential lifeline.
Furthermore, commentary from Federal Reserve officials will be closely scrutinized. Any hints about the timing or pace of potential interest rate cuts or hikes will significantly influence the DXY and, by extension, GBPUSD. Traders will also be monitoring geopolitical developments, particularly any escalation in the Middle East, which could drive safe-haven flows into the US Dollar, further pressuring GBPUSD. The current technical setup on the 1-day chart, with ADX at 29.09, suggests a strong trend is in play, making the direction of these fundamental catalysts even more critical.
The correlation with other markets also warrants attention. The DXY's current level at 99.36 and its upward trend on the 4H chart remain a significant factor. A sustained rise in DXY above 99.50 could trigger further selling in GBPUSD. Conversely, a break below 99.10 might offer some relief. The strength of US equity markets, represented by the SP500 at 6597.55 and Nasdaq at 24206.99, also plays a role in risk appetite, though the current focus seems to be more on interest rate differentials.
Frequently Asked Questions: GBPUSD Analysis
What happens if GBPUSD breaks below the $1.3279 support level?
A break below $1.3279 on the 1D chart, confirmed by strong volume, would likely invalidate the current consolidation pattern and accelerate the bearish trend. This could target the next support at $1.32165, with potential for a move towards $1.31353 if the selling pressure intensures.
Should I consider buying GBPUSD at current levels near $1.34 given the stochastic crossover?
While the stochastic crossover on the 1D chart (K=55.42, D=40.54) suggests a potential short-term bounce, the overall bearish trend (ADX 29.09) and the DXY's strength make this a high-risk entry. Confirmation above $1.33645 resistance is advised before considering any long positions, with a clear invalidation below $1.3279.
Is the RSI at 44.13 a sell signal for GBPUSD right now?
An RSI of 44.13 is not inherently a sell signal; it indicates room for further downside before reaching oversold territory. It confirms that the current bearish momentum has not yet exhausted, aligning with the overall bearish outlook and the ADX reading of 29.09.
How will upcoming UK inflation data impact GBPUSD this week?
Higher-than-expected UK inflation could strengthen GBPUSD by increasing BoE rate hike expectations, potentially pushing the pair towards resistance levels like $1.34227. Conversely, cooler inflation might reinforce the bearish trend, targeting support near $1.3279.
Technical Outlook Summary
| Indicator | Value | Signal | Interpretation |
|---|---|---|---|
| RSI (14) | 44.13 | Neutral | Room for downside before oversold. |
| MACD Histogram | -0.001 | Bearish | Negative momentum confirmed. |
| Stochastic | K:55.42, D:40.54 | Bullish Crossover | Potential short-term bounce signal. |
| ADX | 29.09 | Strong Trend | Confirms a robust downward trend. |
| Bollinger Bands | Middle Band | Below | Indicates bearish trend. |
Track markets in real-time
AI-powered analysis, technical indicators and real-time price data.
Join Our Telegram Channel
Breaking market news, AI analysis and trading signals instantly.
Join Channel