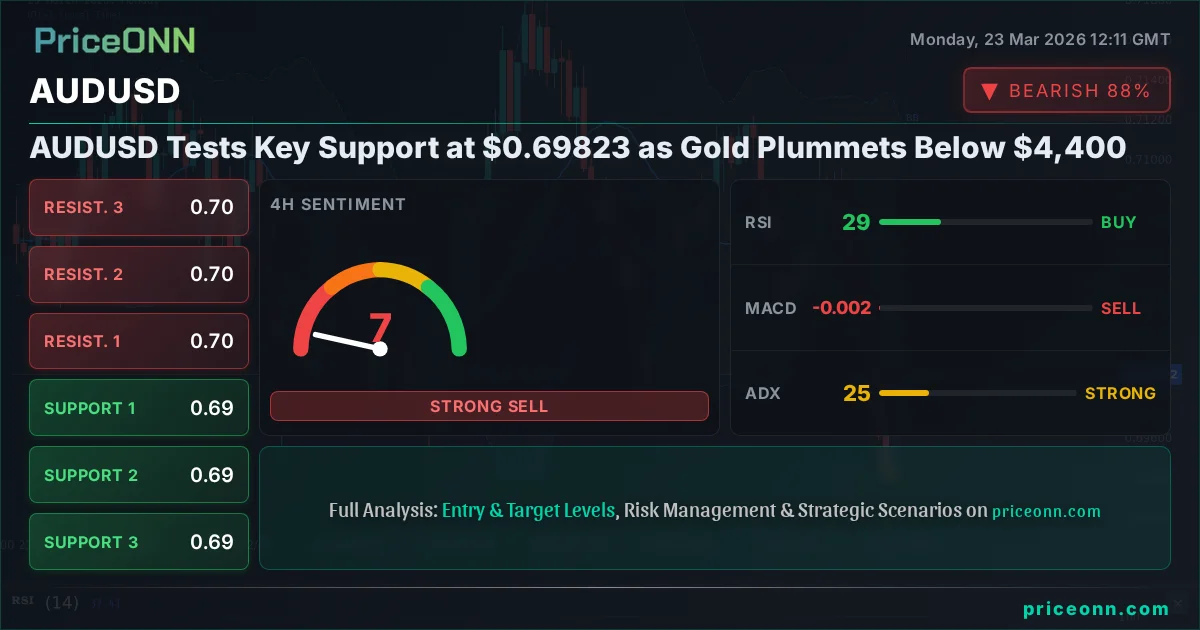
AUDUSD Tests Key Support at $0.69823 as Gold Plummets Below $4,400
AUDUSD is probing critical support near $0.69823 following a sharp decline, while gold prices tumble below $4,400 amid rising rate hike fears.
The global financial landscape is currently a tightrope walk between persistent inflation fears and the looming specter of aggressive central bank tightening. This delicate balance is sending shockwaves across markets, and the Australian Dollar versus the US Dollar (AUDUSD) is no exception. Currently trading at $0.69890, AUDUSD is teetering on the edge of a significant support level, a move heavily influenced by the dramatic sell-off in gold prices and the strengthening US Dollar Index (DXY). As traders grapple with these competing forces, understanding the fundamental drivers and technical implications is paramount for navigating the choppy waters ahead.
- AUDUSD is testing critical support around $0.69823, with the immediate downside pressure intensifying.
- Gold prices have plunged to $4,363.99, signaling a potential shift in inflation expectations or risk sentiment.
- The US Dollar Index (DXY) is showing strength, currently trading at 99.33, which typically weighs on AUDUSD.
- Technical indicators on AUDUSD present a mixed picture across timeframes, highlighting the current indecision and risk of a breakdown below key support.
The Unravelling of Gold: A Warning Signal for AUDUSD?
The most striking development in the commodity space over the last 24 hours has been the sharp decline in gold prices. Trading at $4,363.99, gold has shed a significant 2.97% ($133.4) in a single day. This dramatic move, occurring despite ongoing geopolitical tensions that typically bolster safe-haven assets, suggests a powerful narrative is at play: rising inflation fears are directly translating into expectations of more aggressive interest rate hikes by major central banks, particularly the US Federal Reserve. The fact that gold, a traditional inflation hedge, is falling so sharply indicates that market participants are pricing in a scenario where central banks prioritize taming inflation, even at the cost of economic growth. This narrative has a direct and often inverse correlation with riskier assets and currencies like the AUDUSD. As investors anticipate higher borrowing costs and a potential slowdown, demand for higher-yielding, but riskier, currencies tends to wane, while demand for the safe-haven US Dollar strengthens.
The correlation between gold and AUDUSD is not always direct, but when gold experiences such a sharp, sentiment-driven decline, it often signals broader shifts in risk appetite and macro expectations. The news that gold prices have fallen to approximately $4,460 amid a stronger US Dollar and rising bond yields reinforces this view. While the provided data shows gold at $4,363.99, the sentiment remains the same: gold's weakness is a bearish signal for risk-sensitive assets. The International Energy Agency's (IEA) discussions about releasing more oil from strategic reserves, as mentioned in recent news, also points to concerns about energy prices and their inflationary impact, further complicating the picture. This complex interplay of factors is creating a challenging environment for currencies like the AUDUSD, which are sensitive to global economic health and commodity prices.
US Dollar Strength and the AUDUSD Squeeze
The strengthening US Dollar Index (DXY), currently at 99.33, is a critical component in the AUDUSD equation. Historically, a rising DXY puts downward pressure on currency pairs priced against it, such as AUDUSD. The data shows the DXY is exhibiting a mixed trend across different timeframes, but the daily chart indicates a bullish trend with strong conviction (92% power). This suggests underlying strength in the dollar, driven by the prospect of higher US interest rates compared to other major economies. The market is increasingly pricing in the Fed's commitment to combating inflation, even if it means a more aggressive path of rate hikes. This outlook makes the US Dollar a more attractive proposition for global investors seeking yield and stability. Consequently, the AUDUSD pair, which represents the Australian Dollar against the US Dollar, finds itself caught in this crossfire. The current price action on AUDUSD, with its 1H and 4H charts showing a bearish trend, reflects this dollar strength. The fact that the 1D chart also leans towards a bearish trend (94% power) reinforces the idea that the path of least resistance for AUDUSD may be lower, at least in the short to medium term, as long as the DXY remains firm.
The immediate price action on the 1-hour chart for AUDUSD shows a neutral trend with 50% power, but the overall signal leans towards selling (Al: 3, Sat: 5). This indecision at the hourly level often precedes a more significant move. The RSI(14) at 46.4 on the 1H chart indicates a slight bearish leaning, while the MACD shows negative momentum. However, the Stochastic oscillator is giving a conflicting bullish signal (%K > %D), suggesting some buyers might be stepping in at these lower levels. This divergence highlights the intraday chop and the difficulty in establishing a clear direction without further catalysts. The ADX at 41.29 on the 1H indicates a strong trend, but the overall signal mix across oscillators suggests this trend is facing headwinds. This is precisely where traders need to pay close attention to the confluence of factors, as a breakdown below critical support could accelerate.
Technical Breakdown: AUDUSD at the Precipice
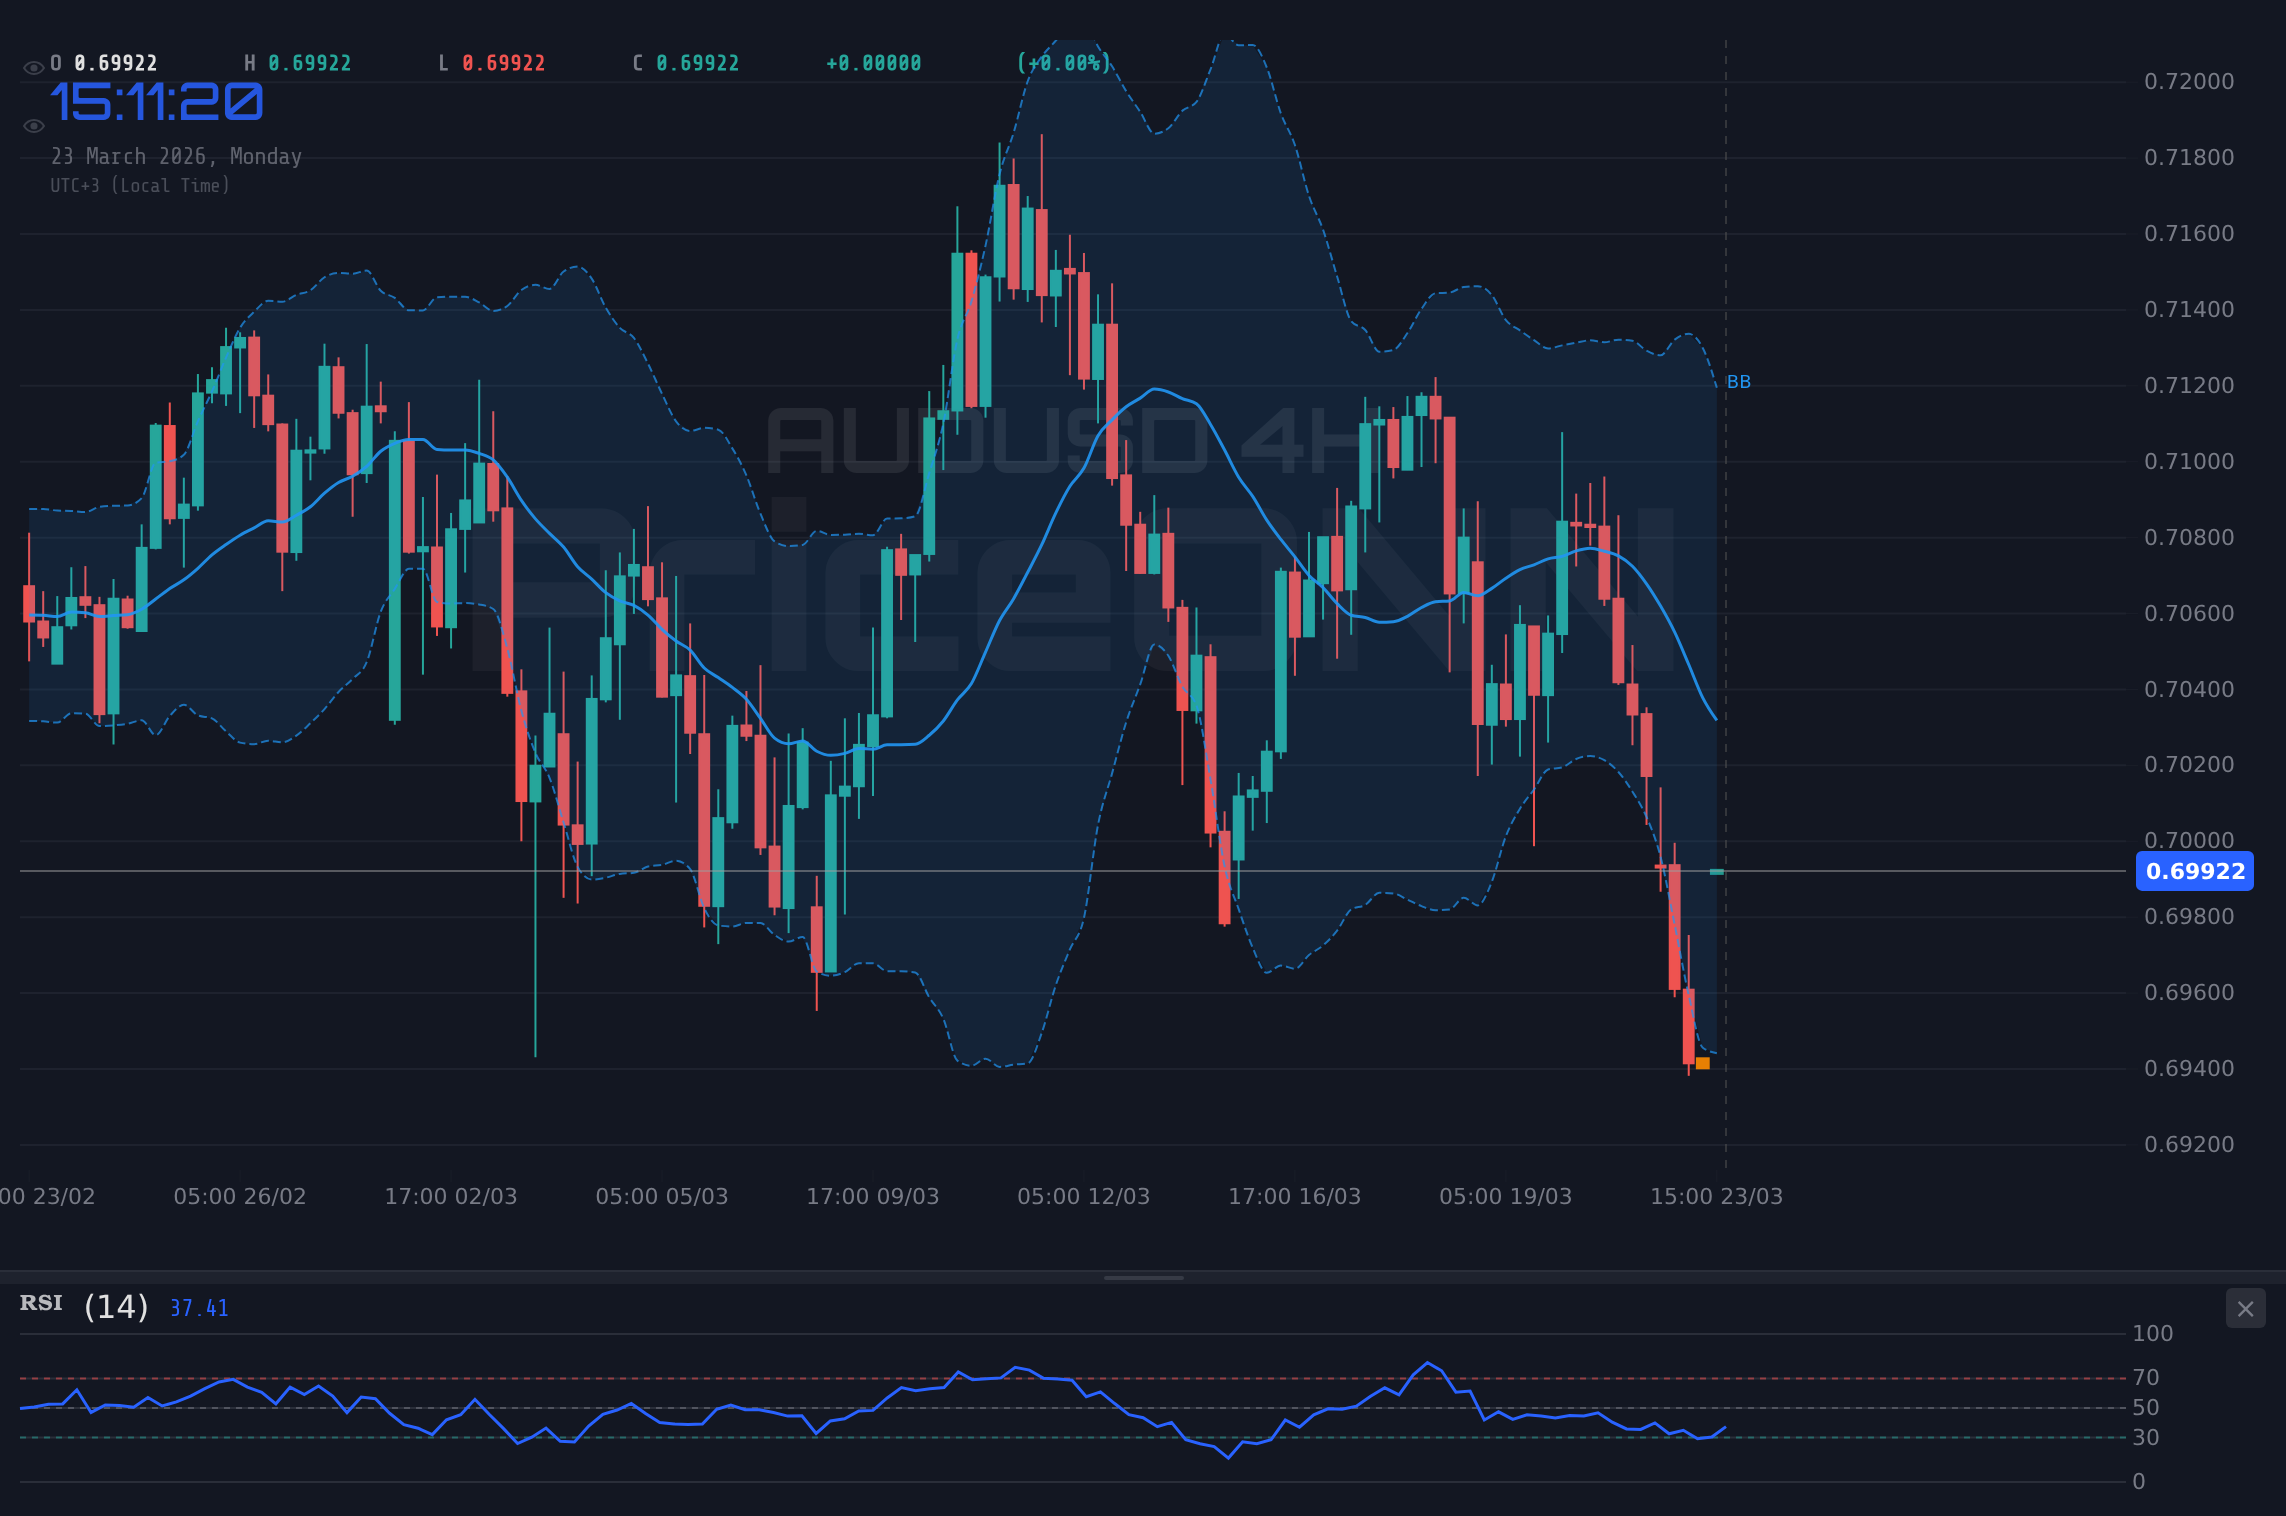
Delving deeper into the technicals, AUDUSD presents a compelling, albeit risky, picture. On the 4-hour timeframe, the trend is decidedly bearish with 100% power. The RSI(14) at 29.13 is deep in oversold territory, suggesting that the current downward momentum might be exhausting itself, potentially offering a short-term buying opportunity. However, the MACD is firmly in negative territory, and the Stochastic oscillator (%K < %D) also signals further downside potential, albeit with K line at 3.06 and D line at 26.87, indicating extreme oversold conditions. The ADX at 25.48 confirms a strong trend, but the overall signal from the oscillators is mixed, with a strong leaning towards selling (Al: 1, Sat: 7). The proximity of the current price to the 4-hour support level of $0.69468 is crucial. A break below this level could trigger a cascade of selling as stop-loss orders are likely to be triggered, accelerating the move towards the next significant support at $0.69325.
The daily chart analysis for AUDUSD paints a similar picture of bearish pressure, though the trend strength is slightly reduced to 50% power, indicating a neutral stance on the longer timeframe. The RSI(14) at 45.61 is hovering in the neutral zone, suggesting neither extreme overbought nor oversold conditions, but with a slight downward bias. The MACD remains negative, reinforcing the bearish sentiment. The Stochastic oscillator (%K: 26.44, %D: 40.17) also points downwards, indicating further potential for decline. The ADX at 20.28 suggests a moderate trend, not yet overwhelmingly strong, which could mean that the current price action is more of a consolidation within a larger trend rather than a definitive reversal. The key support levels on the daily chart are $0.69823, $0.69474, and $0.68905. The current price of $0.69890 is hovering just above the first daily support, making it an absolutely critical juncture. A sustained break below $0.69823 would be a significant bearish signal, potentially opening the door for a rapid decline towards $0.69474 and even lower.
Economic Calendar and Geopolitical Crosscurrents
Looking ahead, the economic calendar is packed with events that could significantly influence AUDUSD. Upcoming data releases for both Australia and the United States will be closely watched. For Australia, key figures such as inflation data (CPI) and employment reports will provide crucial insights into the Reserve Bank of Australia's (RBA) monetary policy stance. If inflation proves to be stickier than expected or employment remains robust, it could lead to further RBA rate hike expectations, bolstering the Australian Dollar. Conversely, any signs of economic slowdown or cooling inflation could prompt the RBA to adopt a more dovish tone, putting pressure on AUDUSD.
On the US side, the focus remains squarely on the Federal Reserve's next moves. Upcoming inflation figures (CPI, PCE) and employment data (NFP) will be critical in shaping market expectations for future interest rate decisions. If US inflation remains stubbornly high or the labor market continues to show resilience, the Fed is likely to maintain its hawkish stance, supporting the US Dollar and potentially pushing AUDUSD lower. The ongoing geopolitical tensions in the Middle East, as highlighted by news regarding potential oil stockpile releases and escalating regional instability, add another layer of complexity. While these tensions often support safe-haven assets, the current market narrative seems to be dominated by inflation and interest rate expectations. This means that even if geopolitical risks escalate, their impact on AUDUSD might be secondary to the overriding influence of Fed policy expectations and the resulting dollar strength.
The recent news regarding the IEA's readiness to release more oil, coupled with discussions about navigating the energy transition amidst Middle East tensions, underscores the persistent inflationary pressures stemming from the energy sector. This directly impacts the global economic outlook and reinforces the likelihood of continued hawkish monetary policy from major central banks. For AUDUSD, this means that the fundamental backdrop remains challenging. The pair is caught between the RBA's potential policy path and the Fed's more aggressive stance, all while global risk sentiment is being dictated by inflation and geopolitical concerns. The fact that silver prices are also testing critical support zones around $60, as reported, further emphasizes the broad-based weakness in commodities, which typically acts as a headwind for commodity-linked currencies like the Australian Dollar.
Navigating the Scenarios: What Lies Ahead for AUDUSD?
Given the current confluence of bearish technical signals and a challenging fundamental backdrop, several scenarios can be envisioned for AUDUSD. The immediate focus remains on the critical support level around $0.69823. A decisive break below this level, supported by strong volume and a continuation of dollar strength, would likely trigger the bearish scenario.
Bearish Scenario: Breakdown Below Key Support
65% ProbabilityConversely, if AUDUSD manages to hold the $0.69823 support level and shows signs of stabilization, a short-term bullish reversal could be on the cards. This would likely require a softening in the US Dollar's stance, perhaps driven by a less hawkish-than-expected inflation report or a shift in Fed sentiment. However, given the current strong bearish momentum and the prevailing macro narrative, this scenario appears less probable in the immediate term.
Bullish Scenario: Support Holds, Dollar Weakens
15% ProbabilityA neutral or consolidation scenario is also possible, especially if upcoming economic data offers mixed signals, leading to indecision in the market. In this case, AUDUSD might trade within a defined range, testing the boundaries of support and resistance without a clear commitment to a direction. This is particularly plausible if the 1-hour and 4-hour charts show conflicting signals, as is the case currently, suggesting a period of consolidation before the next major move.
Neutral Scenario: Range-Bound Consolidation
20% ProbabilityThe current technical indicators on AUDUSD present a mixed bag across different timeframes. On the 1-hour chart, the RSI is at 46.4, MACD shows negative momentum, and Stochastic hints at a potential rise, but the ADX at 41.29 indicates a strong trend. The 4-hour chart shows oversold conditions with RSI at 29.13, but MACD and Stochastic lean bearish, and ADX is high at 25.48. The daily view provides a more neutral outlook with RSI at 45.61, negative MACD, and a moderate ADX of 20.28. This divergence suggests that while the immediate pressure is downwards, the market is waiting for a clearer signal from upcoming economic data or a shift in the broader macro narrative.
The Path Forward: Risk Management is Key
The AUDUSD pair is at a critical juncture. The prevailing bearish sentiment, fueled by dollar strength and the potential for continued aggressive monetary tightening by the Fed, suggests that further downside is possible. The dramatic fall in gold prices serves as a stark reminder of how quickly market narratives can shift and how sensitive assets are to inflation and interest rate expectations. Traders must remain vigilant and prioritize risk management above all else. A close below the $0.69823 support level on the 4-hour chart could signal the start of a more significant downtrend, targeting levels around $0.69474 and $0.69325. Conversely, a failure to break this support and a subsequent bounce, especially if accompanied by a weakening DXY or unexpected positive news for the Australian economy, could lead to a short-term correction towards resistance levels near $0.70741.
The current market sentiment, as reflected by the sharp moves in gold and the DXY, points towards a risk-averse environment where higher interest rates are prioritized over immediate growth concerns. This environment is generally unfavorable for risk-sensitive currencies like the AUD. The technical picture, while showing oversold conditions on some timeframes, is still dominated by bearish momentum, especially on the 4-hour and daily charts. Therefore, the most probable scenario involves a continued test of support, with a breakdown being the higher probability outcome unless compelling counter-signals emerge from upcoming economic data releases or a significant shift in central bank rhetoric. Patience and disciplined execution will be key for traders looking to capitalize on the opportunities that will undoubtedly arise from this volatility.
Frequently Asked Questions: AUDUSD Analysis
What happens if AUDUSD breaks below the $0.69823 support level?
A break below $0.69823, especially with conviction on the 4-hour chart, would likely trigger a bearish scenario with targets at $0.69474 and $0.69325. This would indicate that dollar strength and global risk aversion are overriding any potential support for the Australian Dollar.
Should I consider buying AUDUSD at current levels near $0.69890 given the oversold RSI on the 4H chart?
While the 4-hour RSI at 29.13 suggests oversold conditions, the overall bearish trend and negative MACD signal caution. A short-term bounce is possible, but a sustained move higher would require invalidation of the bearish trend and a break above resistance levels, making it a higher-risk trade with the current setup.
Is the RSI at 45.61 on the daily chart a bearish signal for AUDUSD?
An RSI of 45.61 on the daily chart indicates a neutral-to-bearish bias, suggesting that while not yet oversold, the momentum is leaning towards the downside. This reading aligns with the broader bearish trend observed on the daily timeframe, reinforcing the pressure on AUDUSD.
How will upcoming US inflation data affect AUDUSD this week?
Higher-than-expected US inflation data would likely reinforce expectations of aggressive Fed rate hikes, strengthening the USD and putting further downward pressure on AUDUSD. Conversely, cooler inflation could lead to a USD pullback, offering potential relief for AUDUSD.
Track markets in real-time
AI-powered analysis, technical indicators and real-time price data.
Join Our Telegram Channel
Breaking market news, AI analysis and trading signals instantly.
Join Channel