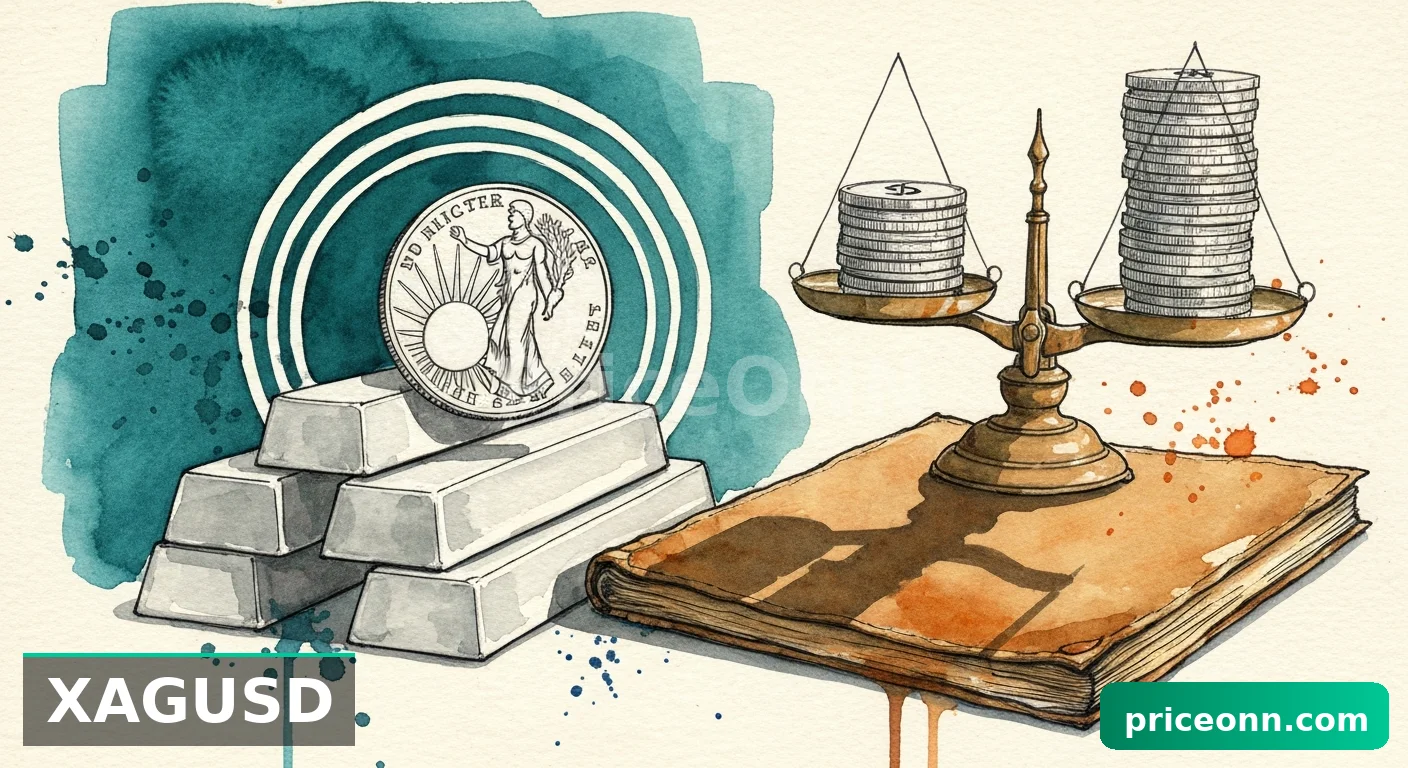
XAUUSD Tests $4,360.44: Bull vs. Bear Showdown Amidst Shifting Macro Winds
Gold prices hover around $4,360.44 as a tug-of-war intensifies between bullish safe-haven demand and bearish rate hike speculation. Technicals show mixed signals.
The battleground for gold is firmly set at the $4,360.44 mark. As the dust settles from a significant price drop, a critical juncture has been reached for XAUUSD, where bulls and bears are locked in a fierce debate. This isn't just a technical stalemate; it's a reflection of broader macroeconomic crosscurrents, from shifting central bank expectations to evolving geopolitical tensions. Understanding the forces at play is paramount for any trader looking to navigate this volatile landscape. The current price action, coupled with a sharp RSI dip and mixed signals across timeframes, presents a complex puzzle for market participants.
The market is currently grappling with a narrative split. On one side, the persistent geopolitical risks and the underlying demand for safe-haven assets provide a bedrock of support for gold. On the other, the specter of sticky inflation and the potential for hawkish central bank rhetoric loom large, threatening to cap any upward momentum. This dynamic tension is precisely why the $4,360.44 level is so pivotal. A failure to hold here could signal a deeper correction, while a decisive break above could reignite bullish sentiment. We need to dissect the evidence, from the granular hourly charts to the overarching daily trends, to understand which side is gaining the upper hand.
- RSI at 26.48 signals significant oversold pressure on the daily chart, hinting at potential buying opportunities.
- Critical support sits at $4,311.93 on the 1-hour chart, tested multiple times, while resistance looms at $4,403.26.
- The ADX at 42.57 on the 1-hour chart indicates a strong downtrend is in play, suggesting caution for long positions.
- Fed rate expectations, driven by inflation data, are a key driver influencing the XAUUSD-DXY correlation, currently showing pressure on gold.
The Bull Case: Searching for Value in the Downturn
The Safe-Haven Appeal in Turbulent Times
Even as gold prices have retreated, the fundamental backdrop remains supportive of safe-haven demand. Escalating geopolitical tensions, particularly in the Middle East, continue to inject an element of uncertainty into global markets. While the specific news flow on solar energy or quantum batteries might seem distant, the underlying theme of global instability is a constant. Reuters reported on March 23rd that gold prices have fallen to near $4,460 per ounce amid a strengthening US Dollar, rising bond yields, and persistent inflation fears. This price point, while lower than recent highs, still reflects underlying demand. The narrative of central banks continuing to accumulate gold, a trend observed over recent years, provides a structural floor. Russia and China, among others, have been consistent buyers, diversifying their reserves away from traditional fiat currencies. This strategic accumulation by major economies is not a short-term trading signal but a long-term policy. Even a temporary price dip doesn't negate this fundamental shift in reserve management, which historically underpins gold's value.
Interest Rates and Inflation: A Double-Edged Sword
The debate around interest rates is central to gold's current predicament. While higher rates generally increase the opportunity cost of holding non-yielding assets like gold, the context of inflation is crucial. If inflation remains stubbornly high, as suggested by recent data points, central banks might be forced to maintain a hawkish stance or even hike rates further. This is where the correlation with the Dollar Index (DXY) becomes critical. The DXY is currently trading around 99.45, showing an upward bias. A stronger dollar typically exerts downward pressure on gold, making it more expensive for holders of other currencies. However, if inflation continues to outpace nominal yields, real interest rates (nominal rates minus inflation) can remain negative or low, which is historically supportive for gold. The market is trying to price in the Fed's next move, and any data suggesting inflation is cooling could be a significant tailwind for gold, even if rates remain elevated in nominal terms. The current RSI reading of 26.48 on the daily chart certainly suggests that the market may have overreacted to the rate hike narrative, pushing gold into oversold territory.
Technical Confluence: A Potential Buying Zone?
Looking at the technical indicators, the 1-hour chart presents an interesting picture for the bulls. The RSI(14) stands at 23.88, deeply entrenched in oversold territory. This suggests that the recent selling pressure may have been overdone, and a short-term bounce is plausible. Similarly, the Stochastic Oscillator is also deep in oversold territory, with the %K line at 17.73 and %D at 14.82. These readings often precede a reversal, especially if accompanied by signs of waning selling momentum on lower timeframes. The support level at $4,336.19 is a key area to watch. A hold here, followed by a move back above the $4,403.26 resistance, could signal the start of a recovery. Furthermore, the general signal across multiple timeframes, while predominantly 'SELL', shows a significant number of 'BUY' signals on the daily (3 Al, 5 Sat, 0 Nötr), suggesting a potential divergence or a shift in sentiment as traders look for value. The fact that the ADX on the 1-hour chart is 42.57 indicates a strong trend, but the oversold RSI and Stochastic could signal a potential short-term exhaustion of this trend. The 4-hour chart, with an RSI of 14.75, reinforces the oversold condition, suggesting that the current price levels might be attractive for bargain hunters.
The Bear Case: Headwinds Mount for the Precious Metal
The Dominance of the Dollar and Rising Yields
The primary headwind for gold at present is the resurgence of the US Dollar and the upward pressure on Treasury yields. The DXY is showing strength, trading around 99.45 and trending higher on the 4-hour and daily charts. This strength is often fueled by expectations of higher interest rates in the US, which makes dollar-denominated assets more attractive to global investors. When the dollar strengthens, gold, which is priced in dollars, becomes more expensive for buyers using other currencies, thus dampening demand. Concurrently, rising bond yields increase the opportunity cost of holding gold. Investors can earn a significant return on government bonds, which are generally considered safer than gold in the short term. This shift in relative attractiveness can lead to outflows from gold ETFs and a reduction in speculative long positions. The narrative emerging from the bond market, suggesting inflation might be more persistent than initially thought, is a direct threat to gold's safe-haven status if it translates into prolonged higher rates. The market is pricing in potential Fed actions, and this anticipation alone can be enough to suppress gold prices.
Technical Breakdown: A Strong Downtrend Persists
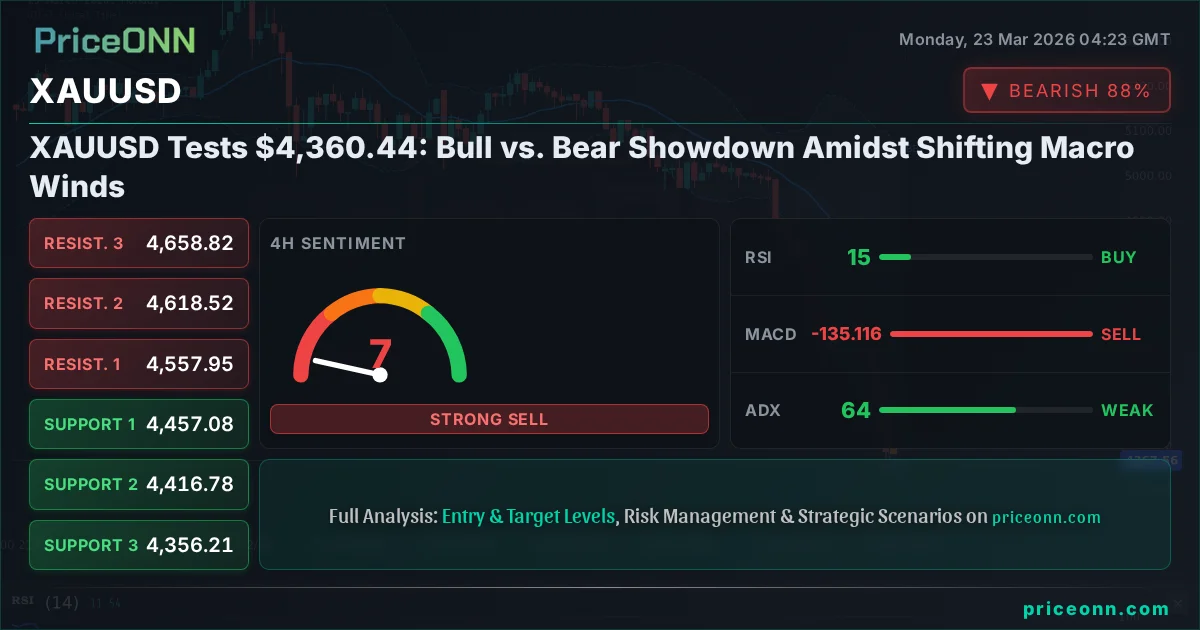
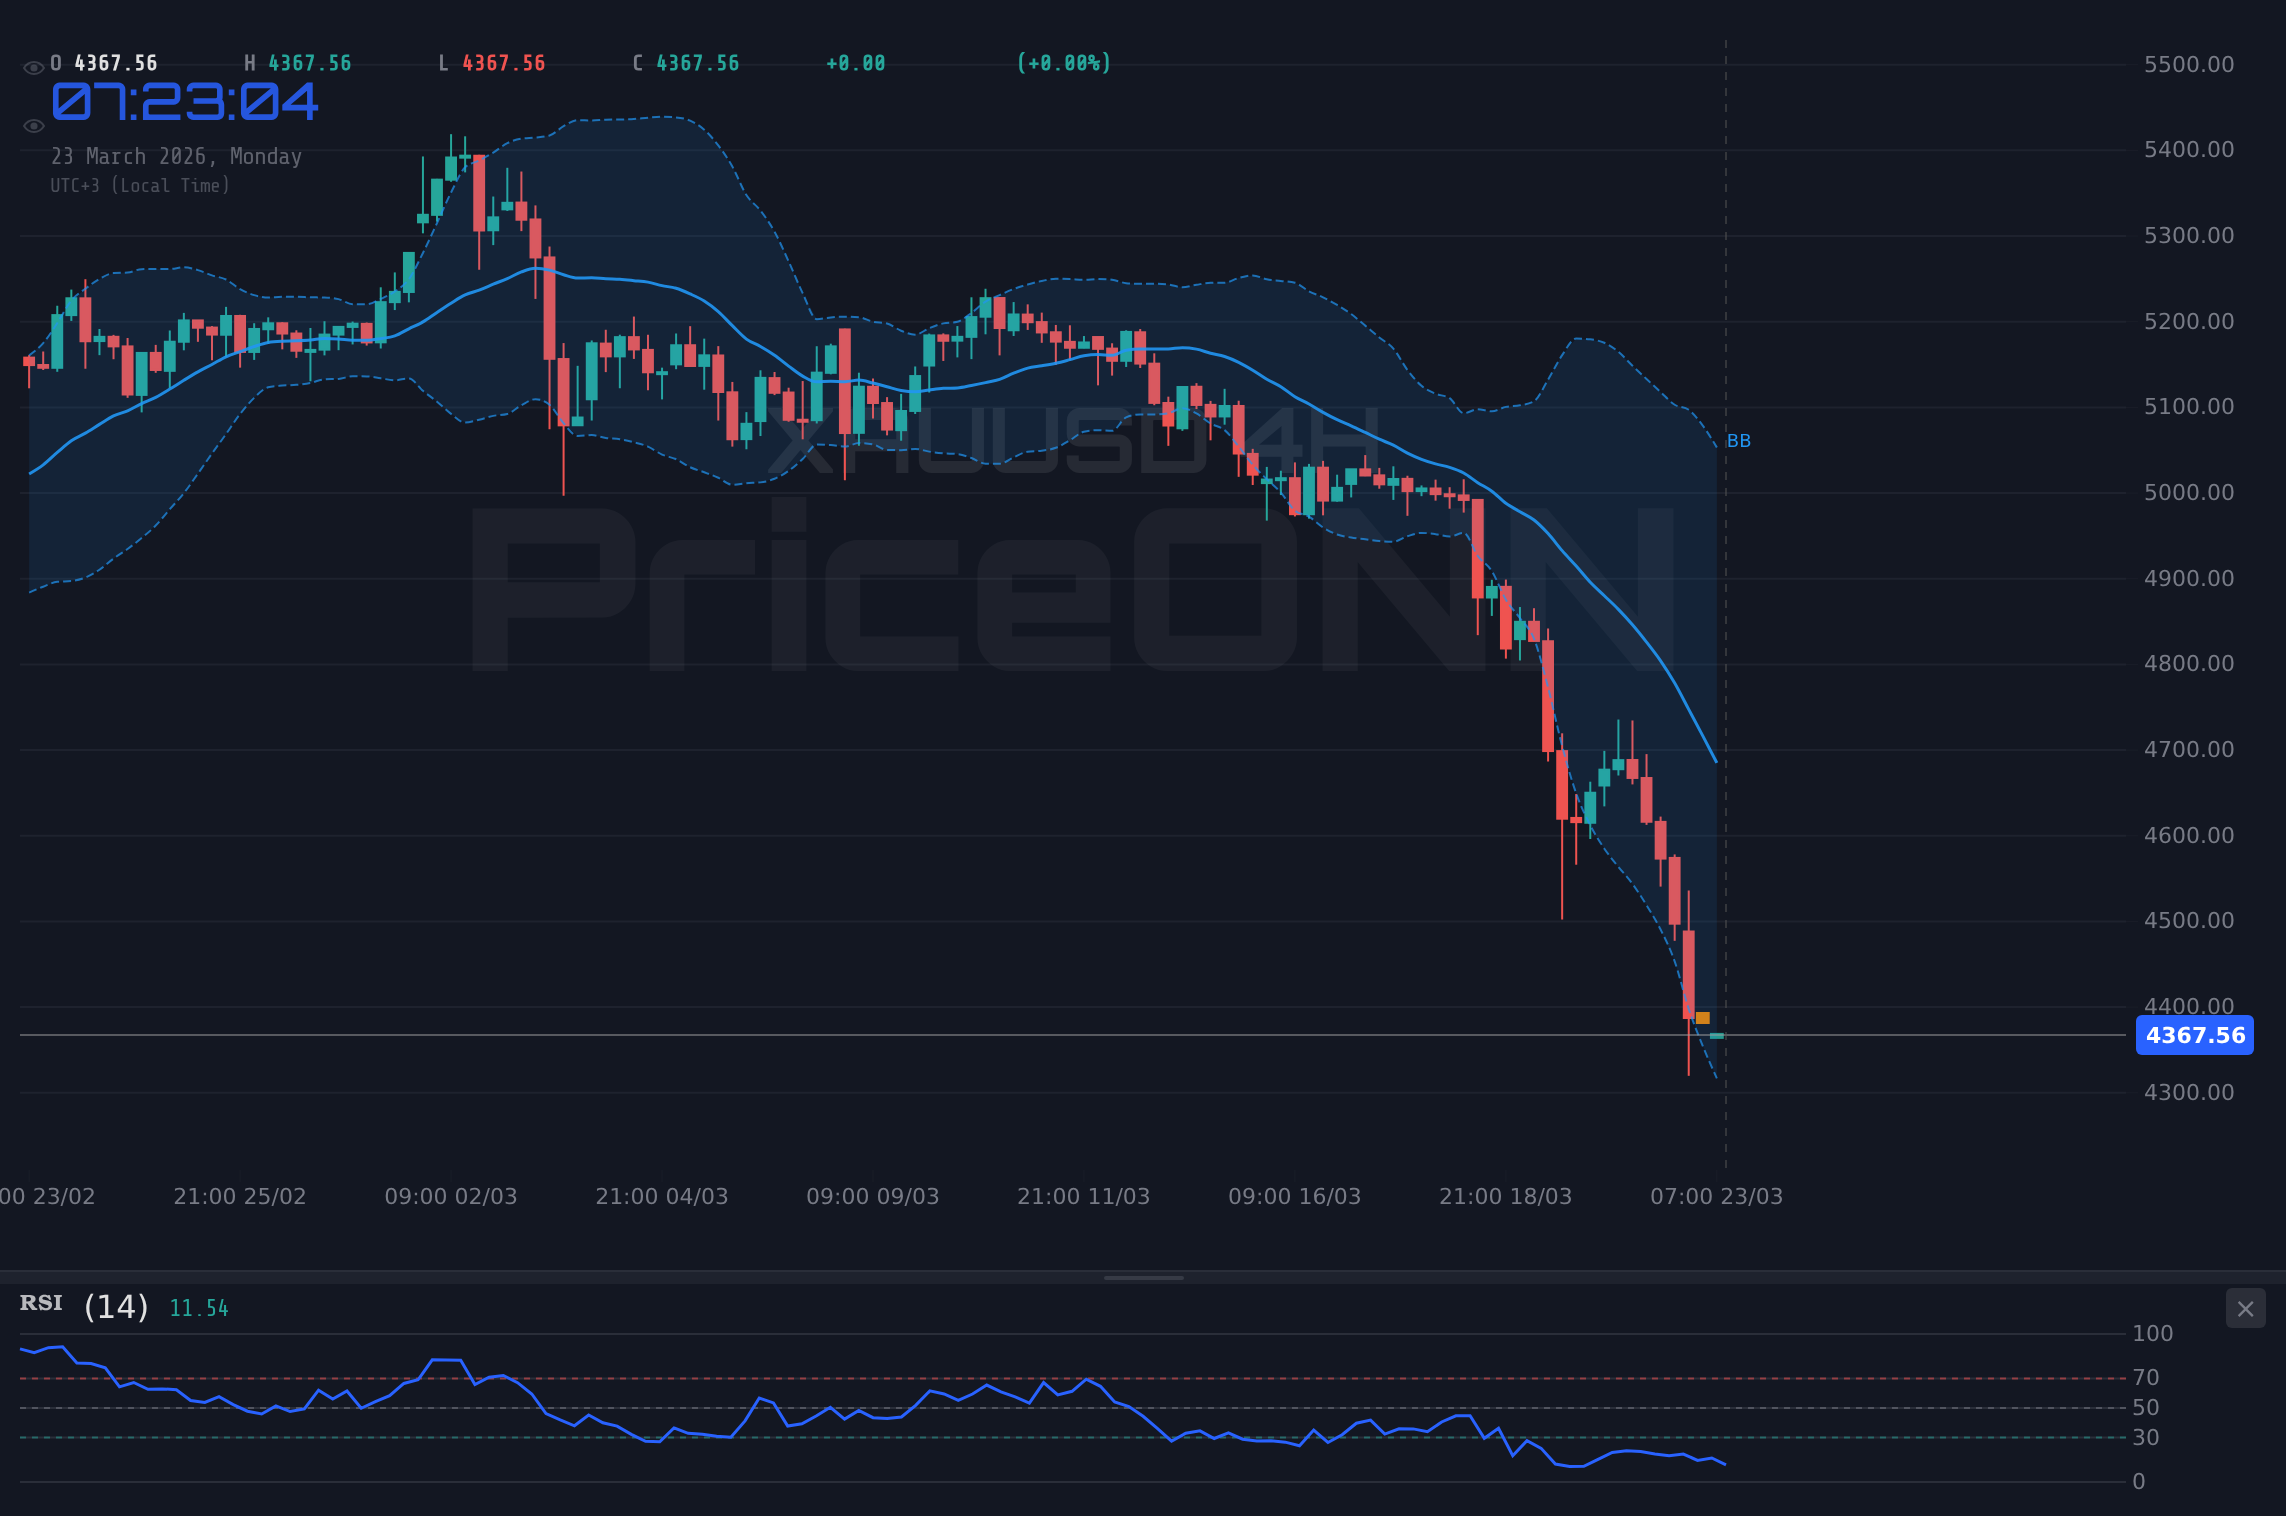
While the oversold indicators on shorter timeframes might suggest a bounce, the longer-term technical picture paints a more bearish outlook. The 4-hour and daily charts both show strong downtrend signals. The ADX on the 4-hour chart is a staggering 64.39, indicating a very strong downtrend is in force. This suggests that any short-term rallies are likely to be met with renewed selling pressure. The MACD indicator is consistently below its signal line across all timeframes, confirming negative momentum. Bollinger Bands on the 4-hour and daily charts are trading below the lower band, a sign of extreme bearish pressure that can sometimes precede further declines rather than immediate reversals. The support levels on the 4-hour chart are at $4,457.08, $4,416.78, and $4,356.21. A break below $4,356.21 would confirm the continuation of the downtrend and could open the door to much lower prices. The general signal across timeframes, with a strong consensus of 'SELL' on the 1-hour and 4-hour charts (6 Sat, 7 Sat respectively), emphasizes the prevailing bearish sentiment. The daily chart's ADX of 22.26, while lower, still points to a trend that has some legs left. The fact that price is trading below the middle Bollinger Band on the daily chart also reinforces the bearish outlook.
The Inflation Conundrum and Central Bank Policy
The core dilemma for gold lies in the inflation data. If inflation proves to be more persistent than anticipated, central banks, led by the Federal Reserve, may be compelled to maintain a tighter monetary policy for longer than the market currently expects. This is a significant risk for gold. The market's interpretation of economic data, such as upcoming employment or inflation reports, will be crucial. For instance, a strong Non-Farm Payrolls (NFP) report, if it indicates robust wage growth and persistent inflation, could strengthen the case for higher-for-longer interest rates, putting further pressure on gold. Conversely, any signs of economic cooling or a significant drop in inflation could lead to a reassessment of Fed policy, potentially weakening the dollar and boosting gold. The current market sentiment appears to be leaning towards the former, with the DXY's strength and rising yields acting as a drag. The analysis of Fed Fund Futures and OIS pricing will be key to gauging market expectations. If these futures begin to price in fewer rate cuts than previously anticipated, gold could face further headwinds. The price action below $4,403.26 resistance on the 1-hour chart suggests that the immediate upside is capped.
The Crossroads: What the Indicators Are Saying
A Tale of Two Timeframes
The divergence in signals between the shorter and longer timeframes is the most compelling aspect of the current XAUUSD chart. On the 1-hour and 4-hour charts, indicators like RSI and Stochastic are flashing extreme oversold conditions. This suggests that the recent sell-off might be overextended in the short term, and a technical bounce is possible. The 1-hour RSI at 23.88 and the 4-hour RSI at 14.75 are textbook examples of oversold readings. However, the ADX on both these timeframes (42.57 and 64.39 respectively) screams 'strong trend,' indicating that these oversold conditions could persist or even deepen before any significant reversal occurs. This is a classic scenario where short-term traders might look for a quick rebound, while longer-term investors are wary of catching a falling knife. The MACD's consistent position below the signal line across all timeframes reinforces the bearish momentum, suggesting that even if a bounce occurs, it might be short-lived without a fundamental shift or a confirmed break of key resistance levels.
The Daily Chart Perspective: Lingering Bearishness
The daily chart offers a slightly different, yet still cautious, perspective. The RSI at 26.48 remains deeply oversold, which is a stronger signal for potential price stabilization or reversal than the shorter timeframes. The Stochastic Oscillator, with K=9.08 and D=10.81, is also in extreme oversold territory. However, the ADX at 22.26 indicates a moderate trend strength, not the overwhelming force seen on the hourly charts. This suggests that while a downtrend is present, it might be losing some of its conviction. The MACD on the daily chart is also negative, but the distance from the signal line might be narrowing, hinting at a potential slowdown in bearish momentum. The Bollinger Bands are below the lower band, which, as mentioned, can indicate oversold conditions but also potential for further downside if the trend remains strong. The key takeaway from the daily chart is the oversold condition, which could provide a floor. However, without a clear catalyst or a confirmed break of resistance, the overall trend still appears to be downwards, or at best, consolidating with a bearish bias. The support level at $4,311.83 on the daily chart becomes a critical level to defend for any potential bull recovery.
Correlation with Macro Drivers
The interplay between gold, the US Dollar Index (DXY), and interest rate expectations is paramount. With the DXY currently around 99.45 and showing strength, it's exerting downward pressure on gold. This inverse correlation is a well-established market dynamic. If the Fed signals a more hawkish stance due to persistent inflation, the DXY could strengthen further, pushing gold towards its lower support levels. Conversely, if inflation data surprises to the downside, or if geopolitical risks escalate significantly, we could see a flight to safety that benefits gold, potentially weakening the dollar and leading to a rally. The current market sentiment seems to be favoring the former, given the strength in bond yields. However, the oversold technicals on gold suggest that the market might be heavily priced for higher rates, creating an environment where positive surprises for gold (e.g., softer inflation data) could lead to a sharp upward correction. The price action below the 1-hour resistance at $4,403.26 is a clear sign that immediate bullish conviction is lacking.
The Verdict: Navigating the Uncertainty
The Tug-of-War Continues
The current technical and fundamental picture for XAUUSD is one of significant conflict. The oversold conditions on daily charts present a compelling argument for a potential bounce, supported by ongoing geopolitical risks and central bank diversification. The RSI at 26.48 and Stochastic at 9.08 are hard to ignore for value seekers. However, the strong downtrend signals on the 1-hour and 4-hour charts, coupled with a strengthening DXY and the persistent inflation narrative, provide a formidable counter-argument. The ADX readings of 42.57 (1H) and 64.39 (4H) cannot be understated – they indicate a strong prevailing trend that is currently bearish. The support at $4,336.19 (1H) and $4,311.93 (1H) are critical points. A break below these could trigger further selling, invalidating the oversold bounce thesis.
Focus on Key Levels and Confirmation
For traders, the path forward requires patience and a focus on actionable price levels. The immediate battleground is the $4,360.44 current price. A sustained move above the 1-hour resistance at $4,403.26 would be the first sign of a potential bullish shift, targeting $4,446.07. Conversely, a decisive break below the 1-hour support at $4,336.19, followed by a close below the daily support at $4,311.83, would confirm the bearish trend continuation, potentially targeting $4,269.12. The market is at a critical inflection point where confirmation is key. Relying solely on oversold indicators without seeing a shift in trend momentum or a fundamental catalyst could be a risky strategy. The current setup demands a measured approach, waiting for clear signals rather than anticipating a reversal.
A Balanced Outlook
Given the conflicting signals, the most prudent approach is to acknowledge the current neutrality on the daily chart, but with a strong bearish undertone from the shorter timeframes and macro environment. The price is currently consolidating around $4,360.44, caught between the oversold technicals and the strong bearish trend indicators. Until a clear catalyst emerges - either a significant shift in inflation data, a change in Fed forward guidance, or a de-escalation of geopolitical tensions - XAUUSD is likely to remain volatile. The $4,311.93 support level is critical. Holding this could allow for a retest of higher resistance levels, but breaking it would likely accelerate the downtrend. Patience is indeed the key here; the market will likely provide a clearer direction once these opposing forces resolve.
Frequently Asked Questions: XAUUSD Analysis
What happens if XAUUSD breaks below the $4,311.93 support level on the 1-hour chart?
A break below $4,311.93 would confirm the continuation of the strong bearish trend indicated by the ADX at 42.57 on the 1-hour chart. This could trigger further selling pressure, potentially targeting the next support at $4,269.12 as the market re-evaluates its positions.
Should I buy XAUUSD at current levels of $4,360.44 given the RSI at 26.48?
While the daily RSI at 26.48 suggests oversold conditions, the strong bearish trend on shorter timeframes (ADX 42.57 on 1H) warrants caution. A high-probability setup would involve waiting for confirmation, such as a hold above $4,336.19 and a move towards $4,403.26, before considering a long position.
Is the MACD signal below its signal line on the daily chart a strong sell signal for XAUUSD?
The MACD being negative on the daily chart confirms bearish momentum, but it's not a standalone sell signal. It should be viewed in conjunction with other indicators and price action. While it suggests caution for long positions, the oversold RSI might indicate that selling pressure is weakening, requiring further confirmation for a definitive trade.
How will the upcoming NFP data affect XAUUSD this week, given the current DXY strength?
A stronger-than-expected NFP report could further bolster the DXY and push XAUUSD lower towards $4,311.93, as it might reinforce expectations of higher-for-longer interest rates. Conversely, a weaker report could weaken the dollar and provide a catalyst for gold to test resistance levels like $4,403.26.
Bearish Scenario: Trend Continuation
65% ProbabilityNeutral Scenario: Consolidation Around $4,360
25% ProbabilityBullish Scenario: Oversold Bounce
10% ProbabilityVolatility creates opportunity - those prepared will be rewarded. Patience and disciplined risk management are your greatest allies in navigating these choppy waters.
Track markets in real-time
AI-powered analysis, technical indicators and real-time price data.
Join Our Telegram Channel
Breaking market news, AI analysis and trading signals instantly.
Join Channel