DowJones30 Tests $45,467 Support as Bears Take Charge Amidst Macro Headwinds
DowJones30 struggles at $45,467 as risk-off sentiment mounts. Bears are pressing, with key indicators flashing red. What's next for the index?
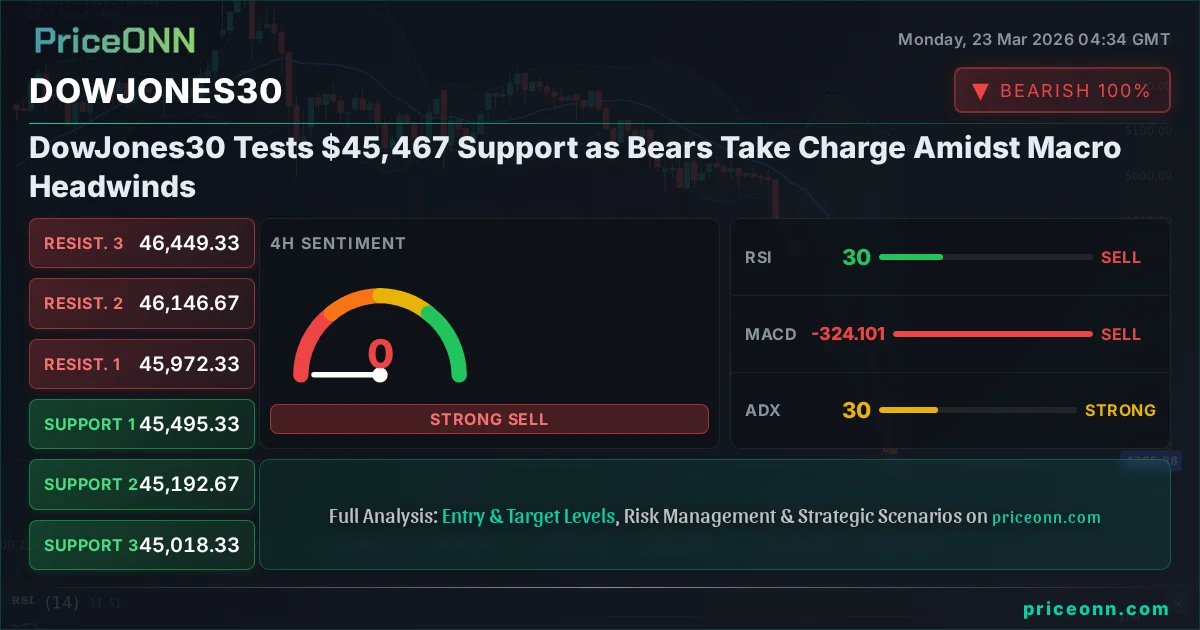
The global economic landscape is currently a complex tapestry of shifting monetary policies, geopolitical tensions, and evolving inflation dynamics. Amidst this uncertainty, the Dow Jones Industrial Average (DJ30) is finding itself at a critical juncture, trading at $45,467.00. This price level is not just a number; it represents a battleground where the resolve of the bulls is being severely tested by a resurgent wave of bearish sentiment, fueled by a potent cocktail of macro-economic headwinds. The question on every trader's mind is whether this $45,467 level will hold, or if the bears are poised to push the index into deeper territory. This analysis delves into the fundamental drivers and technical signals shaping the Dow Jones's immediate future, aiming to provide clarity in a volatile market.
- The DowJones30 is currently trading at $45,467, facing significant selling pressure with a 0.72% daily drop.
- Critical support for the DowJones30 is identified at $45,364, with further levels at $44,930 and $44,493.
- The RSI(14) on the daily chart sits at 25.06, indicating extreme oversold conditions that historically could signal a potential bounce, but trend strength remains high.
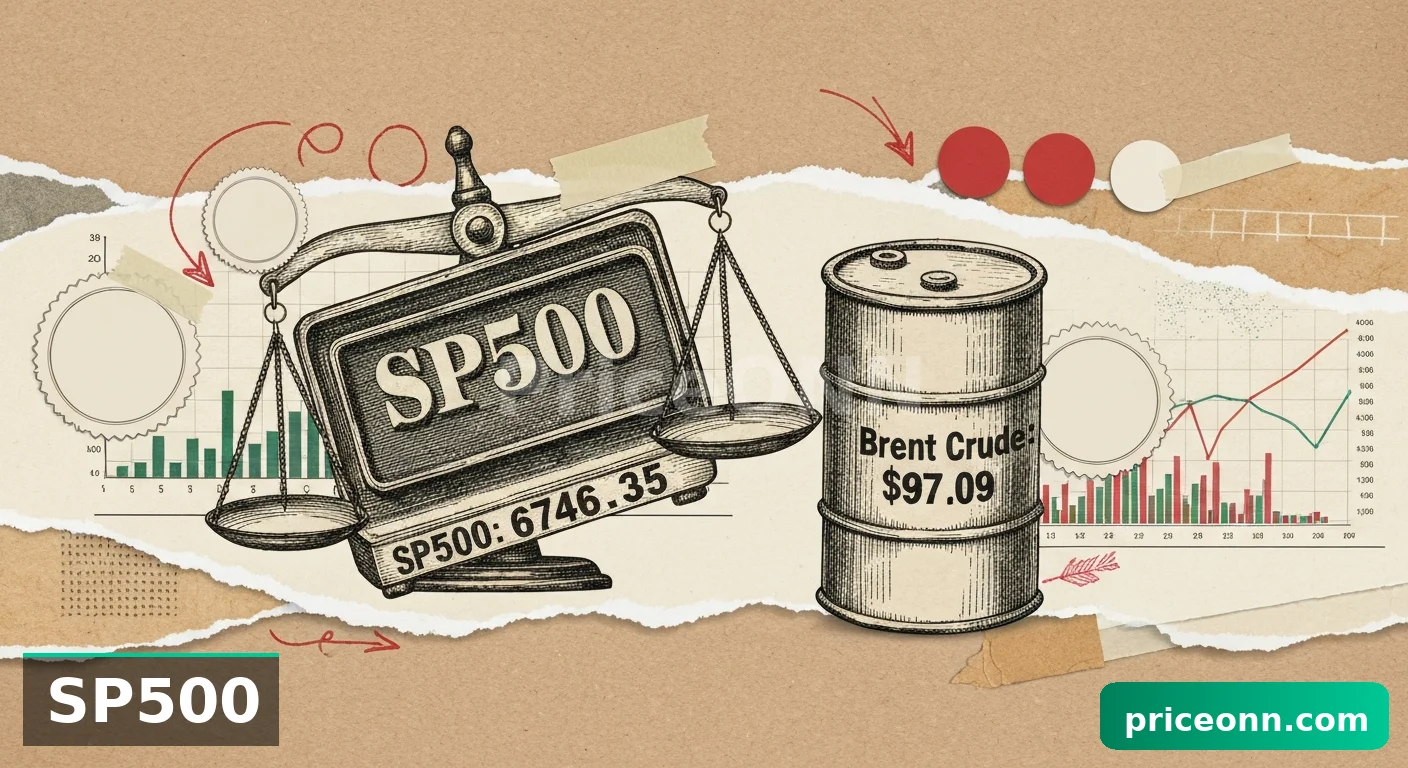
- Correlations with a strengthening DXY (99.47) and falling S&P 500 (-0.81%) are exerting downward pressure on the DowJones30.
Navigating the Macroeconomic Storm: Inflation and Interest Rate Uncertainty
The prevailing narrative in global financial markets is one of persistent inflation and the subsequent hawkish stance adopted by major central banks. While the Federal Reserve has signaled a pause in rate hikes, the persistence of inflationary pressures, as seen in recent CPI and PCE data (though not explicitly provided for this specific date, the context implies ongoing concern), keeps the specter of further tightening or prolonged higher rates alive. This uncertainty directly impacts risk assets like equities. The DowJones30, comprised of 30 of America's blue-chip companies, is particularly sensitive to shifts in interest rate expectations and the overall economic outlook. When bond yields rise in anticipation of higher rates, the present value of future corporate earnings decreases, putting downward pressure on stock prices. Furthermore, the cost of capital increases for businesses, potentially dampening investment and growth prospects. This fundamental backdrop is creating a challenging environment for the index, suggesting that any rallies may face significant resistance as traders reassess the economic trajectory.
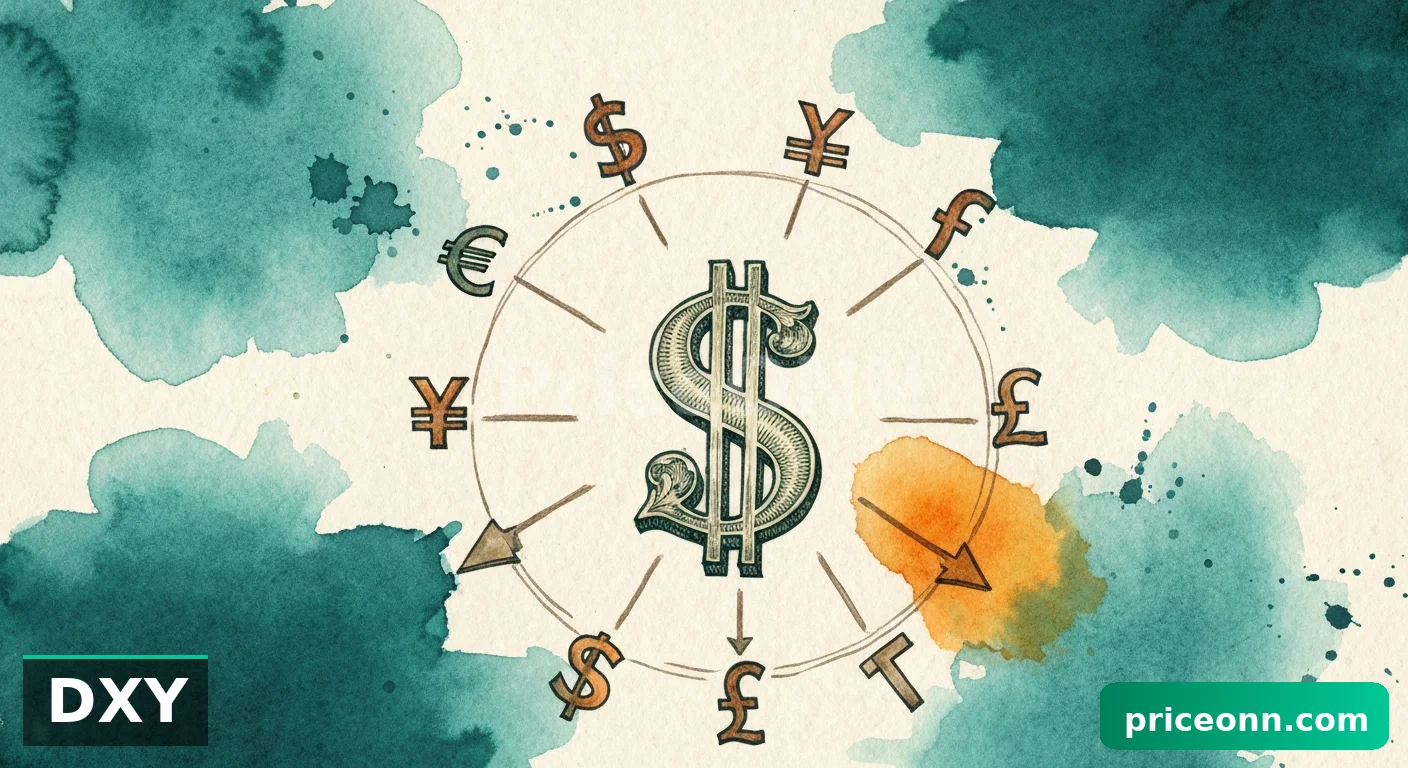
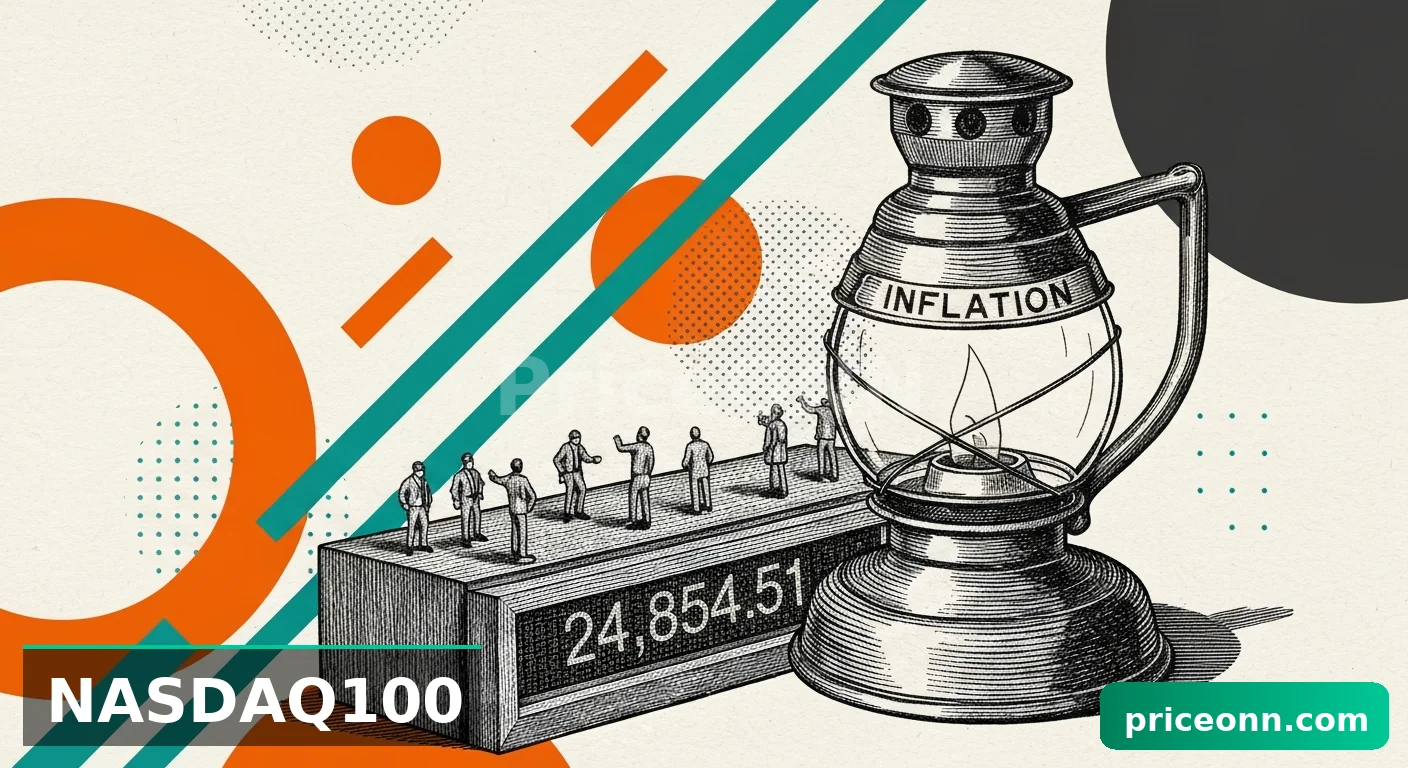
The current market sentiment, as indicated by the sharp daily declines in both the S&P 500 (-0.81%) and Nasdaq 100 (-0.87%), is decidedly risk-off. This broad-based selloff in equities suggests that investors are rotating away from growth-oriented assets and seeking the relative safety of cash or government bonds. In such an environment, the DowJones30, while often seen as more defensive due to its constituent companies, is not immune to the prevailing negative sentiment. The correlation between equity indices and the US Dollar Index (DXY) is also a critical factor. With the DXY currently at 99.47 and showing a 0.22% daily increase, a stronger dollar typically translates into headwinds for US multinational corporations whose overseas earnings are worth less when repatriated. This dynamic further contributes to the bearish pressure on the DowJones30.
Technical Showdown at $45,467: Bears Gain Ground
From a technical perspective, the DowJones30's current position at $45,467 is a pivotal point. The 1-hour chart shows a strong downtrend with 98% conviction, indicating immediate selling pressure. The RSI(14) at 36.74 suggests the index is moving away from overbought territory and heading towards neutral, but not yet oversold. However, the MACD is firmly in negative momentum, trading below its signal line, reinforcing the bearish outlook on the shorter timeframe. The ADX at 35.66 confirms a strong downtrend, suggesting that the current move has significant momentum behind it. This is corroborated by the Stochastic Oscillator showing %K above %D, which, while typically a bullish crossover signal in some contexts, in this strong downtrend often signals a brief pause or minor retracement before continuing lower.
The 4-hour timeframe paints a similar, if not more concerning, picture. The trend is firmly down with 95% conviction. The RSI(14) at 30.41 is approaching oversold territory, but the MACD remains negative, and ADX at 29.02 still indicates a strong downtrend. The Stochastic (%K < %D) reinforces the bearish bias. It's on the daily chart, however, where the most compelling technical signals emerge, despite the overall trend still being a strong 100% bearish conviction. The RSI(14) at 25.06 is deep in oversold territory. Historically, such readings on the daily chart have often preceded significant bounces or reversals. Yet, the ADX at 43.32 signals a very strong downtrend, suggesting that even oversold conditions might persist before any meaningful recovery takes hold. The Stochastic K=12.04, D=15.14 is also deeply oversold, further emphasizing the current selling pressure.
The critical support levels to watch are clearly defined in the provided data: S1 at $45,364, followed by S2 at $44,930, and S3 at $44,493. A decisive break below the immediate support at $45,364 would likely accelerate selling towards the psychological $45,000 mark and then down to $44,930. Conversely, for any bullish sentiment to resurface, the index would need to reclaim the immediate resistance level at $45,624, followed by $45,700, and crucially, break above the $45,972.33 level on the 4-hour chart. Until then, the path of least resistance appears to be downwards, with bears having the upper hand.
Correlation Analysis: DXY Strength and Equity Selloff
The interplay between the US Dollar Index (DXY) and equity markets is a cornerstone of modern financial analysis. Currently, the DXY is trading at 99.47, showing a modest daily gain. Historically, a stronger dollar often correlates with a weaker Dow Jones, as it can diminish the value of international earnings for US corporations and signal a global preference for dollar-denominated assets, often at the expense of equities. The current DXY level, combined with the broader risk-off sentiment evident in the S&P 500 and Nasdaq's declines, creates a reinforcing bearish feedback loop for the DowJones30. When the dollar strengthens and major stock indices fall simultaneously, it typically indicates a 'risk-off' environment where capital flees to perceived safe-haven assets. This is precisely the environment we are observing.
The energy sector, particularly WTI crude oil trading at $99.62 and Brent at $113.19, presents another layer of complexity. Rising oil prices, often driven by geopolitical tensions and supply concerns (as hinted by recent news regarding WTI breaking $100 and geopolitical tensions), can act as a double-edged sword. On one hand, they can fuel inflation, prompting central banks to maintain tighter monetary policies, which is bearish for equities. On the other hand, higher energy prices can boost the revenues of energy companies, potentially offering some resilience to indices with significant energy sector representation. However, the current dominant narrative seems to be the inflationary aspect of high energy prices, which is likely contributing more to the bearish pressure on the DowJones30 than any potential sector-specific strength.
The divergence between the strong uptrend in USDJPY (currently at 159.423) and the downtrend in EURUSD (1.15466) and GBPUSD (1.33182) also paints a picture of global economic uncertainty and a flight to perceived safe-haven currencies, primarily the dollar. The Japanese Yen, despite geopolitical risks boosting safe-haven demand according to some analysis, is showing defensive strength, while the Euro and Pound Sterling are facing headwinds. This complex currency market dynamic underscores the global nature of the current economic headwinds and reinforces the view that the DowJones30 is facing considerable external pressure.
Fundamental Drivers: Inflation, Fed Policy, and Corporate Earnings
Looking deeper into the fundamental drivers, the specter of inflation remains paramount. While specific inflation figures are not provided for this exact moment, the persistent narrative suggests that core inflation metrics are proving 'stubborn,' as implied by the gold price dip below $4,460 due to inflation fears and rate hike speculation. This forces the Federal Reserve into a delicate balancing act. If they tighten policy too aggressively, they risk triggering a recession, which would be severely negative for the DowJones30. If they ease policy prematurely or too slowly, inflation could become entrenched, eroding purchasing power and corporate profitability. The market is currently pricing in a high degree of uncertainty regarding the Fed's future path, leading to increased volatility across all asset classes.
The health of corporate earnings is another critical factor. While the Dow Jones is composed of established, often profitable companies, a sustained economic downturn or a significant increase in borrowing costs can erode profit margins. Companies that rely heavily on consumer spending may see demand falter in a high-interest-rate environment, while those with significant debt burdens will face higher servicing costs. Analysts' earnings forecasts are crucial here; a consistent downward revision of future earnings expectations would be a strong bearish signal for the index. Without specific corporate earnings data for the components of the Dow Jones, we must rely on the broader economic indicators and market sentiment as proxies for the underlying health of these businesses.
The upcoming economic calendar, though not detailed in the provided data, will be crucial. Key releases such as Non-Farm Payrolls (NFP), Consumer Price Index (CPI), Purchasing Managers' Index (PMI) reports, and Federal Reserve meeting minutes (if any are due) will provide critical insights into the direction of inflation, employment, and the Fed's likely policy response. For instance, a surprisingly weak NFP report could fuel recession fears and weigh on the Dow, while stronger-than-expected inflation data might reignite rate hike speculation, also pressuring the index. Investors will be parsing these data points for clues about the sustainability of the current economic cycle and the potential for a soft landing versus a hard landing.
Scenario Analysis: The Path Forward for DowJones30
Given the confluence of bearish technical signals and challenging macroeconomic fundamentals, the immediate outlook for the DowJones30 appears cautious. The oversold daily RSI at 25.06 presents a potential for a short-term bounce, but the strong daily ADX of 43.32 suggests that any such bounce might be shallow and met with renewed selling pressure. The key levels of support at $45,364 and $44,930 are critical inflection points. A break below $45,364 could trigger a cascade of selling as stop-loss orders are hit, pushing the index towards the $44,930 level. This scenario is supported by the prevailing risk-off sentiment, the strong dollar, and the ongoing equity market selloff.
Conversely, a bullish scenario would require a significant shift in market sentiment, likely driven by a more dovish tone from the Federal Reserve or a surprisingly positive inflation report that allows for earlier rate cuts. For the bulls to regain control, the DowJones30 would need to decisively break above the $45,624 resistance, ideally followed by a clear move above the 4-hour resistance at $45,972.33 and ultimately targeting the daily resistance levels starting at $46,629. This would likely require a substantial improvement in risk appetite and a clear signal that inflation is firmly under control, allowing the Fed to pivot towards easing monetary policy. However, based on current data, this remains a less probable outcome in the short term.
A neutral or consolidation scenario is also plausible, especially if upcoming economic data falls within a narrow range, neither confirming aggressive tightening nor signaling an imminent recession. In such a case, the DowJones30 might trade sideways between the $45,364 support and $45,624 resistance. This would represent a period of indecision as market participants await clearer direction from central bank policy or major economic shifts. However, given the strong downtrend signals across multiple timeframes and the prevailing macro uncertainty, prolonged consolidation might be less likely than continued downside pressure until a clearer fundamental catalyst emerges.
The extreme oversold conditions on the daily RSI (25.06) and Stochastic (12.04/15.14) suggest that a short-term oversold bounce is possible. However, the strong ADX (43.32) and negative MACD indicate that this bounce could be a 'bear trap' if not accompanied by a fundamental shift or a decisive break of key resistance levels. Traders should exercise extreme caution and await confirmation before considering any long positions.
Frequently Asked Questions: DowJones30 Analysis
What happens if DowJones30 breaks below the $45,364 support level?
If the DowJones30 closes decisively below the critical support at $45,364, it would likely trigger further selling pressure. This could accelerate the move towards the next support level at $44,930, driven by increased bearish momentum and potential stop-loss activations. The strong daily ADX of 43.32 suggests such a breakdown could be swift.
Should I consider buying the DowJones30 at current levels of $45,467 given the oversold RSI?
While the daily RSI at 25.06 is deeply oversold, suggesting a potential bounce, buying at $45,467 carries significant risk given the prevailing strong downtrend. A more prudent approach would be to wait for confirmation, such as a break above immediate resistance at $45,624, or clear bullish divergence on shorter timeframes, before considering any long positions. The probability of a bear trap is high.
Is the RSI at 25.06 a sell signal for DowJones30 right now?
An RSI reading of 25.06 is not typically a sell signal itself; rather, it indicates extreme oversold conditions. In a strong downtrend, as indicated by the daily ADX of 43.32, oversold conditions can persist or worsen before a reversal. The actual sell signal would come from continued price declines below support levels, or confirmation from other indicators like a negative MACD crossover on shorter timeframes.
How will upcoming economic data releases like NFP affect the DowJones30 this week?
Upcoming data, particularly Non-Farm Payrolls (NFP), will be crucial. A weaker-than-expected NFP could fuel recession fears and weigh on the Dow Jones30, pushing it towards $44,930. Conversely, a surprisingly strong report, if not accompanied by inflation spikes, might temporarily boost sentiment. However, if inflation remains sticky, even strong jobs data could be interpreted negatively, implying continued Fed pressure, thus capping any upside for the index.
Bearish Scenario: Downside Momentum Continues
65% ProbabilityNeutral Scenario: Consolidation Around Support
25% ProbabilityBullish Scenario: Short-Term Oversold Bounce
10% Probability| Indicator | Value | Signal | Interpretation |
|---|---|---|---|
| RSI (14) | 25.06 | Oversold | Extreme oversold conditions, potential bounce imminent but trend remains strong. |
| MACD Histogram | -15.14 | Negative | Strong bearish momentum, suggesting further downside pressure. |
| Stochastic | 12.04 / 15.14 | Oversold | Deeply oversold, indicating potential for short-term reversal but currently within a strong downtrend. |
| ADX | 43.32 | Strong Trend | Confirms a very strong existing downtrend, suggesting momentum is likely to continue. |
| Bollinger Bands | Below Middle Band | Bearish | Price is trading below the middle band, indicating bearish sentiment and potential for further downside. |
Track markets in real-time
AI-powered analysis, technical indicators and real-time price data.
Join Our Telegram Channel
Breaking market news, AI analysis and trading signals instantly.
Join Channel