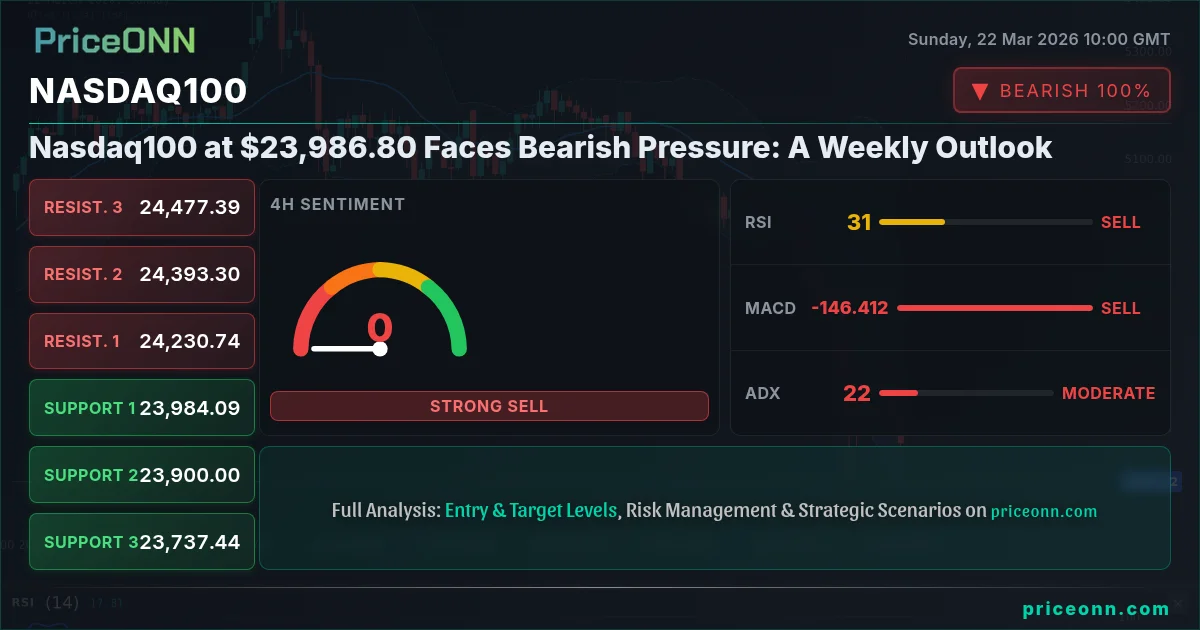
Nasdaq100 at $23,986.80 Faces Bearish Pressure: A Weekly Outlook
Nasdaq100 closed last week at $23,986.80 amid broad market weakness. This analysis delves into key drivers and the outlook for the coming week.
Last Friday's close for the Nasdaq100 at $23,986.80 marked the end of a challenging week, with the index succumbing to significant selling pressure. The sharp 1.67% decline, or $406.85, to finish at 23,986.80, underscores a palpable shift in market sentiment. This wasn't just a minor dip; it was a decisive move that saw the index test lower levels, reflecting broader concerns about economic growth, inflation persistence, and the trajectory of monetary policy. As we step into a new trading week, the critical question on many investors' minds is whether this bearish momentum will continue or if opportunities for a rebound are emerging. Understanding the interplay of macroeconomic factors, technical signals, and geopolitical undercurrents is paramount for navigating the choppy waters ahead.
- The Nasdaq100 closed last Friday at $23,986.80, down 1.67% for the week.
- Critical support for the Nasdaq100 is currently at $23,984.09 (4H), tested multiple times. A break below could target $23,737.44.
- RSI(14) on the daily chart sits at 32.52, indicating oversold conditions but still within a downtrend.
- The Dollar Index (DXY) at 99.25 shows strength, correlating with equity market weakness and pressuring tech stocks.
- Upcoming economic data, particularly inflation figures and central bank commentary, will be crucial for the Nasdaq100's direction.
Navigating the Sell-Off: Last Week's Developments
The past week proved to be a difficult one for technology-heavy indices, with the Nasdaq100 leading the retreat. The 1.67% drop, bringing the index to $23,986.80, was not an isolated event but rather a symptom of a broader risk-off sentiment gripping global markets. Several factors contributed to this downturn. Firstly, persistent inflation concerns continue to weigh on investor sentiment. While some data points might suggest moderation, the 'higher for longer' interest rate narrative from major central banks, particularly the Federal Reserve, remains a dominant theme. The prospect of elevated borrowing costs for longer than anticipated dampens corporate earnings outlooks and reduces the present value of future cash flows, a critical factor for growth-oriented tech stocks that constitute the Nasdaq100.
Secondly, geopolitical tensions, though evolving, continue to cast a shadow. Recent energy market disruptions, such as the reported attack on Qatar's Ras Laffan energy hub, though not directly tied to US tech, contribute to a general sense of global instability. Such events can indirectly impact markets by fueling inflation fears, prompting safe-haven flows away from riskier assets like equities, and potentially influencing central bank policy decisions. The energy market's reaction, with Brent Crude rallying significantly, highlights the ongoing sensitivity to supply disruptions and their inflationary implications. This backdrop of uncertainty makes investors more cautious, leading them to trim exposure to assets perceived as riskier, including high-growth technology stocks.
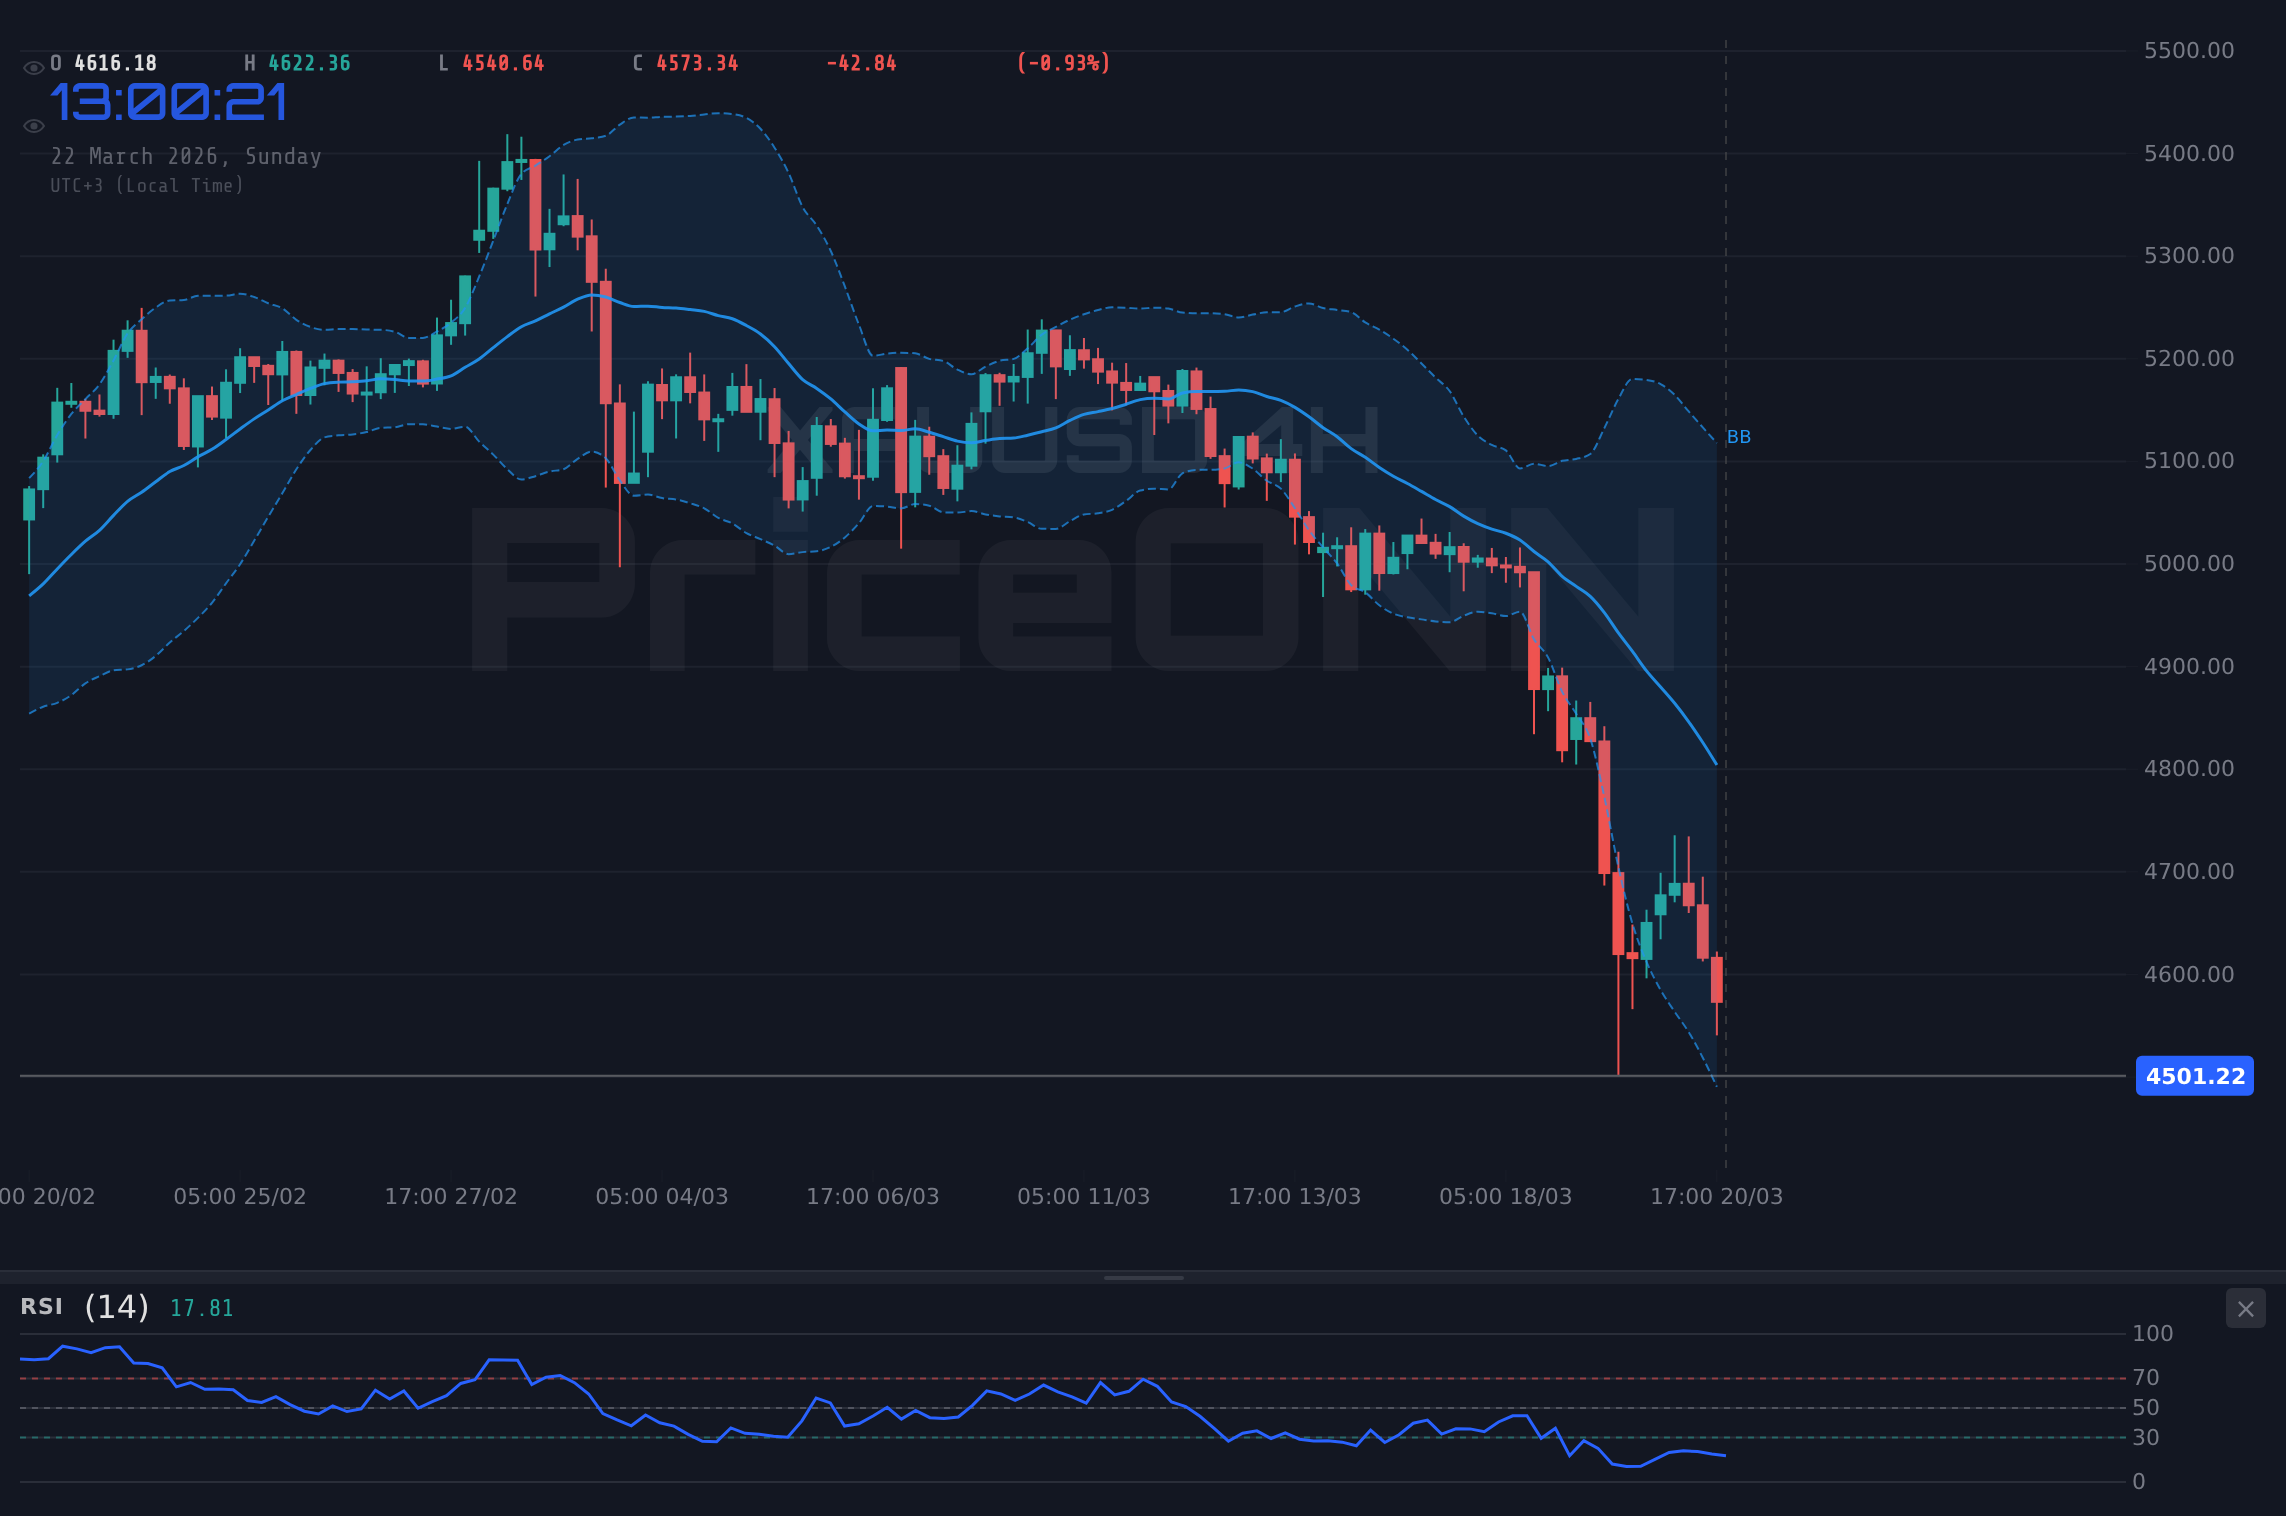
Technically, the Nasdaq100's close below key short-term moving averages on the 1-hour and 4-hour charts signaled a weakening trend. The index's inability to hold above the $24,000 psychological level proved to be a critical turning point, leading to accelerated selling as stops were triggered. The daily chart, while showing RSI(14) at 32.52 - approaching oversold territory - still depicts a strong downtrend, with MACD remaining negative and below its signal line. This suggests that while a short-term bounce is possible, the underlying bearish momentum remains intact. The ADX on the daily chart at 44.59 further confirms the strength of the prevailing downtrend, indicating that the bears are firmly in control.
Fundamental Drivers: Inflation, Rates, and the Fed's Stance
The most significant fundamental driver impacting the Nasdaq100 remains the persistent inflation data and the subsequent reaction from central banks, primarily the U.S. Federal Reserve. Despite some optimistic readings in previous months, recent indicators suggest that inflation may be more 'sticky' than initially hoped. This has led to a recalibration of market expectations regarding the Fed's monetary policy path. The prospect of delayed or fewer interest rate cuts in 2026 is now a central theme. Futures markets, which were once pricing in multiple rate cuts, are now reflecting a more cautious outlook, with the probability of cuts being reduced. This shift directly impacts the valuation of growth stocks, as higher discount rates reduce the present value of their future earnings.
The Federal Reserve's communication has been carefully watched. While policymakers acknowledge progress in bringing inflation down, they also emphasize the need for greater confidence that inflation is sustainably moving towards the 2% target. Statements from Fed officials have consistently highlighted a data-dependent approach, but the underlying tone often leans towards caution, signaling a reluctance to ease policy prematurely. This hawkish bias, or at least a prolonged period of restrictive policy, creates headwinds for equity markets, particularly for sectors like technology that are sensitive to interest rate movements. The correlation between the Nasdaq100 and the Dollar Index (DXY) is also noteworthy. With the DXY at 99.25 and showing upward momentum on the daily chart (ADX 34.64), a stronger dollar typically exerts downward pressure on US equities, as it makes dollar-denominated assets more expensive for foreign investors.
Looking ahead, upcoming economic releases will be critical. Key inflation indicators, such as the Consumer Price Index (CPI) and Personal Consumption Expenditures (PCE) price index, will provide crucial insights into whether inflationary pressures are truly abating. Similarly, employment data, including Non-Farm Payrolls (NFP) and unemployment rate figures, will offer clues about the health of the labor market and its potential impact on wage growth and consumer spending, both of which influence inflation. Any data that suggests a re-acceleration of inflation or a surprisingly robust labor market could further solidify the 'higher for longer' interest rate narrative, putting additional strain on the Nasdaq100. Conversely, signs of cooling inflation or a softening labor market might offer some relief, potentially paving the way for a more dovish Fed stance and a rebound in growth stocks.
Technical Picture: Bears in Control Below Key Levels
The technical landscape for the Nasdaq100, as of the last trading week's close at $23,986.80, paints a decidedly bearish picture, particularly on the shorter timeframes. On the 1-hour chart, the trend is firmly established as bearish with a strength of 99%. The index is trading below its key moving averages, and indicators like RSI(14) at 37.71 suggest further downside potential before any significant oversold bounce might occur. The MACD is firmly in negative territory, below its signal line, confirming bearish momentum. The ADX at 37.97 indicates a strong downtrend is in play, making it challenging for bulls to establish control.
The 4-hour chart reinforces this bearish outlook. With a trend strength of 92%, the Nasdaq100 is showing clear signs of weakness. Key support levels at $23,984.09 and $23,900 are being tested. A decisive break below $23,984.09 could accelerate the decline towards the next support at $23,737.44. The RSI(14) at 32.35 is in oversold territory, but this can persist in strong downtrends. The Stochastic oscillator's %K line crossing below its %D line provides a bearish signal, and the ADX at 24.88, while slightly weaker than the 1-hour, still indicates a trending market, favoring further downside. The Bollinger Bands are also showing the price trading below the middle band, reinforcing the bearish bias.
On the daily timeframe, the picture is stark. The trend is unequivocally bearish with 100% strength. The Nasdaq100 closed at $23,986.80, well below its daily middle Bollinger Band and approaching the lower band. The RSI(14) at 32.52 is approaching oversold conditions, which historically can precede a rebound, but the MACD remains deeply negative, and the ADX at 44.59 signals a very strong downtrend. This confluence of bearish technical signals suggests that the path of least resistance remains to the downside. While a bounce from current levels is not impossible, it would likely be a counter-trend move within a larger bearish structure unless significant fundamental catalysts emerge to shift the narrative. The key resistance levels to watch on the upside are $24,230.74 (4H) and $24,561.68 (1D), while support lies at $23,984.09 (4H) and $23,675.46 (1H).
Correlation Analysis: DXY, Equities, and Oil
Understanding the Nasdaq100's movement requires looking beyond its individual chart. Its performance is intricately linked to broader market forces, particularly the U.S. Dollar Index (DXY), major equity indices like the S&P 500, and commodity prices such as oil. Last week, the DXY showed resilience, closing around 99.25 and exhibiting upward momentum on the daily chart. This strengthening dollar often acts as a headwind for US equities, including the Nasdaq100. A stronger dollar makes American goods and assets more expensive for foreign buyers, potentially dampening export demand and corporate earnings. Furthermore, it can attract capital away from riskier assets towards the perceived safety of the dollar, especially during times of global economic uncertainty. The inverse correlation between the DXY and the Nasdaq100, while not always perfect, was evident last week as the dollar's strength coincided with the tech index's decline.
The performance of the S&P 500 and Nasdaq 100 are often closely correlated, acting as bellwethers for overall market risk appetite. Last week, both indices experienced significant declines, with the S&P 500 falling 1.2% to 6,536.67 and the Nasdaq 100 dropping 1.67% to $23,986.80. This synchronized downturn suggests a systemic risk-off sentiment rather than sector-specific issues. When major indices fall together, it indicates a broad-based deleveraging or flight to safety, which can exacerbate downward pressure on all but the most defensive assets. The fact that both indices are showing strong downtrends on their respective technical charts (S&P 500 ADX 44.59, Nasdaq ADX 44.59 on daily) confirms this broad market weakness.
Oil prices, specifically Brent Crude, have been a key indicator of inflationary pressures and geopolitical risk. Last week saw a significant rally in oil prices, with Brent Crude closing around $112.54, up 4.58%. This surge, potentially linked to geopolitical events like the reported attack on Qatar's energy hub, signals rising energy costs. Higher energy prices have a direct inflationary impact, which can complicate central bank efforts to bring inflation under control. This, in turn, reinforces the 'higher for longer' interest rate narrative, which is detrimental to growth stocks like those dominating the Nasdaq100. The correlation here is indirect but potent: rising oil prices fuel inflation fears, which lead to tighter monetary policy expectations, which pressure tech valuations.
Looking Ahead: Key Events and Levels to Watch
The upcoming week promises to be pivotal for the Nasdaq100, with several key economic events on the horizon that could significantly influence its trajectory. The primary focus will undoubtedly be on inflation data. Any readings that suggest inflation is re-accelerating or proving more stubborn than expected could reinforce the hawkish stance of the Federal Reserve and lead to further pressure on the index. Conversely, a surprisingly benign inflation report might offer a glimmer of hope for a less restrictive monetary policy, potentially sparking a relief rally. Investors will be scrutinizing the specifics of these reports, looking not just at headline numbers but also at core inflation components and forward-looking indicators.
Central bank commentary will also be under the spotlight. Speeches or minutes from Federal Reserve officials could provide further clarity on their current assessment of the economy and their future policy intentions. Any hints towards a shift in tone, either towards greater caution or a more definitive stance on interest rates, will be closely monitored. The market's reaction to these communications will be a key determinant of short-to-medium term price action. Beyond inflation and central bank policy, other economic data, such as employment figures and manufacturing indices (PMI), will offer a broader picture of economic health. Stronger-than-expected data could be interpreted as a sign of economic resilience, potentially supporting risk assets, but could also fuel inflation concerns, creating a mixed signal.
From a technical perspective, the immediate levels to watch for the Nasdaq100 are clear. On the downside, the 4-hour support at $23,984.09 is the first critical barrier. A close below this level could trigger a move towards $23,737.44 and potentially $23,675.46 (1H support). On the upside, resistance remains at $24,230.74 (4H) and $24,477.39 (4H). A sustained move above these levels would be required to signal a potential short-term bottom or a significant correction. However, given the prevailing bearish technicals and the prevailing macroeconomic headwinds, the path of least resistance appears to be downwards. The strength of the downtrend indicated by ADX values across multiple timeframes suggests that any rallies might be met with renewed selling pressure, especially if key resistance levels are approached without a fundamental shift.
Trading Scenarios for the Week Ahead
Bearish Scenario: Continued Downtrend
65% ProbabilityNeutral Scenario: Consolidation and Range-Bound Action
25% ProbabilityBullish Scenario: Short-Covering Rally
10% ProbabilityFrequently Asked Questions: Nasdaq100 Analysis
What happens if the Nasdaq100 breaks below the 4H support at $23,984.09?
A break below $23,984.09 on the 4-hour chart would invalidate the neutral scenario and likely trigger further selling. The immediate target would then be the next support level at $23,737.44, with a potential extension towards $23,675.46 if the bearish momentum persists.
Should I consider buying the Nasdaq100 at current levels around $23,986.80 given the oversold RSI?
While the daily RSI(14) at 32.52 suggests oversold conditions, it is still within a strong downtrend (ADX 44.59). Buying solely based on oversold RSI without confirmation of a trend reversal or a clear bullish trigger is risky. A more prudent approach would be to wait for price to hold above key resistance levels like $24,120.99 or for a confirmed bullish signal.
Is the RSI at 32.52 a sell signal for the Nasdaq100 right now?
An RSI of 32.52 is not inherently a sell signal; rather, it indicates that the index is approaching oversold territory. However, in the context of a strong downtrend confirmed by ADX 44.59 and negative MACD momentum, it suggests that selling pressure might be nearing exhaustion, but a reversal is not yet confirmed. It's more of a warning sign for continued selling than a direct buy signal.
How will upcoming inflation data and Fed commentary affect the Nasdaq100 this week?
Upcoming inflation data and Fed commentary are critical catalysts. If inflation proves higher than expected, it could reinforce the 'higher for longer' rate narrative, pressuring the Nasdaq100 further towards $23,675.46. Conversely, softer inflation could lead to a dovish shift in expectations, potentially triggering a rally towards $24,230.74 and above.
The week ahead for the Nasdaq100 presents a critical juncture. With the index closing last Friday at $23,986.80 under significant bearish pressure, the immediate outlook remains cautious. The confluence of bearish technical signals, persistent inflation concerns, and a hawkish Federal Reserve stance creates a challenging environment for growth stocks. However, markets are dynamic, and opportunities often arise from volatility. For traders and investors, the key will be to observe how the index reacts to the key support and resistance levels discussed, and critically, how incoming economic data and central bank communications shape future expectations. Disciplined risk management and a clear understanding of the primary trend, while remaining alert to potential trend-changing catalysts, will be essential for navigating the coming trading sessions.
Track markets in real-time
AI-powered analysis, technical indicators and real-time price data.
Join Our Telegram Channel
Breaking market news, AI analysis and trading signals instantly.
Join Channel