BRENT Crude Oil Holds Steady at $112.54: Weekly Outlook & Multi-Scenario Analysis
BRENT Crude Oil hovers around $112.54. Explore bullish, bearish, and neutral scenarios, key technical levels, and upcoming events driving the oil market.
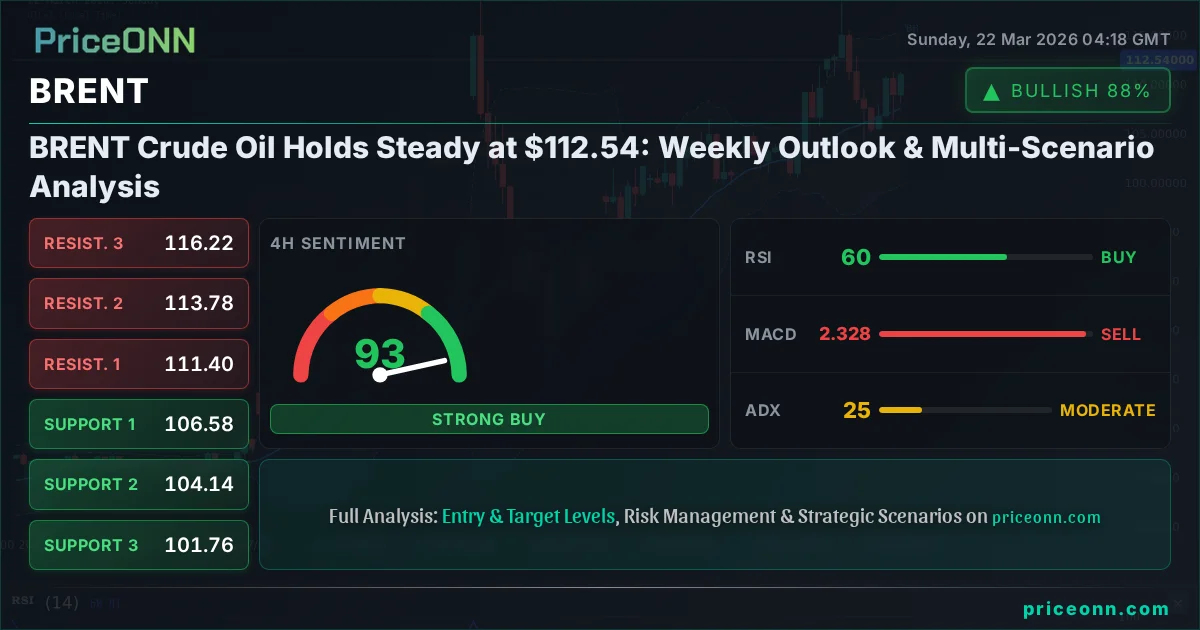
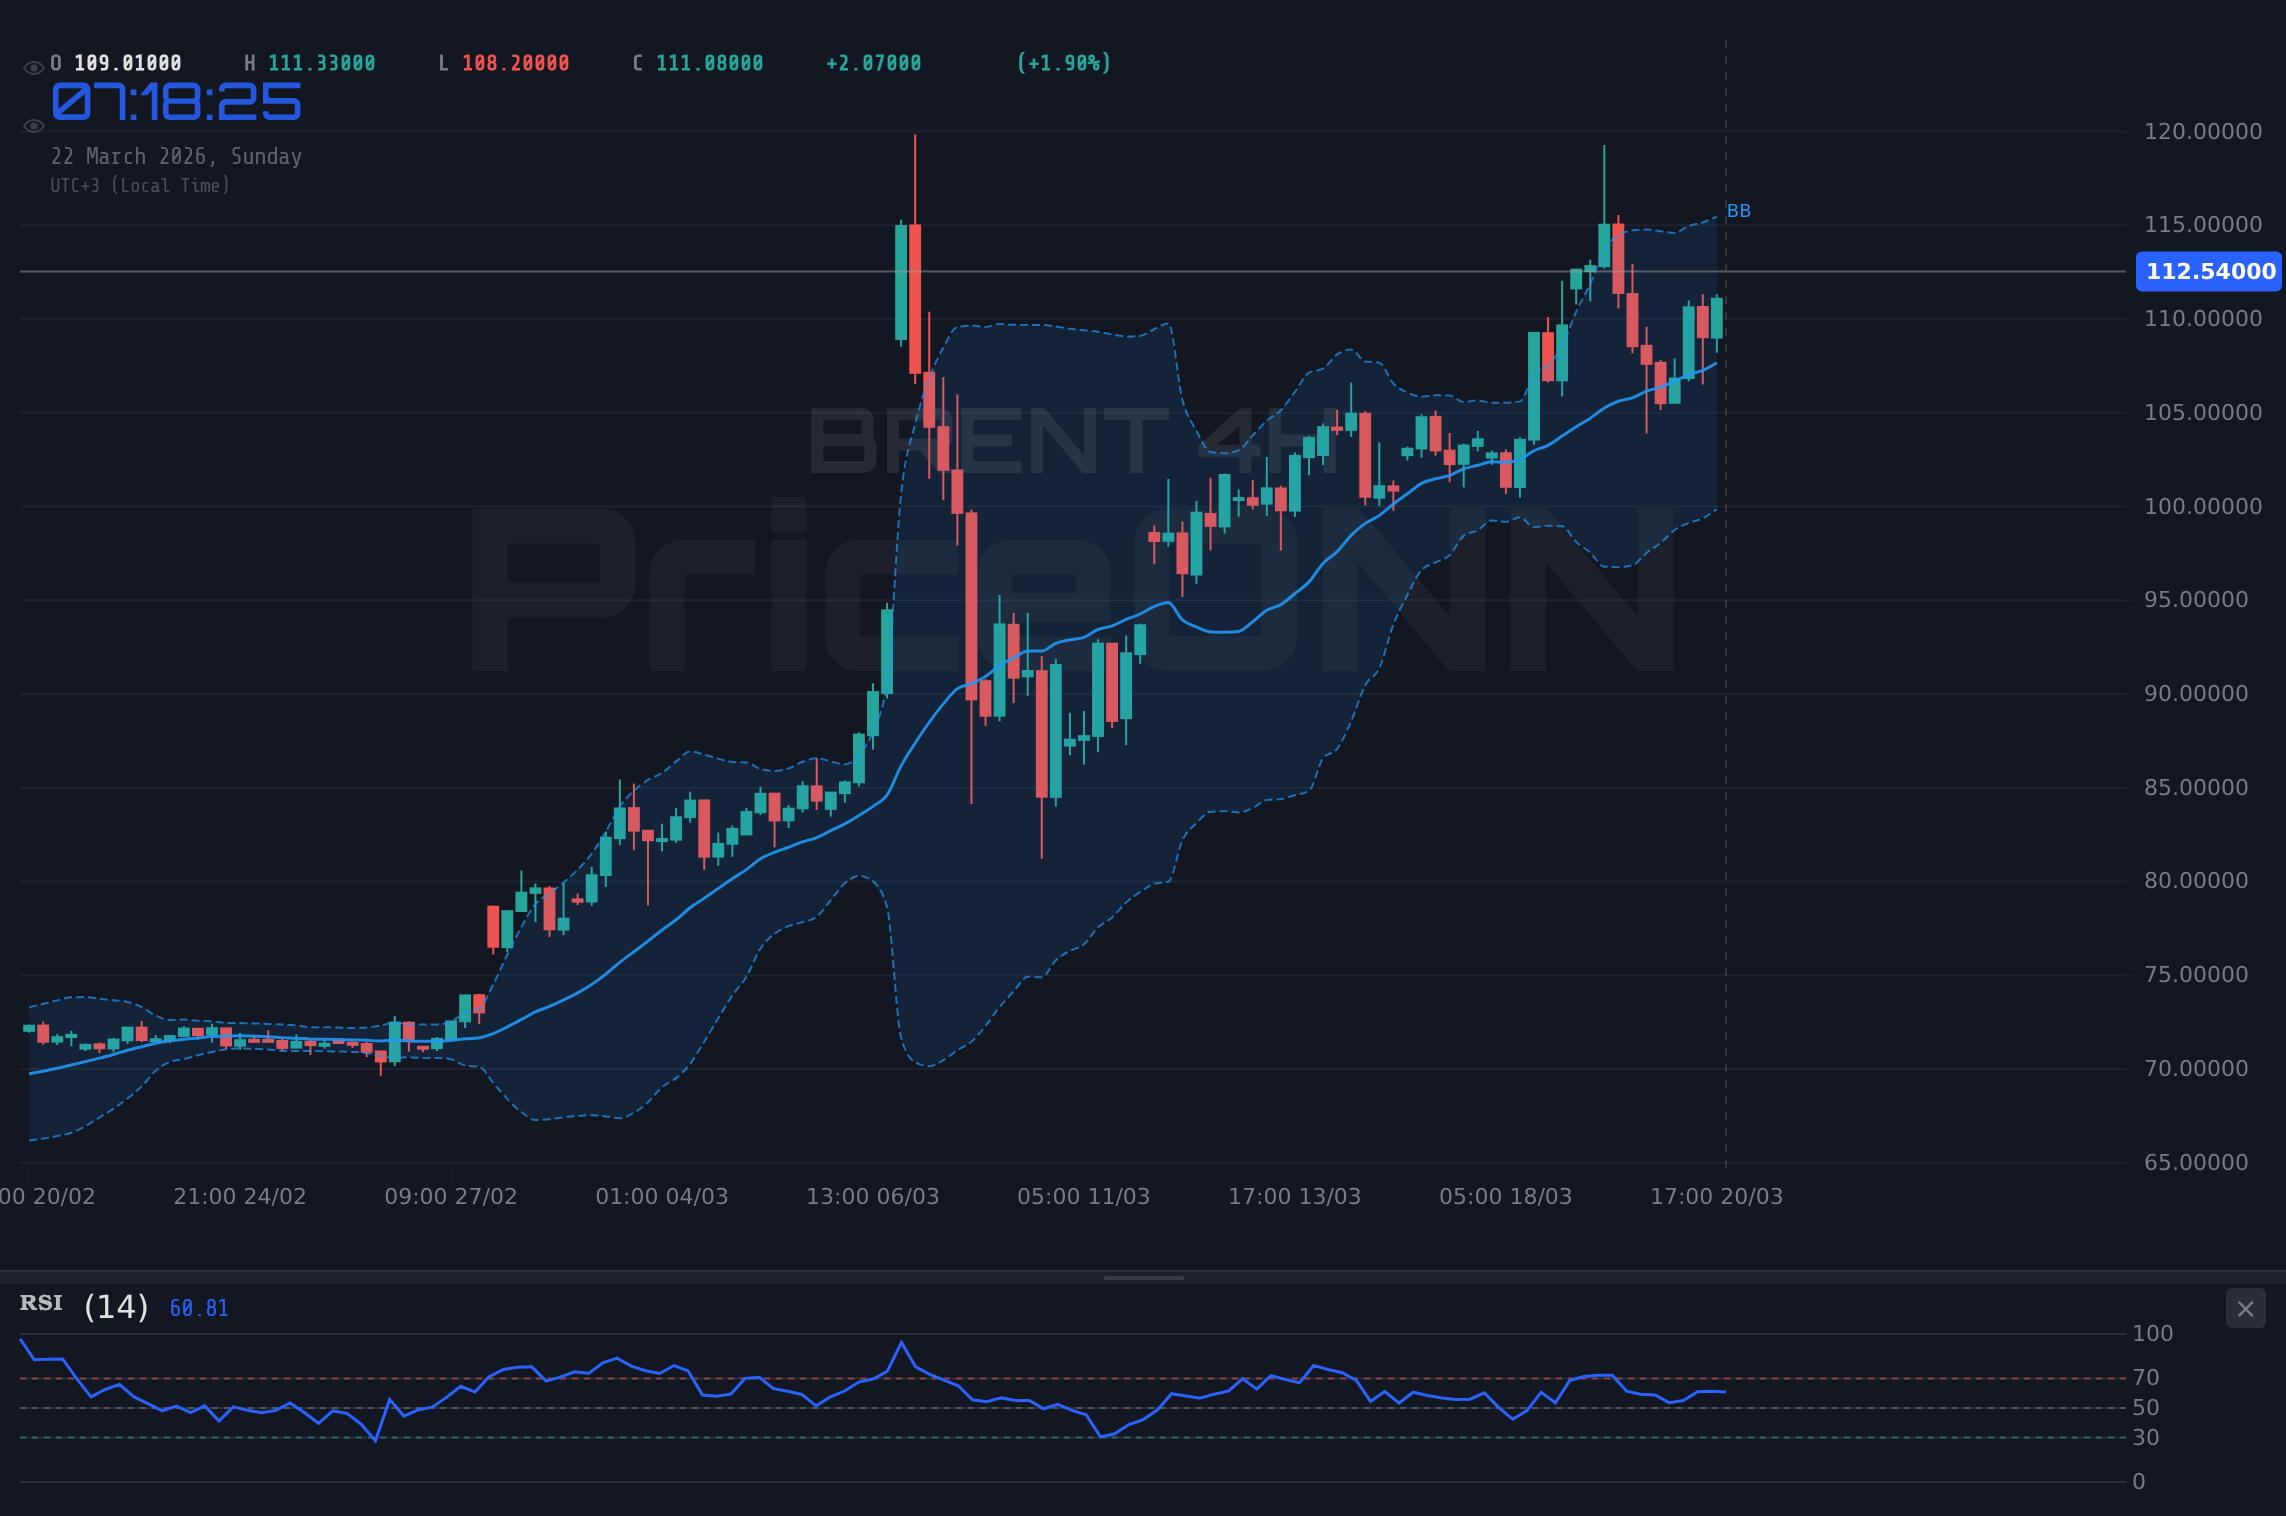
BRENT Crude Oil is currently navigating a critical juncture, trading around the $112.54 mark. This past week saw significant price action, with BRENT testing both higher highs and lower lows, reflecting underlying tensions in the market. The commodity experienced a notable surge, with its daily range spanning from $105.15 to $113.22, ultimately closing Friday at $112.54. This price point is crucial, sitting just below the upper Bollinger Band on the 1-hour chart and within the broader upward trend observed on the daily timeframe. The market is at an inflection point, with geopolitical events and fundamental supply/demand dynamics creating a complex picture for traders and investors alike. Understanding the interplay between these factors is key to deciphering BRENT's next move.
- BRENT Crude Oil is trading around $112.54, showing a strong upward trend on the daily chart (ADX: 65.23) but facing mixed signals on shorter timeframes.
- Critical resistance is noted at $113.78 (4H) and $116.63 (1D), while key support lies at $111.06 (1H) and $106.58 (4H).
- The RSI(14) on the daily chart is at 82.44, indicating extreme overbought conditions and a potential for a pullback, despite the strong uptrend.
- Geopolitical tensions in the Middle East, particularly concerning Qatar's Ras Laffan energy hub and Iran, are key drivers, alongside global AI energy demand and a potential pivot back to nuclear power.
The Bull's Roadmap: Driving Towards Higher Ground
For the bulls to maintain control and push BRENT Crude Oil higher, several technical and fundamental conditions need to align. The prevailing uptrend on the daily chart, evidenced by a very strong ADX reading of 65.23, provides a solid foundation. However, shorter-term indicators are flashing caution. On the 1-hour chart, the RSI(14) at 61.07 suggests room for upward momentum, and the MACD is showing positive momentum with the MACD line above its signal line. Stochastic K line at 93.51 is deep in overbought territory, hinting at a potential short-term pause or retracement. This is where the narrative gets interesting: if the bulls can overcome the immediate overbought signals and push through the near-term resistance levels, the path higher could be rapid.
The immediate hurdle for the bulls lies at the $114.02 level on the 1-hour chart. A decisive break and hold above this point would signal continued strength, potentially targeting the $115.10 resistance. Beyond that, the $116.98 level on the 1-hour chart becomes the next significant objective. On the 4-hour timeframe, resistance is seen at $111.40, $113.78, and $116.22. A sustained move above $113.78 would be a strong bullish confirmation, clearing the path towards the $116.22 level and potentially further. The daily resistance levels at $116.63, $125.65, and $132.02 represent longer-term targets, but achieving these hinges on sustained geopolitical supply disruptions and robust global demand.
Fundamentally, a bullish scenario would be amplified by escalating geopolitical tensions in the Middle East. Recent news of an attack on Qatar's Ras Laffan energy hub, potentially ending the era of gas abundance and shifting the narrative away from an LNG glut, could add significant upward pressure on all energy commodities, including BRENT. If this situation further constricts supply or raises fears of broader conflict, crude prices could easily extend their rally. Furthermore, the insatiable energy demand from the AI boom, as highlighted by the increasing consumption of data centers, could continue to underpin global energy demand, providing a steady bid under BRENT. A clear pivot back to nuclear power by nations, while a long-term factor, might temper some demand, but the immediate supply-side risks from geopolitical instability currently outweigh demand-side considerations.
The confluence of a strong daily uptrend, positive short-term momentum signals on the 1-hour chart, and escalating geopolitical supply risks creates a plausible path for BRENT to continue its ascent. The key for bulls is to manage the immediate overbought conditions indicated by the Stochastic oscillator and to secure decisive breaks above near-term resistance levels. A sustained move above $113.78 on the 4-hour chart, supported by ongoing supply concerns and robust demand, could see prices retesting the $116-$117 region within the next week. The 1D chart shows significant room for upside if the trend continues, with targets extending to $125.65 and beyond, though this would require a significant escalation of supply-side shocks.
Where Bears Take Control: The Risk of a Pullback
Despite the dominant daily uptrend, the technical picture presents several warning signs that could lead to a bearish correction for BRENT Crude Oil. The most glaring is the RSI(14) on the daily chart, which has soared to 82.44. Readings above 70 are typically considered overbought, and a value this high suggests that the market is due for a significant pullback or consolidation. While strong trends can sometimes sustain high RSI levels for extended periods, the risk of a sharp reversal increases with each passing day above 80. The Stochastic oscillator on the 1-hour chart is also deeply overbought at 93.51, further reinforcing the idea that a short-term reversal is a distinct possibility.
For the bears to gain traction, BRENT needs to break decisively below key support levels. On the 1-hour chart, the first line of defense is at $111.06. A close below this level would signal a potential shift in short-term momentum and could open the door for a move towards the $109.18 support. Further down, the $108.10 level represents a more significant support zone. On the 4-hour timeframe, the critical support level to watch is $106.58. A break below this level would invalidate the current bullish structure on this timeframe and could trigger a more substantial sell-off, targeting the $104.14 and $101.76 supports. The daily support levels at $101.24, $94.87, and $85.85 represent more significant downside targets, but reaching these would require a fundamental shift in market conditions.
Fundamentally, a bearish case for BRENT would likely be driven by a de-escalation of geopolitical tensions in the Middle East, or by signs of weakening global demand. If diplomatic efforts successfully ease concerns around supply disruptions originating from the Qatar attack or other regional conflicts, the risk premium currently embedded in oil prices could rapidly dissipate. Additionally, any significant slowdown in global economic activity, particularly impacting major energy consumers like China or the US, could dampen demand expectations. While the AI boom is currently a bullish factor for energy demand, a broader economic downturn could easily overshadow this. Furthermore, positive news regarding increased oil production, such as the record lease sale in Alaska's National Petroleum Reserve ($163.7 million), although currently a minor factor, could add to supply-side sentiment if it translates into tangible output increases. The narrative of nations pivoting back to nuclear power, if it accelerates, could also eventually reduce reliance on fossil fuels.
The current technical setup, with the daily RSI deeply overbought and shorter-term oscillators flashing exhaustion, suggests that a correction is not only possible but perhaps probable. The key trigger for a bearish move would be a failure to hold the $111.06 support on the 1-hour chart, followed by a break below the $106.58 level on the 4-hour chart. If these levels give way, we could see a swift move lower, potentially revisiting the $104-$105 area within the coming days. A deeper correction targeting the $100 psychological level would require a more significant catalyst, such as a clear de-escalation of Middle East tensions or concrete signs of a global economic slowdown.
The Waiting Game: Caught in a Consolidation Phase
While both bullish and bearish scenarios present compelling arguments, it's also possible that BRENT Crude Oil enters a consolidation phase, trading within a defined range. This often occurs when conflicting signals create indecision in the market, or when participants await clearer fundamental catalysts. On the daily timeframe, the ADX is a robust 65.23, indicating a strong trend is in place, which typically argues against prolonged consolidation. However, the conflicting signals from shorter timeframes, particularly the overbought RSI on the daily and Stochastic on the hourly, could lead to a temporary stalemate. In such a scenario, price action might become choppy, with sharp moves in either direction failing to sustain momentum.
A neutral range-bound scenario would likely see BRENT oscillating between its immediate support and resistance levels. On the 1-hour chart, this would mean trading between $111.06 and $114.02. On the 4-hour chart, the range could be wider, perhaps between $106.58 and $113.78. Within such a range, volatility might remain elevated due to the underlying geopolitical and fundamental drivers, but the net price movement would be minimal. This phase could be characterized by failed breakouts in either direction, with price repeatedly testing the boundaries of the range before eventually breaking out. This 'waiting game' often precedes a more significant move, as underlying pressures build up.
From a fundamental perspective, a consolidation phase might occur if the market digests recent news and awaits further developments. For instance, if the geopolitical situation in the Middle East stabilizes slightly, but demand concerns remain on the horizon, this could lead to a temporary equilibrium. Traders might hold off on taking significant positions until there is more clarity on future supply disruptions or demand trends. The ongoing debate about AI's energy consumption versus the potential for a global economic slowdown could also contribute to this indecision. The market might be pricing in current risks but is hesitant to price in further escalation or de-escalation without concrete new information.
The technical indicators could also reflect this indecision. While the daily trend remains strong, shorter-term indicators might oscillate around neutral levels, or show conflicting signals, as seen with the Stochastic K and D lines on the 4-hour chart. If BRENT fails to decisively break above $114.02 (1H resistance) or falls back below $111.06 (1H support) after an initial move, it could signal a period of range-bound trading. This phase could last for several trading sessions, characterized by volatility but limited net progress, until a new fundamental catalyst or a decisive technical breakout emerges to set a clear direction.
The Most Likely Path: A Probabilistic Outlook
Weighing the evidence from technical indicators, fundamental drivers, and recent market action, the most probable scenario for BRENT Crude Oil in the near to medium term leans towards continued bullish momentum, albeit with a heightened risk of consolidation or short-term pullbacks. The daily chart remains strongly bullish, with an ADX of 65.23 and RSI at 82.44 suggesting that while overbought, the trend is exceptionally strong. Historically, such strong trends can persist, with pullbacks acting as opportunities for further upside rather than reversals.
The fundamental backdrop heavily favors higher prices. Escalating geopolitical tensions in the Middle East, particularly the implications of the Ras Laffan incident for LNG supply and broader energy stability, inject a significant risk premium into the market. This supply-side risk is compounded by robust demand factors, including the insatiable appetite for energy from the AI revolution and potential strategic shifts back towards nuclear power, which could indirectly support oil prices by tightening the overall energy market. These factors create a strong base for prices to remain elevated, and potentially move higher, as long as supply-side risks persist.
Therefore, I assign a 60% probability to the bullish scenario continuing, with the caveat that short-term consolidation or pullbacks are likely. The risk of a significant bearish reversal, while present due to the extreme daily RSI, is lower (estimated at 25% probability) unless geopolitical tensions dramatically de-escalate or global demand falters unexpectedly. A neutral, range-bound scenario is also possible in the short term as the market digests current information, carrying an estimated 15% probability. The key is that even within a bullish trend, periods of consolidation are normal, especially when indicators reach extreme levels.
The bullish thesis remains intact as long as key support levels hold and geopolitical risks continue to underpin supply concerns. The market's reaction to the $111.06 support on the 1-hour chart and the $106.58 level on the 4-hour chart will be crucial in determining whether the trend continues or if a deeper correction is imminent. Given the strength of the daily trend and the underlying fundamental drivers, the path of least resistance still appears to be upwards, but traders must remain vigilant for signs of exhaustion or shifts in the geopolitical landscape.
What I'm Watching: Key Triggers for BRENT
As we look ahead to the coming week, several key triggers will dictate the direction of BRENT Crude Oil. The market's reaction to these events and levels will be paramount for traders seeking to navigate this volatile landscape. My focus will be on the following:
Bullish Scenario: Sustained Rally
60% ProbabilityNeutral Scenario: Range-Bound Trading
15% ProbabilityBearish Scenario: Significant Pullback
25% ProbabilityFirstly, I'll be closely monitoring the price action around the $111.06 support level on the 1-hour chart. A failure to hold this level could quickly invalidate the bullish outlook and signal a move towards the $106.58 support on the 4-hour chart. Secondly, the geopolitical narrative remains a critical factor. Any significant de-escalation in the Middle East or positive news regarding global supply increases could trigger a sharp sell-off. Conversely, any further escalation or confirmation of supply constraints could fuel another leg higher.
Finally, I’ll be watching the economic calendar for key demand-side indicators. While supply risks are currently dominant, a significant slowdown in global growth, indicated by weak PMI or GDP figures, could eventually shift the market's focus. The upcoming economic data releases will provide crucial context for whether the current bullish trend has fundamental backing for continuation. Patience and disciplined risk management will be essential as BRENT navigates these complex market conditions.
Frequently Asked Questions: BRENT Analysis
What happens if BRENT Crude Oil breaks above $114.02 resistance this week?
A decisive break and hold above $114.02 on the 1-hour chart would likely confirm the continuation of the bullish trend. This could trigger further upside momentum, targeting the $115.10 level, and potentially extending towards the $116.63 daily resistance. This scenario is supported by ongoing geopolitical supply concerns.
Is RSI at 82.44 a sell signal for BRENT Crude Oil right now?
An RSI reading of 82.44 on the daily chart indicates extreme overbought conditions, which historically suggests a pullback is likely. While it doesn't guarantee an immediate sell-off in a strong uptrend, it significantly increases the probability of a short-term correction or consolidation phase as bulls may look to take profits.
How will the ongoing Middle East tensions affect BRENT Crude Oil prices this week?
The escalating tensions, particularly the incident at Qatar's Ras Laffan energy hub, are a primary driver supporting BRENT prices by injecting a risk premium into the market due to supply disruption fears. Continued or increased instability would likely sustain upward pressure on oil prices, while de-escalation could lead to a rapid unwinding of this premium.
Should I consider buying BRENT Crude Oil at current levels around $112.54?
Buying at current levels carries risk due to the overbought daily RSI and near-term resistance. A more prudent approach might be to wait for a pullback to key support levels like $111.06 or $106.58, or confirmation of a breakout above $114.02, to improve the risk-reward ratio.
| Indicator | Value | Signal | Interpretation |
|---|---|---|---|
| RSI (14) | 82.44 | Overbought | Daily RSI indicates extreme buying pressure; potential for pullback. |
| MACD Histogram | +3.85 | Bullish Momentum | Positive momentum continues on 1H chart, but watch for divergence. |
| Stochastic | K:93.51, D:72.44 | Overbought | Hourly Stochastic deep in overbought territory, signalling potential reversal. |
| ADX | 65.23 | Strong Trend | Very strong trend strength on daily chart indicates sustained directional move. |
| Bollinger Bands | Upper Band | Testing Upper Band | Price is pushing against the upper band, indicating potential for continuation or reversal. |
Track markets in real-time
AI-powered analysis, technical indicators and real-time price data.
Join Our Telegram Channel
Breaking market news, AI analysis and trading signals instantly.
Join Channel