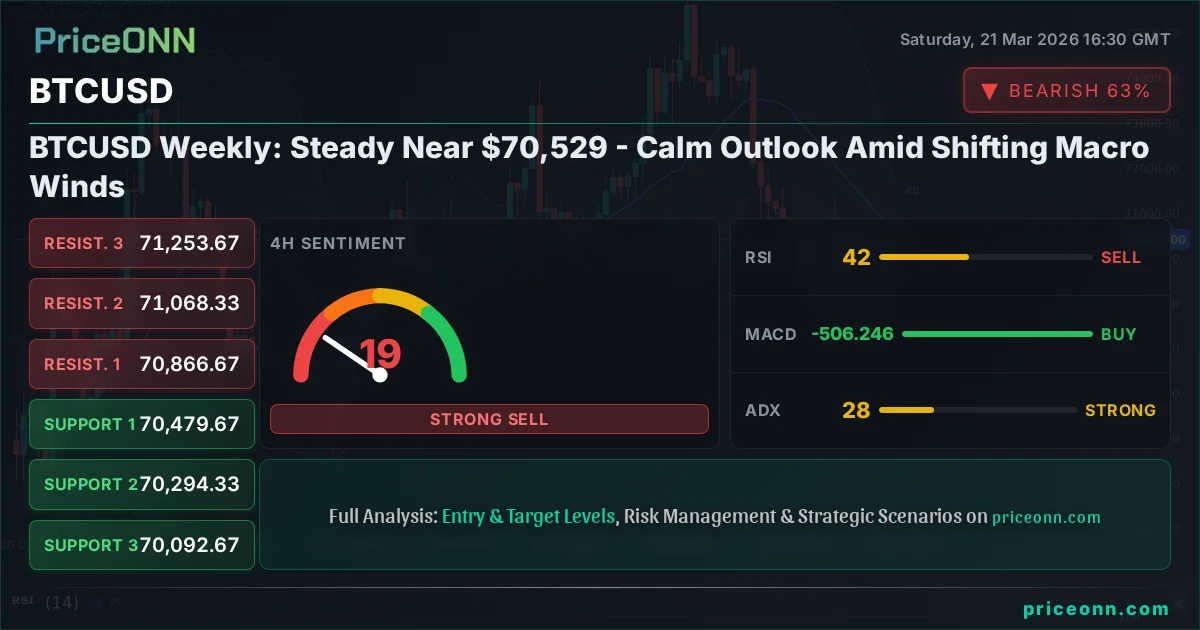
BTCUSD Weekly: Steady Near $70,529 - Calm Outlook Amid Shifting Macro Winds
BTCUSD holds near $70,529 as traders digest macro shifts. Analysis of key levels and upcoming events suggests a period of consolidation before the next major move.
The financial markets are in a perpetual state of flux, and this past week was no exception. While the broader equity markets, particularly the S&P 500 and Nasdaq, experienced significant pullbacks, Bitcoin (BTCUSD) managed to maintain a remarkably steady position, hovering around the $70,529 mark. This resilience, especially in the face of a strengthening US Dollar Index (DXY) and rising Treasury yields, warrants a closer look at the underlying drivers and technical nuances shaping the cryptocurrency's near-term outlook. The past seven days have been a masterclass in market correlation and divergence, offering valuable insights for traders navigating this complex landscape.
- BTCUSD held steady around $70,529 despite broader market downturns and a rising DXY.
- Critical support for BTCUSD sits at $70,092.67 on the 4H chart, tested multiple times this week.
- The MACD histogram shows divergence on the 4H chart, suggesting weakening bullish momentum.
- Fed rate hike expectations are influencing BTCUSD's correlation with DXY, creating a complex interplay of factors.
Navigating the Macro Crosscurrents
This past week saw a notable shift in market sentiment, driven primarily by evolving macroeconomic narratives and renewed geopolitical concerns. The US Dollar Index (DXY) staged a comeback, climbing to levels not seen in some time. This strengthening dollar, often a headwind for risk assets like Bitcoin, presented a challenging environment. The DXY's upward trajectory, reaching 99.39, suggests a renewed demand for safe-haven assets, a sentiment seemingly at odds with Bitcoin's typical risk-on profile. However, the cryptocurrency's ability to hold its ground around $70,529 indicates a degree of underlying strength or perhaps a different set of demand drivers at play.
The correlation between Bitcoin and traditional risk assets, like the S&P 500, has been a hot topic. This past week, the S&P 500 saw a significant decline of 1.21%, closing around 6536.05. Similarly, the Nasdaq experienced an even sharper fall of 1.65%, ending the week near 23992.13. This broad-based sell-off in equities typically signals a 'risk-off' sentiment across markets. Historically, such environments have seen capital flow away from riskier assets towards perceived safer havens. While gold and silver prices have also experienced sharp declines (XAUUSD down 3.28% to $4,497.65, XAGUSD down 6.67% to $67.90), Bitcoin's relative stability around its current price point is noteworthy. This divergence suggests that while macro headwinds are present, specific demand for Bitcoin might be counteracting some of the broader market pressures.
One of the key factors influencing market dynamics has been the shifting expectations surrounding central bank policies, particularly the US Federal Reserve. While the Fed has maintained a steady interest rate stance, forward guidance and economic data releases are constantly re-pricing potential future actions. Any hint of a more hawkish stance, driven by persistent inflation or a robust labor market, can strengthen the dollar and pressure risk assets. Conversely, signs of economic cooling could lead to expectations of future rate cuts, potentially benefiting assets like Bitcoin. The interplay between inflation data, employment figures, and Fed commentary continues to be a critical narrative shaping market expectations and, consequently, asset prices.
BTCUSD Weekly Price Action: Resilience Near $70,529
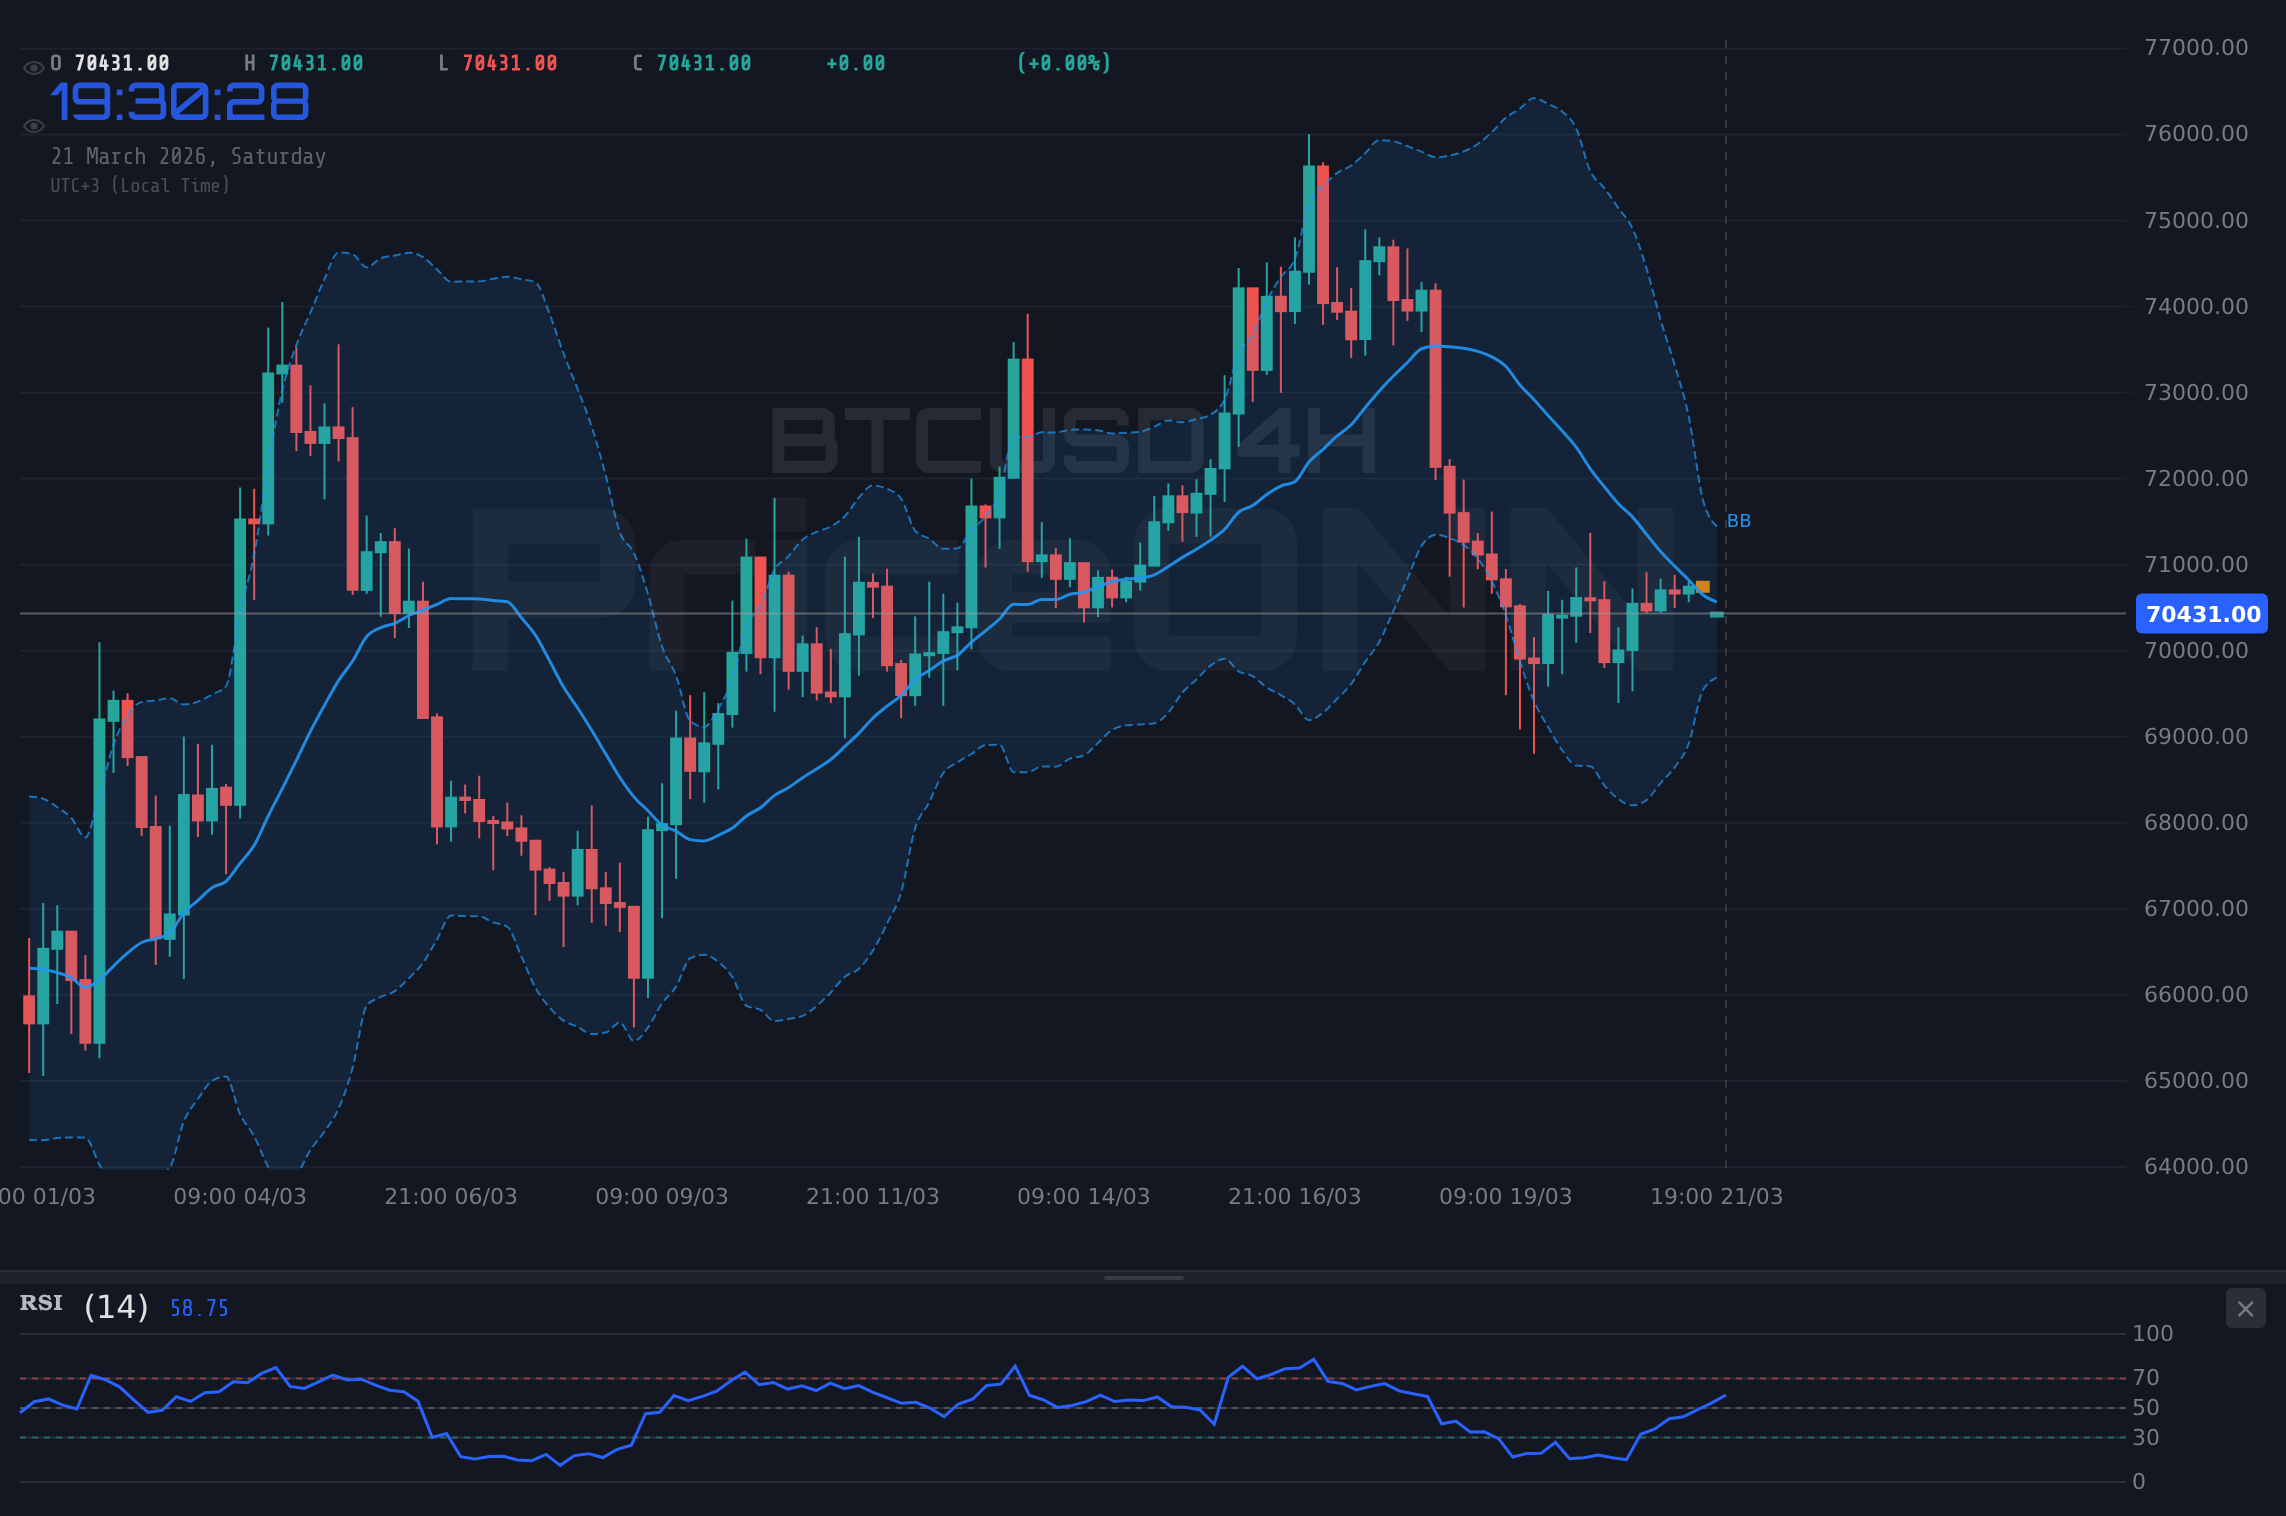
Looking at the price action for BTCUSD over the past week, the $70,529 level has acted as a crucial pivot. While the cryptocurrency briefly touched lower levels, notably dipping towards the $70,092.67 support on the 4-hour timeframe, it consistently found buying interest. This ability to defend key support levels, especially when broader risk assets are selling off, is a testament to the persistent demand in the Bitcoin market. The daily trading range for BTCUSD was between $70,433 and $71,104, indicating a period of consolidation rather than outright directional movement. This trading range suggests that market participants are digesting recent macroeconomic news and awaiting clearer signals before committing to a significant new trend.
On the 1-hour timeframe, BTCUSD showed a neutral trend with a power of 50%, oscillating around $70,529. The immediate resistance was observed at $70,959, a level that capped several upside attempts. Below, support was found at $70,450. The RSI(14) on this timeframe was hovering around 49.04, indicating a neutral stance with a slight bearish inclination, while the MACD was showing negative momentum, with the MACD line below its signal line. This suggests that while the price remained stable, the short-term momentum was not strongly bullish, hinting at potential consolidation.
The 4-hour chart, however, painted a slightly different picture. While the trend was also neutral (50% power), the price tested the support at $70,092.67 multiple times. The RSI(14) here was at 43.09, leaning bearish, and crucially, the MACD was showing positive momentum with the MACD line above its signal line. This divergence between the RSI and MACD on the 4-hour chart is interesting. It suggests that while the short-term momentum might be shifting upwards, the underlying trend strength, as indicated by the RSI, was not fully supportive. The ADX at 28.03 indicated a strong downward trend, which contradicts the MACD's positive signal, highlighting a tug-of-war in the market.
The daily timeframe analysis for BTCUSD revealed a bullish trend with a power of 81%, with the price hovering around $70,529. This suggests that the longer-term outlook remained positive, despite the short-term consolidation and the bearish signals on lower timeframes. The daily support was identified at $69,502, a level that has been instrumental in holding the price higher. Resistance was seen at $71,477. The RSI(14) was at 49.56, neutral but leaning bearish, while the MACD was positive. The Stochastic indicator, however, showed a bearish signal with %K at 23.54 and %D at 56.73, indicating a potential for a pullback from current levels. This conflicting picture across different timeframes underscores the current indecisive phase for Bitcoin.
The Role of Key Technical Indicators
Examining the technical indicators provides further depth to Bitcoin's current market position. On the 1-hour chart, the Stochastic Oscillator was showing a bearish signal with %K at 32.35 and %D at 44.49. This suggests that the cryptocurrency might be entering an oversold condition or that the upward momentum is fading. The ADX on this timeframe was a low 11.35, indicating a very weak trend, which aligns with the consolidation observed around $70,529. This lack of trend strength means that any price movement could be easily reversed, making breakout confirmation crucial.
The 4-hour timeframe presented a more complex picture. The Stochastic Oscillator here showed a bullish signal with %K at 62.72 and %D at 59.06, suggesting potential for upward movement. However, the MACD histogram was showing negative momentum, and the RSI(14) was at 43.09, leaning bearish. This conflict between the Stochastic and other indicators highlights the choppiness in the mid-term outlook. The ADX at 28.03 still pointed towards a strong downward trend, which is unusual given the other signals. This contradiction implies that the market is not in a clear directional phase, and traders should be cautious about chasing short-term signals without further confirmation.
On the daily chart, the Stochastic Oscillator was firmly in bearish territory with %K at 23.54 and %D at 56.73. This is a significant oversold reading, often preceding a bounce. However, the RSI(14) at 49.56 remained neutral, and the MACD showed positive momentum. The ADX on the daily chart was at 22.75, indicating a moderately strong upward trend. This combination of signals suggests that while the longer-term trend is bullish, there might be short-term weakness or consolidation ahead before the trend can resume with conviction. The market seems to be at an inflection point, where longer-term bullishness is being tested by short-term bearish pressures and macroeconomic uncertainties.
The Bollinger Bands offer another perspective. On the 1-hour chart, BTCUSD was trading below the middle band, indicating a bearish bias in the short term. The 4-hour chart showed the price below the middle band as well, reinforcing the idea of a short-term downtrend or consolidation. However, on the daily chart, BTCUSD was trading above the middle band, aligning with the bullish long-term trend. The bands themselves are widening slightly on the daily chart, which can sometimes precede a significant price move, but the lack of clear direction across all timeframes suggests this is currently a period of price discovery rather than a confirmed breakout.
Geopolitical Ripples and Their Impact
The global geopolitical landscape continues to be a significant wildcard for financial markets, and Bitcoin is not immune to these influences. Recent escalations in global tensions, particularly concerning the Middle East and potential flashpoints, have historically driven demand for safe-haven assets. While gold and silver experienced sharp sell-offs despite these tensions - a move some analysts attribute to the strengthening dollar and technical breakdowns - the impact on Bitcoin is more nuanced. Sometimes, Bitcoin acts as a risk-on asset, falling with equities. Other times, particularly with increasing institutional adoption and its narrative as 'digital gold', it can benefit from safe-haven flows.
The conflicting price action in traditional safe-haven assets like gold and silver, which saw significant drops despite rising geopolitical risks, is a key point of observation. This unusual behavior might suggest that the dominant market force currently is macro-economic policy expectations, particularly from the Federal Reserve, rather than immediate geopolitical fear. However, the potential for these geopolitical events to escalate cannot be ignored. A significant geopolitical shock could rapidly shift market sentiment, leading to a flight to perceived safety, which might include Bitcoin if its 'digital gold' narrative gains more traction.
The energy markets, often sensitive to geopolitical developments, also provide context. Brent crude oil prices saw a substantial rise of 4.81% to $112.79, and WTI followed suit, climbing 3.87% to $98.50. Such spikes in energy prices can fuel inflation concerns, which in turn influence central bank policy. Higher inflation typically leads to expectations of tighter monetary policy (higher interest rates), which can be a headwind for risk assets like Bitcoin. The correlation between energy prices, inflation, and central bank reactions is a critical feedback loop that traders must monitor closely.
Looking Ahead: Key Levels and Events for BTCUSD
As we look towards the coming week, several key levels and events will be crucial for determining the next direction of BTCUSD. The immediate support remains firmly in place around the $70,092.67 - $70,450 zone. A decisive close below $70,000 would likely trigger further downside, potentially targeting the next significant support at $69,502. On the upside, breaking the immediate resistance at $70,959 is the first hurdle. A sustained move above this level, followed by a clear break above $71,477, could signal a resumption of the bullish trend, with higher targets opening up.
The upcoming economic calendar will be closely watched. Key data releases, such as inflation figures (CPI/PCE) and employment reports (NFP), will provide crucial insights into the health of the economy and the potential path of monetary policy. Any surprises in these reports could lead to significant volatility across all asset classes, including Bitcoin. The market's reaction to these data points, especially in conjunction with any developments in geopolitical tensions, will likely dictate the short-to-medium term trajectory of BTCUSD.
The correlation with the DXY will also remain a key factor. If the dollar continues its upward trend, it could exert persistent pressure on Bitcoin. Conversely, any sign of dollar weakness or a shift in Fed policy expectations could provide a tailwind for BTCUSD. Traders will be looking for confirmation of a trend break, either to the upside above $71,477 or to the downside below $70,000, to guide their positions. Until then, expect continued choppiness and range-bound trading as the market weighs conflicting signals.
Scenario Analysis for BTCUSD
Bearish Scenario: Consolidation Below $70K
65% ProbabilityNeutral Scenario: Range-Bound Action
25% ProbabilityBullish Scenario: Resumption of Uptrend
10% ProbabilityFrequently Asked Questions: BTCUSD Analysis
What happens if BTCUSD breaks below the $70,092.67 support level this week?
If BTCUSD closes decisively below the $70,092.67 support on the 4-hour chart, it could trigger further downside, potentially targeting the $69,502 level, which is a key daily support. This breakdown would invalidate the current consolidation and suggest a continuation of the bearish trend observed in some lower timeframes.
Should I consider buying BTCUSD at current levels around $70,529 given the mixed signals?
Given the conflicting signals across different timeframes and the prevailing macroeconomic uncertainty, a cautious approach is advised. While the daily trend remains bullish, short-term indicators suggest consolidation or a potential pullback. Waiting for a clear breakout above $71,477 resistance or a confirmed bounce from the $70,092.67 support offers a higher probability setup.
Is the RSI at 43.09 on the 4H chart a sell signal for BTCUSD?
An RSI reading of 43.09 on the 4-hour chart leans bearish, indicating that momentum might be favoring sellers in the short-to-medium term. However, it is not yet in oversold territory, and its signal should be considered alongside other indicators like the MACD, which shows positive momentum. Confirmation from price action breaking key levels would be more indicative of a trend.
How will the upcoming NFP data release potentially affect BTCUSD this week?
A stronger-than-expected Non-Farm Payrolls (NFP) report could reinforce expectations of a hawkish Federal Reserve, strengthening the US Dollar and potentially pressuring BTCUSD. Conversely, a weaker report might lead to expectations of Fed rate cuts, which could act as a catalyst for a bullish move in Bitcoin. The market's reaction will depend on how the data aligns with or deviates from current expectations.
Technical Outlook Summary
| Indicator | Value | Signal | Interpretation |
|---|---|---|---|
| RSI (14) | 49.56 | Neutral | Neutral territory, leaning bearish. Watch for divergence. |
| MACD Histogram | Positive Momentum | Bullish | Suggests upward momentum, but needs confirmation. |
| Stochastic | K=23.54, D=56.73 | Bearish | Oversold reading on daily, but %K < %D indicates potential for decline. |
| ADX | 22.75 | Bullish Trend | Moderate strength in the upward trend. |
| Bollinger Bands | Above Middle Band | Neutral | Price above middle band indicates a bullish lean on daily. |
Key Levels
Support Levels
Resistance Levels
Track markets in real-time
AI-powered analysis, technical indicators and real-time price data.
Join Our Telegram Channel
Breaking market news, AI analysis and trading signals instantly.
Join Channel