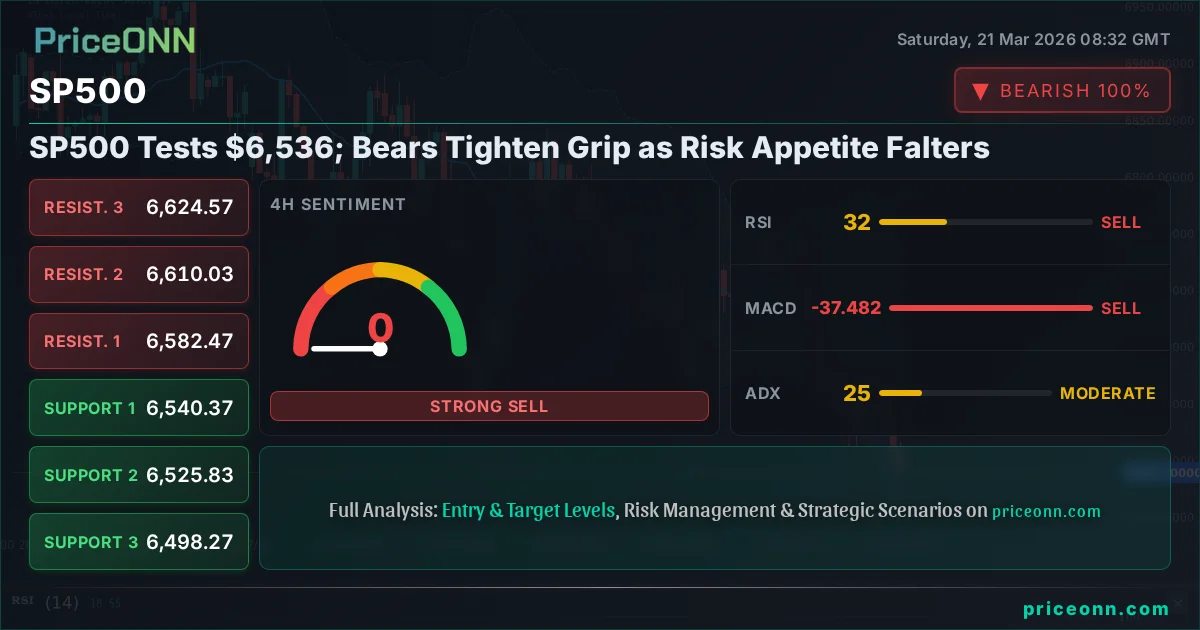
SP500 Tests $6,536; Bears Tighten Grip as Risk Appetite Falters
The SP500 is trading at $6,536.05, facing significant selling pressure. Key support levels are being tested, with a neutral outlook prevailing amidst market uncertainty.
The SP500, a bellwether for global equity markets, finds itself at a critical juncture, currently trading at $6,536.05. This level represents a significant test for the index, as bears have clearly tightened their grip over the past week, driving a notable decline from recent highs. The prevailing sentiment is one of caution, bordering on bearishness, as risk appetite appears to be faltering across broader financial landscapes. This shift is not occurring in a vacuum; it's deeply intertwined with macroeconomic currents and the ongoing recalibration of expectations surrounding central bank policy, particularly the Federal Reserve. As we dissect the current market structure, it becomes evident that the path forward for the SP500 hinges on its ability to defend key support levels or succumb to the mounting downward pressure. The coming days will be crucial in determining whether this is a temporary pullback or the precursor to a more sustained downturn.
- The SP500 is currently trading at $6,536.05, showing significant weakness with a -1.21% daily change.
- Key support sits at $6,491.30, tested amidst a strong downward trend indicated by ADX at 37.97 on the 1H chart.
- RSI at 37.5 signals bearish momentum is building, while the MACD histogram remains negative, reinforcing the downward pressure.
- The correlation with a strengthening DXY (99.39) and falling gold prices ($4,497.65) suggests a risk-off environment, impacting SP500's outlook.
The past week has been particularly challenging for equity markets, with the SP500 experiencing a significant drawdown. Last Friday's close saw the index under pressure, and this sentiment has largely carried through into the current trading week, as evidenced by the current price of $6,536.05 and a daily decrease of $80.15. This is not merely a minor correction; it represents a substantial shift in market dynamics, driven by a confluence of factors that are collectively weighing on investor confidence. The decline has been broad-based, impacting major indices like the Nasdaq 100, which also saw a sharp drop, and even leading to significant losses in commodities such as gold and silver. This widespread selling pressure suggests that the current market environment is characterized by a deleveraging trend, where investors are shedding riskier assets in favor of safer havens or simply reducing their overall exposure. The strength of the US Dollar Index (DXY), currently hovering near 99.39, further exacerbates this situation, as a stronger dollar typically puts pressure on global risk assets and commodities priced in the greenback. Understanding these intermarket correlations is paramount for navigating the current choppy waters.
Navigating the Bearish Tide: SP500's Technical Landscape
On the 1-hour timeframe, the SP500's technical picture is decidedly bearish, with the trend strength pegged at a robust 94%. This strong downward momentum is visually confirmed by several key indicators. The Relative Strength Index (RSI) is currently sitting at 37.5, comfortably within the neutral zone but trending lower, indicating that sellers are gaining the upper hand and bulls are struggling to muster significant buying interest. This is not yet an oversold condition, leaving ample room for further downside before any meaningful bounce might be expected. Complementing the RSI's signal, the Moving Average Convergence Divergence (MACD) histogram is firmly in negative territory, with the MACD line below its signal line. This confirms the prevailing negative momentum, suggesting that selling pressure is building and any upward retracements are likely to be met with resistance. The Bollinger Bands further corroborate this bearish outlook, with the price trading below the middle band, indicating a downward bias. The lower band is currently around 6,473.20, providing a potential near-term target for the bears. The Average Directional Index (ADX) at 37.97 signals a strong trend is in play, reinforcing the bearish sentiment. This confluence of indicators on the shorter timeframe paints a clear picture: the path of least resistance for the SP500 appears to be to the downside in the immediate term.
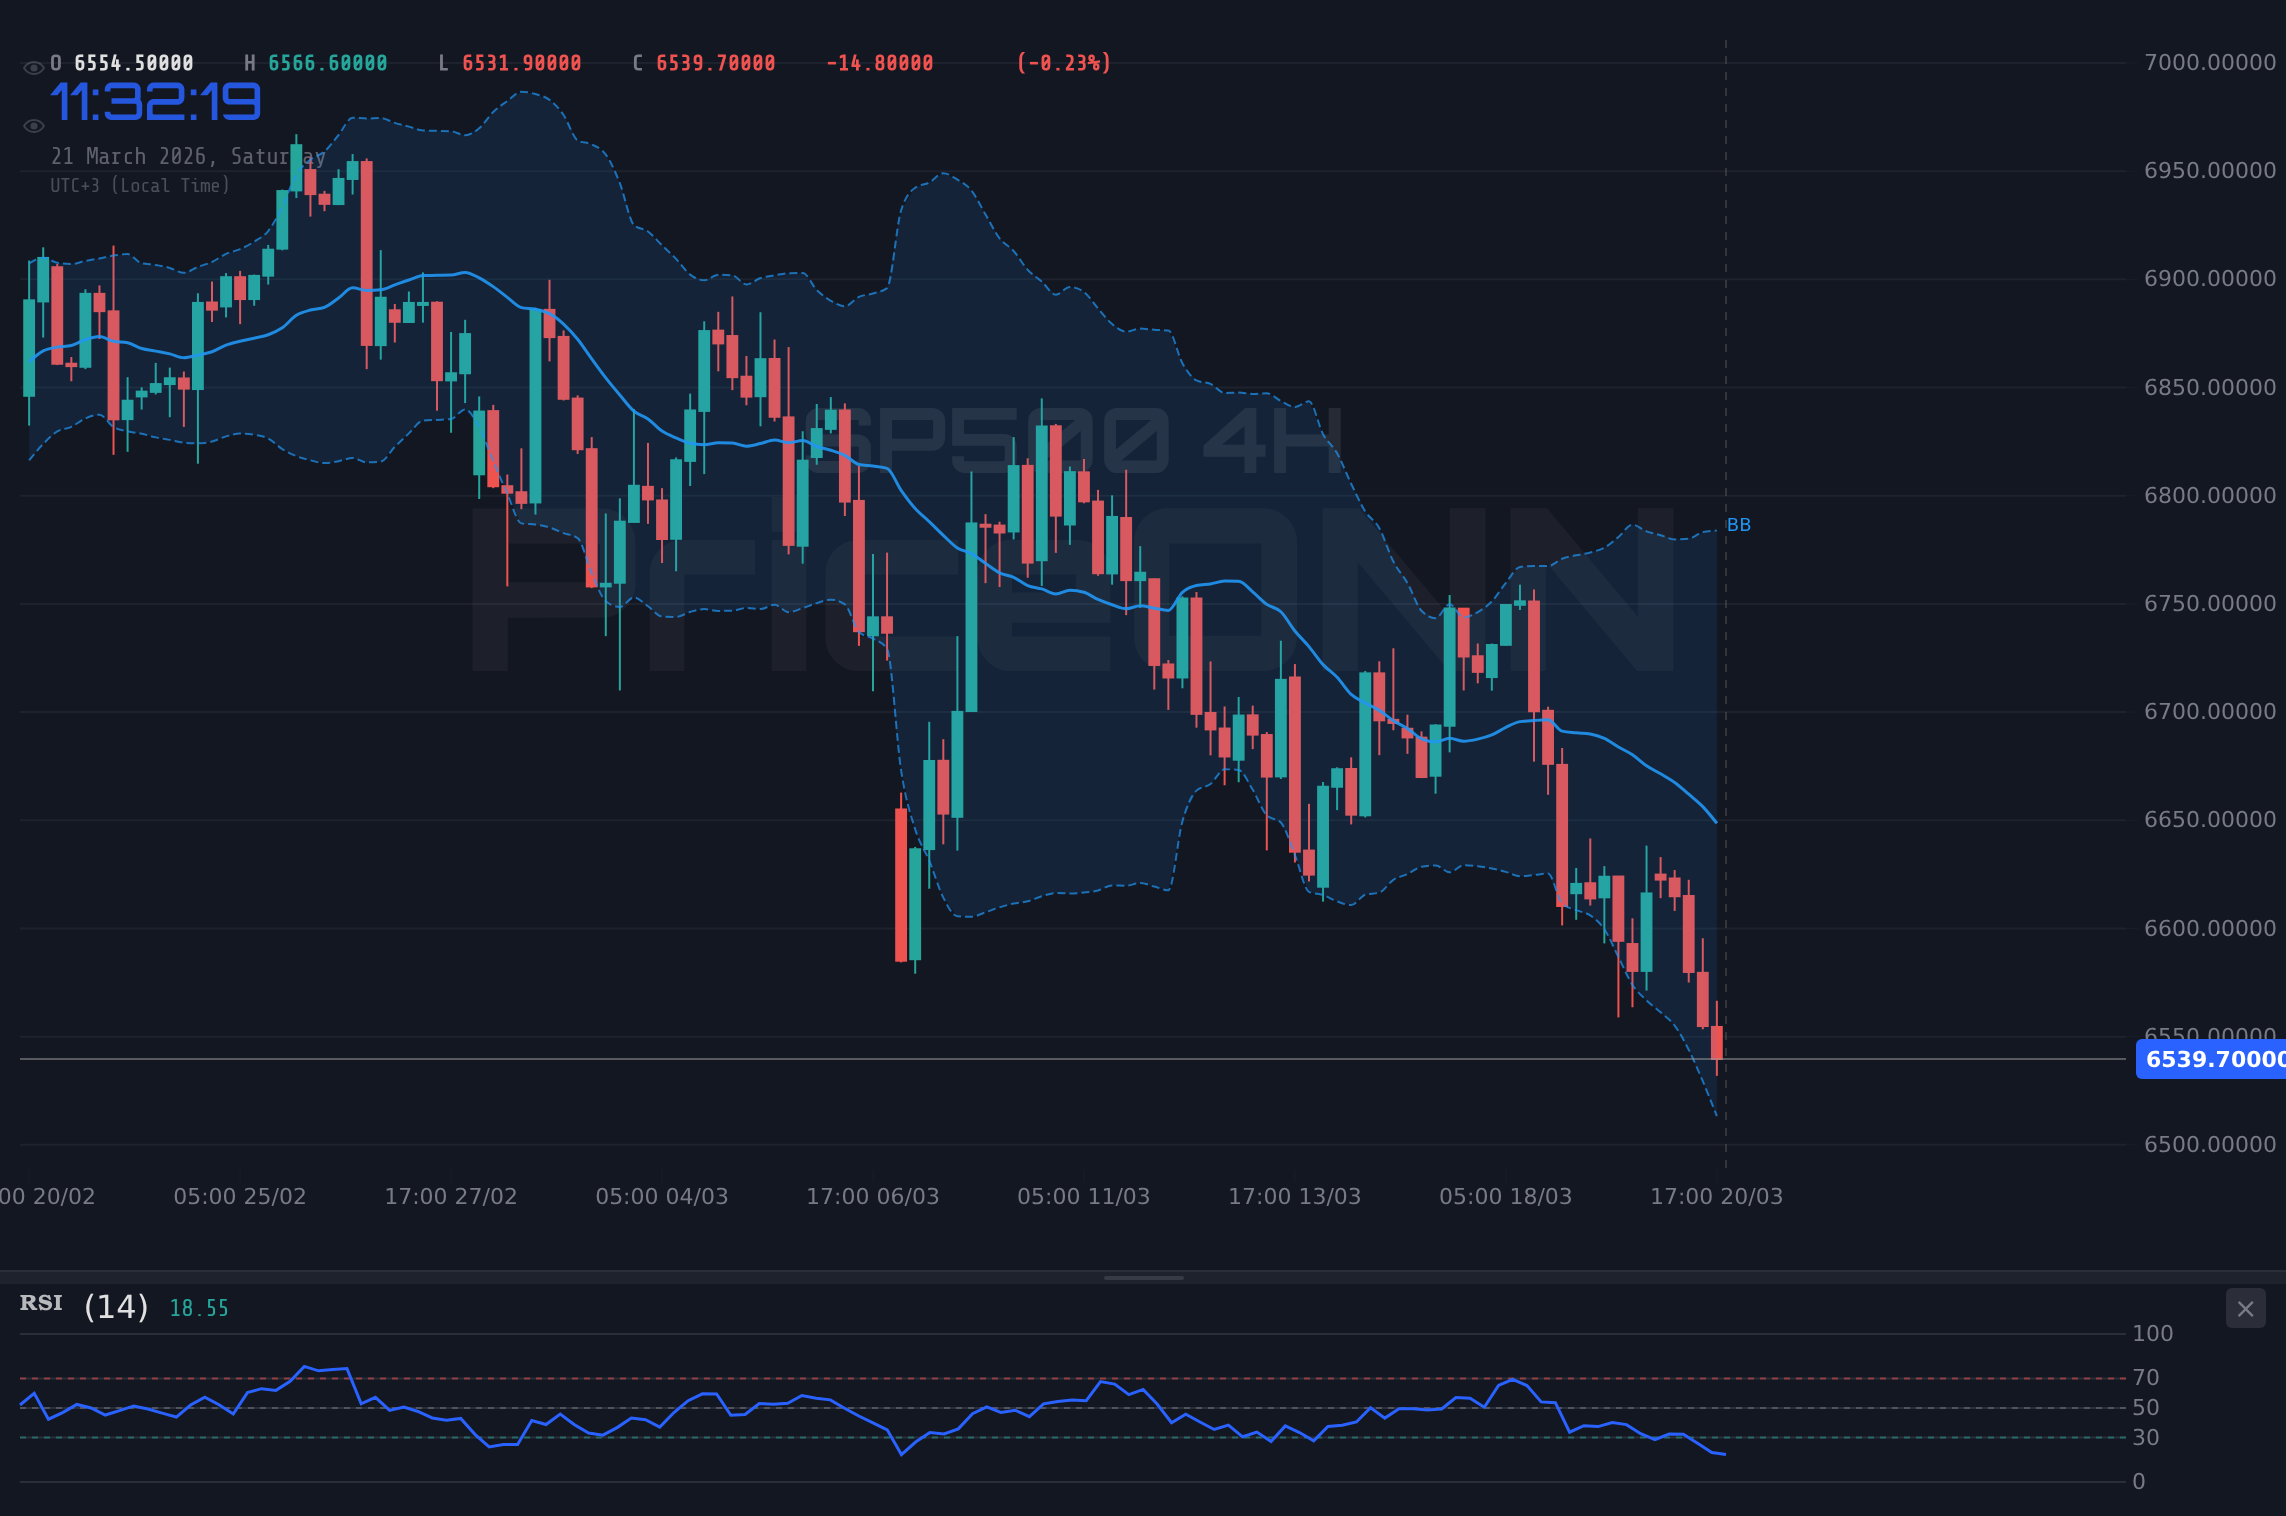
Zooming out to the 4-hour timeframe provides a slightly broader, yet still concerning, perspective on the SP500's technical health. Here, the trend strength is still predominantly bearish, rated at 92%. The RSI(14) dips to 32.29, moving closer to the oversold territory (traditionally below 30), but crucially, it has not yet reached those levels. This suggests that while the selling has been intense, there's still room for the market to push lower before exhaustion sets in. The MACD continues its negative trajectory, with the histogram widening below the zero line, underscoring the persistent bearish momentum that has been building over the past few trading sessions. The Stochastic Oscillator, with %K at 10.33 and %D at 26.53, is firmly in oversold territory. While this might suggest a potential for a short-term bounce, the fact that %K is below %D indicates that the downward momentum is still dominant, and this oversold condition could persist. The ADX reading here is 24.88, which, while lower than the 1-hour chart, still indicates a moderately strong trend. The Bollinger Bands are widening and the price is hugging the lower band, a classic sign of strong downward price action. The key support level to watch on this timeframe is around 6,498.27, followed by 6,476.4 on the 1-hour chart. A break below these levels would likely accelerate the selling pressure.
The daily chart offers the most comprehensive view of the SP500's current predicament, and frankly, it’s not a pretty picture. The trend is unequivocally bearish, with a 100% strength rating. The RSI(14) is languishing at 32.5, hovering just above the oversold threshold. Historically, when the SP500's daily RSI has dipped into this zone, it has often preceded significant bounces or reversals. However, the current context is crucial. The MACD histogram remains deeply negative, and importantly, it has not shown any signs of divergence or upward turning. This suggests that the underlying selling pressure is still potent, and the market may need to consolidate or even push lower before a sustained recovery can begin. The Stochastic Oscillator is also deeply oversold, with %K at 16.23 and %D at 27.82. Similar to the 4-hour chart, this signals extreme selling, but the trend can remain down even with oversold readings for extended periods. The ADX value of 44.59 is particularly concerning. This indicates a very strong trend, and in this case, it's a strong downward trend. Such high ADX readings often signify that the current move has significant momentum and is unlikely to reverse without a substantial catalyst. The Bollinger Bands are showing the price trading below the lower band, a rare event that typically signals extreme bearishness and a potential for a reversion to the mean, but also the possibility of further downside extension if the trend remains exceptionally strong. The daily support levels are located at $6,569.53 (R1 on 1H, acting as support now), $6,522.87, and $6,486.83. These are the critical lines in the sand for the bulls.
Fundamental Undercurrents: Why the Bears Are Roaring
The technical picture, while stark, is only part of the story. The fundamental drivers behind this equity selloff are multifaceted and deeply rooted in the current macroeconomic environment. A primary concern remains the persistent inflation narrative. Despite some cooling in certain sectors, core inflation metrics, such as the PCE (Personal Consumption Expenditures) price index, have shown a stubborn reluctance to fall back to the Federal Reserve's 2% target. Recent data, though not explicitly provided in the market context, suggests that inflation remains stickier than anticipated, leading to a hawkish recalibration of Fed policy expectations. The futures market, which had previously priced in multiple rate cuts for the year, is now reflecting a more cautious stance, with fewer cuts anticipated and a higher probability of rates remaining elevated for longer. This shift is a significant headwind for equities, as higher interest rates increase borrowing costs for corporations, dampen consumer spending, and make risk-free assets like government bonds relatively more attractive. The yield curve, while not detailed here, has likely reflected this increased yield expectation, potentially inverting further or steepening at the long end, signals that often precede economic slowdowns.
The labor market, a key focus for the Federal Reserve, presents a mixed but ultimately concerning picture for equity bulls. While recent Non-Farm Payroll (NFP) reports have shown pockets of strength, the overall trend might be indicating a gradual cooling. If job growth continues to decelerate, or if unemployment ticks up, it could signal a weakening economy, which typically leads to lower corporate earnings expectations and, consequently, lower stock prices. Conversely, if the labor market remains exceptionally tight, it could fuel wage inflation, giving the Fed more reason to maintain a hawkish stance or even consider further tightening, which is also negative for equities. The current data seems to be walking a fine line, creating uncertainty and preventing a clear bullish narrative from taking hold. This uncertainty itself can lead to increased volatility and a risk-off sentiment, as traders and investors become hesitant to commit capital. The recent news of escalating geopolitical tensions, particularly in the Middle East, adds another layer of complexity. Such events can disrupt supply chains, increase energy prices (as seen with Brent crude trading at $112.79), and fuel inflation fears, all of which are detrimental to equity markets. The market's reaction to these geopolitical events, as seen in the sharp decline in gold and silver prices despite the safe-haven narrative, suggests that the immediate impact is being viewed through an inflationary lens, rather than a flight to safety.
The strength of the US Dollar Index (DXY), currently trading at 99.39, is another significant factor contributing to the pressure on the SP500. A rising dollar makes US exports more expensive and can reduce the repatriated earnings of multinational US corporations, thereby impacting their profitability. Furthermore, a stronger dollar often correlates with a decrease in demand for risk assets globally, as capital flows tend to move towards the perceived safety and higher yields offered by dollar-denominated assets. This inverse relationship between the DXY and the SP500 is a well-established market dynamic. When the dollar strengthens, particularly on the back of hawkish Fed expectations or global economic uncertainty, it tends to create headwinds for US equities. The current market environment, characterized by rising yields, inflation concerns, and geopolitical instability, is a perfect storm for dollar strength. This, in turn, is likely contributing significantly to the selling pressure observed in the SP500. The interplay between Fed policy, inflation data, employment figures, and currency strength creates a complex web of fundamental factors that are currently aligning to challenge the bulls.
Market Sentiment and Correlation Analysis: A Risk-Off Environment
The prevailing market sentiment is undeniably risk-off, a state where investors prioritize capital preservation over aggressive growth strategies. This sentiment is not merely an abstract concept; it's reflected in the price action of various asset classes and their intermarket correlations. The sharp decline in the SP500 ($6,536.05) and Nasdaq 100 ($23,992.13) indices serves as a primary indicator of this risk aversion. When major stock indices tumble, it signals a broad-based withdrawal of capital from equities, suggesting that investors are becoming more risk-averse. This sentiment is further amplified by the simultaneous sharp decline in precious metals like gold ($4,497.65) and silver ($67.90). Typically, gold is seen as a safe-haven asset, and its decline alongside equities is unusual, suggesting that the current market dynamic is driven more by liquidity concerns or a broad deleveraging rather than a simple flight to quality. The significant drop in commodity prices, including gold and silver, is particularly noteworthy and points towards a potential slowdown in global demand or a broad unwinding of speculative positions across asset classes.
The strengthening US Dollar Index (DXY), now at 99.39, is a critical piece of this risk-off puzzle. A rising dollar often reflects global capital seeking refuge in US assets, either due to perceived safety or attractive yields. This inverse correlation between the DXY and risk assets like the SP500 is a consistent theme. As the dollar strengthens, it increases the cost of dollar-denominated assets for foreign investors and can put pressure on the earnings of multinational corporations. The current upward trajectory of the DXY suggests that global investors are indeed favoring the dollar, further contributing to the headwinds faced by the SP500. The energy markets, while showing a strong upward move in Brent crude ($112.79) and WTI ($98.50), present a complex picture. While rising oil prices can be inflationary, they also signal potential supply disruptions or robust demand, which can be a double-edged sword for equities. However, in the current environment, the inflationary impact of higher energy prices is likely a dominant concern, adding to the overall caution. The correlation analysis clearly indicates a market environment where caution prevails, and assets traditionally seen as risky are being sold off, while the dollar finds strength.
The lack of a clear flight to traditional safe havens, like gold, when equities are falling, is a nuanced point that requires attention. Usually, in a risk-off scenario, gold prices would surge as investors seek shelter. The fact that gold is also declining significantly, trading at $4,497.65, suggests a broader liquidation event is underway, where investors may be selling assets across the board to meet margin calls, reduce leverage, or simply exit positions due to heightened uncertainty. This type of broad-based selling can be more dangerous for markets than a simple rotation from risk to safety. It implies that liquidity might be drying up, or that there is a fundamental reassessment of asset valuations occurring. The technical indicators across multiple timeframes for gold also show strong bearish signals, with RSI readings in oversold territory and ADX indicating a powerful downtrend. This suggests that the current price action in gold is not just a minor correction but a significant trend shift, which further reinforces the bearish sentiment across other risk assets like the SP500. The interplay between these various asset classes paints a consistent picture: a market grappling with inflation, potential economic slowdown, geopolitical risks, and a strengthening dollar, all contributing to a prevailing risk-off sentiment.
The Road Ahead: Key Levels and What to Watch
Looking forward, the SP500's trajectory will be heavily dictated by its ability to hold critical support levels and the evolving macroeconomic narrative. On the daily chart, the first significant support level to monitor is $6,569.53. This level has acted as a pivotal point previously and its breach would confirm the bearish sentiment and potentially open the door for a further decline towards the next support at $6,522.87. This latter level is particularly important, as it coincides with the lower Bollinger Band on the 4-hour chart and is a key psychological number. A decisive close below $6,522.87 would signal a significant breakdown and could trigger stop-loss orders, accelerating the move towards the $6,486.83 level. This final support level on the daily chart represents a more substantial test, and a break below it would indicate a deeper market correction is underway.
Conversely, for any bullish turnaround to gain traction, the SP500 must first reclaim the resistance levels that have now become areas of potential selling pressure. The immediate resistance is found at $6,572.1 on the 1-hour chart, which is also the upper Bollinger Band on that timeframe. A break and hold above this level would be the first sign of bulls regaining control, but the real test lies higher. The $6,610.03 resistance on the 4-hour chart, and subsequently the $6,652.23 daily resistance, are the key hurdles that need to be cleared to suggest a genuine reversal. Until then, any rallies are likely to be viewed with skepticism, potentially representing bear market bounces or short-covering rallies that ultimately fail. The ADX indicator, currently strong on all timeframes, suggests that the existing trend has momentum. Therefore, a breakout above resistance needs to be accompanied by increasing volume and conviction to be considered sustainable. Otherwise, it risks being a bull trap.
The economic calendar in the coming week will be crucial. Investors will be closely watching upcoming inflation data releases, particularly any figures that might influence the Federal Reserve's monetary policy decisions. If inflation continues to surprise to the upside, it could solidify expectations of a 'higher for longer' interest rate environment, which would likely continue to weigh on equities. Conversely, any signs of significant cooling in inflation could provide a much-needed catalyst for a market rebound, potentially leading to a re-evaluation of Fed rate cut probabilities. Additionally, any further escalation or de-escalation of geopolitical tensions will undoubtedly impact market sentiment and commodity prices, with ripple effects across the broader financial system. The correlation with the DXY will also remain a key factor to monitor. A continued rise in the dollar could signal ongoing risk aversion, while a pullback might indicate a thawing of global anxieties and a return of risk appetite. The market is currently at a crossroads, and the confluence of technical levels and upcoming fundamental catalysts will determine the next significant move for the SP500.
Bearish Scenario: Downward Momentum Continues
65% ProbabilityNeutral Scenario: Consolidation Around Key Levels
25% ProbabilityBullish Scenario: Unexpected Reversal
10% ProbabilityFrequently Asked Questions: SP500 Analysis
What happens if SP500 breaks below the $6,491.30 support level?
A break below $6,491.30 on the SP500 would likely confirm the bearish momentum and could trigger further selling. The immediate downside target would then be $6,476.40, followed by $6,450.90, as indicated by the 1-hour technicals.
Should I consider buying SP500 at current levels around $6,536.05 given the oversold indicators?
While indicators like the Stochastic on the 4-hour chart are oversold, the overall trend remains bearish with strong ADX readings. A contrarian buy here is risky; it would be more prudent to wait for confirmation, such as a break above $6,572.10 resistance, or a clear bullish divergence on the daily RSI.
Is the RSI at 37.5 a strong sell signal for the SP500 right now?
An RSI of 37.5 indicates bearish momentum but is not yet in oversold territory. It suggests sellers are in control, but it's not an immediate sell signal in isolation. It aligns with the broader bearish trend, but a confirmed sell signal would typically require a break of key support levels like $6,491.30.
How might the Federal Reserve's stance on interest rates impact the SP500 this week?
If upcoming economic data reinforces sticky inflation, the Fed might maintain a hawkish stance, keeping rates higher for longer. This would likely continue to pressure the SP500 by increasing borrowing costs and making risk-free assets more attractive, potentially pushing prices towards our bearish targets.
“The market is a device for transferring money from the impatient to the patient.” – Warren Buffett. In volatile times like these, discipline and a clear strategy are your greatest allies. Stick to your plan, manage risk diligently, and wait for high-probability setups. Opportunity often knocks when the market least expects it.
Track markets in real-time
AI-powered analysis, technical indicators and real-time price data.
Join Our Telegram Channel
Breaking market news, AI analysis and trading signals instantly.
Join Channel