XAGUSD Tests $69.29 Support Amidst Bearish Trend: What's Next?
Silver (XAGUSD) is trading at $69.78, with the bearish trend testing key support levels. Analysis indicates potential for further downside if $66.58 fails.

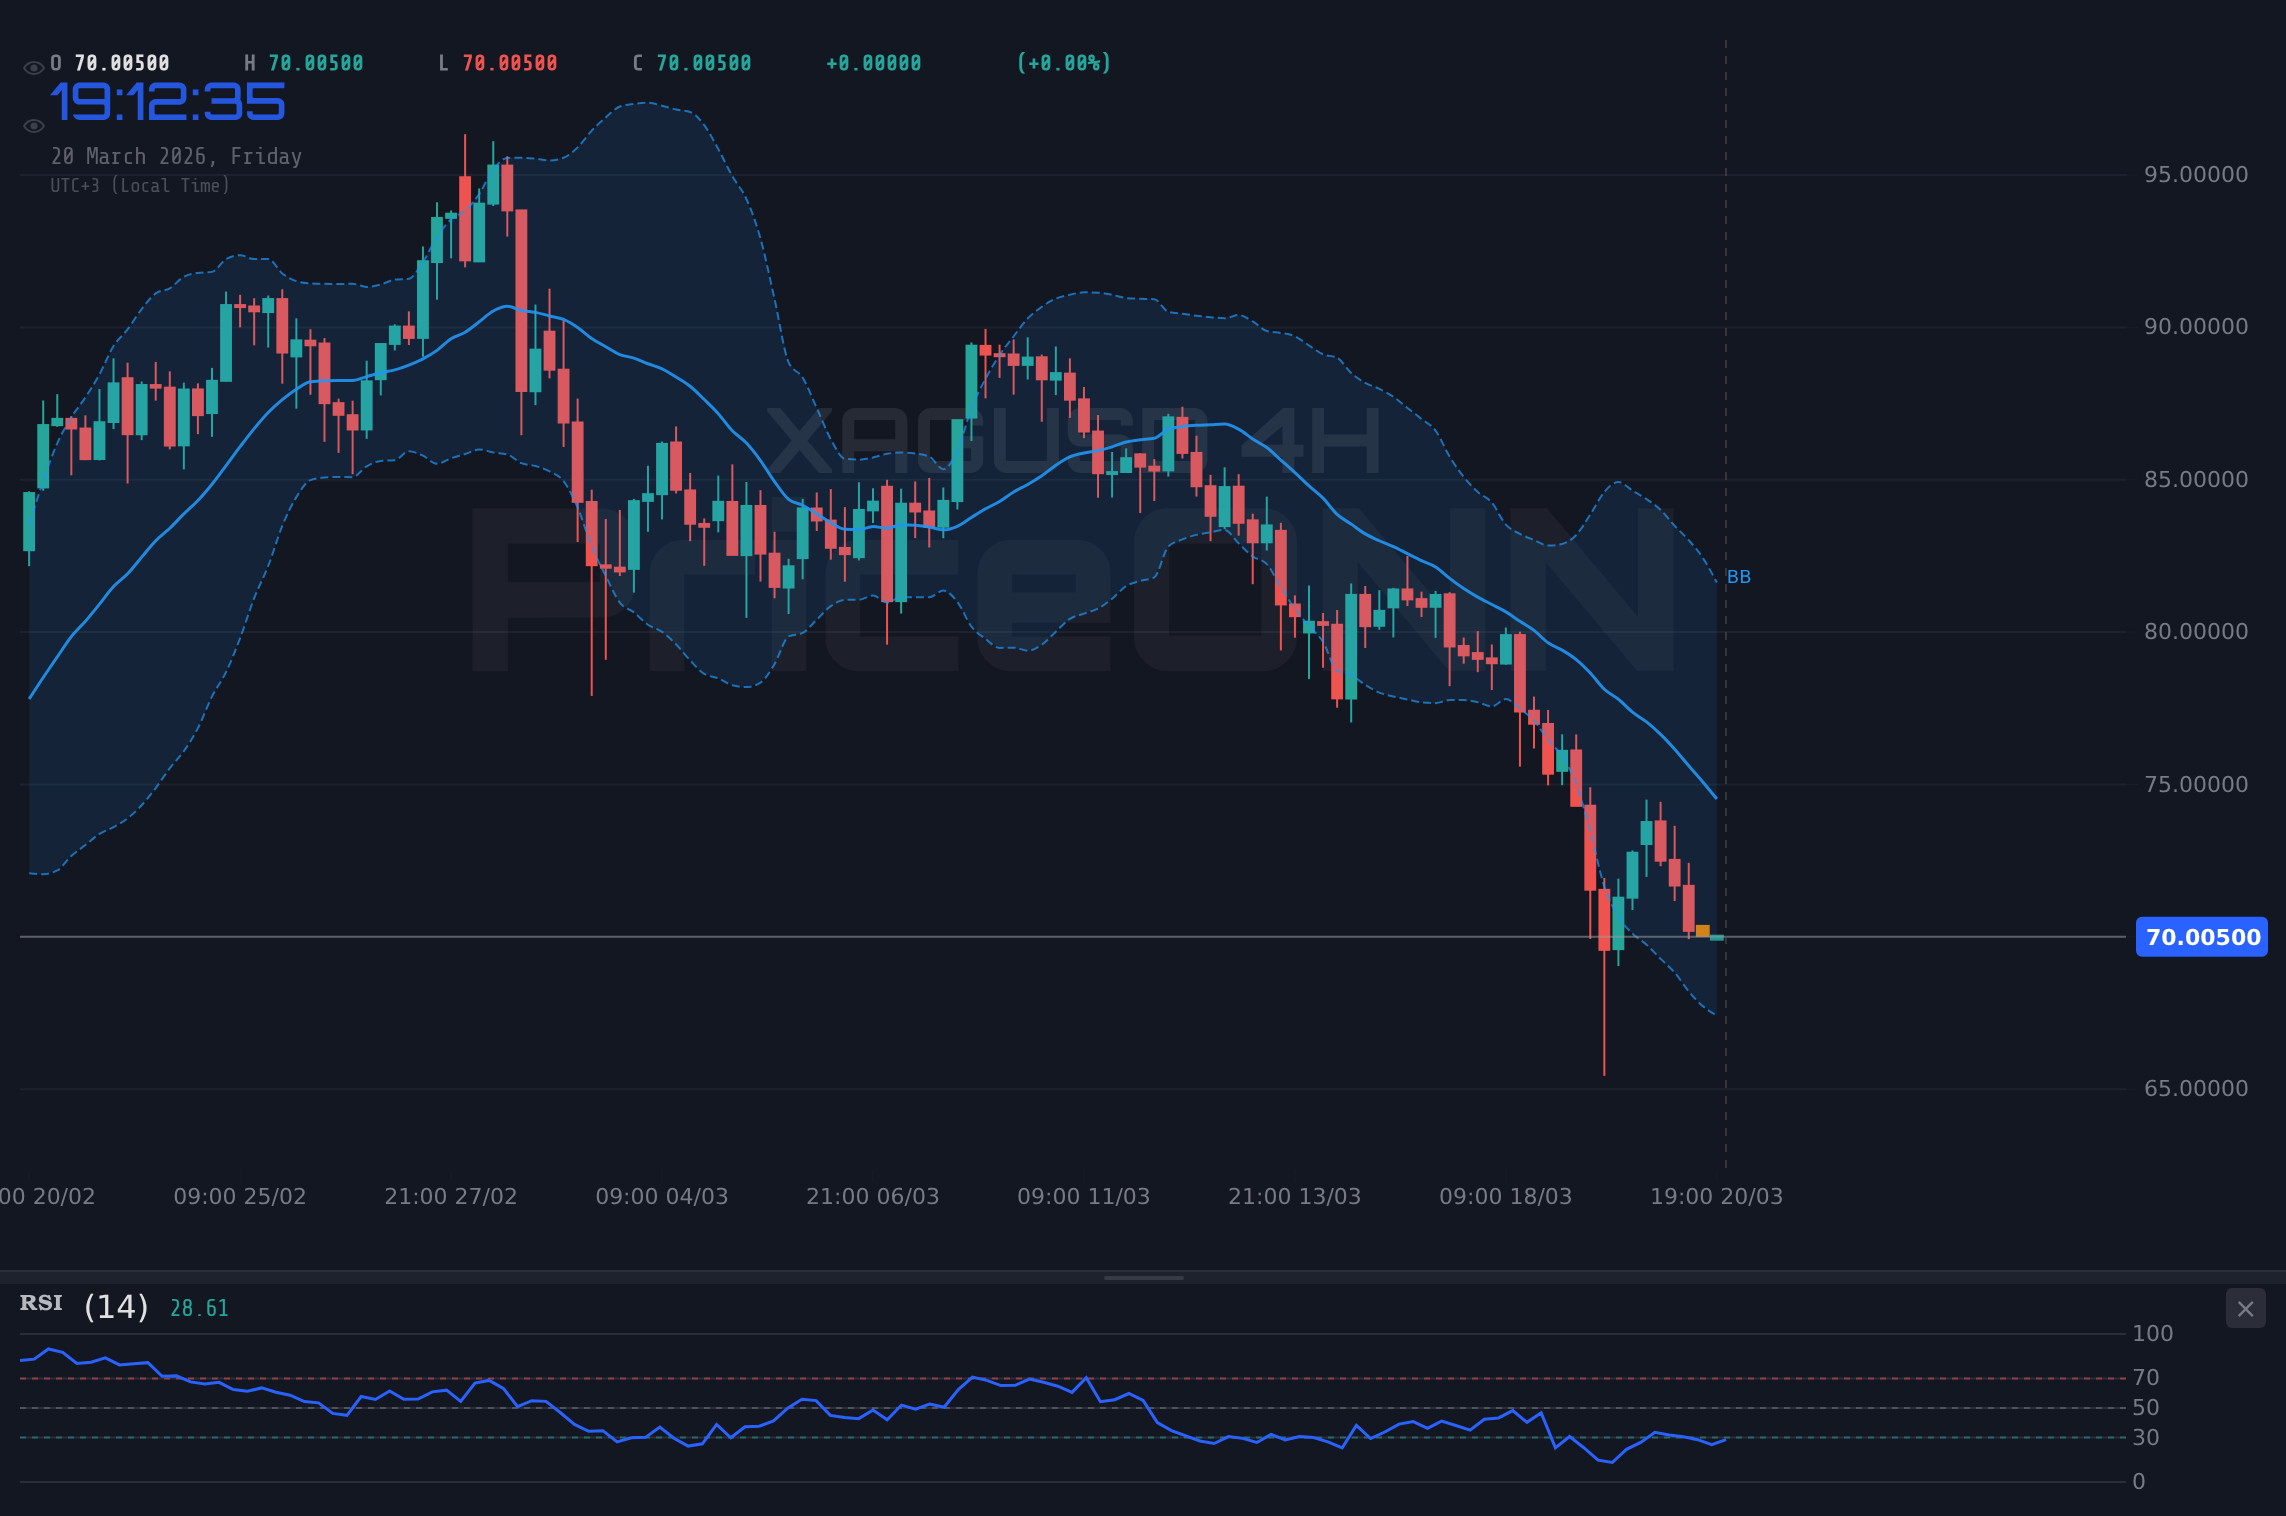
Silver's relentless downward march continues, with the current price hovering around $69.78. The question on every trader's mind is whether the bearish momentum will hold, pushing XAGUSD towards the critical $66.58 support level, or if a reprieve is imminent. After a significant decline, the market is keenly watching for any signs of stabilization or further capitulation. The current technical indicators, particularly on the 1H and 4H timeframes, paint a predominantly bearish picture, suggesting that the path of least resistance remains to the downside, at least in the short term. However, the daily chart hints at potential oversold conditions, which could offer a temporary floor.
- RSI at 37.07 on the 1H chart signals further downside pressure, but the 4H RSI at 30.4 indicates oversold territory.
- Critical support sits at $66.58, tested multiple times in the daily timeframe, with immediate pressure at $68.44.
- The ADX at 31.74 on the 1H and 57.1 on the 4H confirm strong bearish momentum.
- DXY strength and risk-off sentiment in equities are correlating with XAGUSD's decline.
The recent price action for XAGUSD has been characterized by a sharp and disorderly decline, as highlighted by the substantial daily change of -4.1% (-$2.99). This aggressive move has brought silver prices down to the $69.78 mark, a level that is now being scrutinized for its ability to hold. The 1-hour chart shows a clear downtrend with a high trend strength of 91%, supported by a selling signal from most indicators. However, the 4-hour chart, while still indicating a strong downtrend (100% strength), shows a Stochastic K line crossing above the D line, hinting at a potential short-term bounce. The daily chart, on the other hand, presents a more neutral trend strength of 50%, but the RSI at 31.42 and Stochastic in oversold territory suggest that sellers might be exhausting themselves, potentially setting the stage for a corrective move.
Caution: While the short-term technicals lean bearish, the extended nature of the decline on daily charts could lead to sharp, short-covering rallies. Traders should be wary of chasing the downside without confirmation of further breaks below key support levels.
The Bear's Roadmap: Testing Lower Ground
The bearish scenario for XAGUSD remains the dominant narrative, particularly given the strong trend strength indicated across multiple timeframes. On the 1-hour chart, the trend is firmly bearish with 91% strength, and the overall signal is a resounding 'SELL'. Key support levels to watch on this timeframe are $68.44, $67.44, and the more significant $66.47. A decisive break below $68.44 could accelerate selling pressure, targeting the subsequent levels. The ADX at 31.74 reinforces the conviction of this downtrend. On the 4-hour chart, the trend strength is even higher at 100%, with a 'SELL' signal dominating. Here, the immediate support is at $70.69, followed by $69.70 and $68.22. A close below $70.69 would confirm the bearish continuation, potentially leading to a retest of the $69.70 area and beyond.
The daily timeframe, while showing a neutral trend strength (50%), still carries a 'SELL' signal. This suggests that the longer-term picture might be consolidating or preparing for a bounce, but the immediate pressure is downwards. The daily support levels are further down at $66.58, $60.41, and $55.38. The RSI at 31.42 is deep in oversold territory, and the Stochastic K line is below the D line but also deeply oversold, indicating that while selling pressure is high, the potential for a bounce is increasing. The ADX at 19.43 on the daily chart signifies a weak trend, which can often precede a larger move or a period of consolidation. However, the confluence of bearish signals on shorter timeframes, coupled with the overall market sentiment driven by a strengthening US Dollar and risk aversion, points towards further downside pressure in the immediate outlook.
The divergence between the daily oversold conditions and the strong bearish momentum on shorter timeframes is where the opportunity lies. Traders are looking for a catalyst to either confirm the breakdown or signal a short-covering rally. The $66.58 level is a crucial pivot point; a break below it would validate the deeper bearish targets, while holding it could initiate a significant bounce.
The Bull's Gambit: A Potential Reversal Scenario
Despite the prevailing bearish sentiment, a bullish scenario cannot be entirely dismissed, especially considering the oversold readings on the daily chart. If XAGUSD manages to hold above the $66.58 support level, we could see a technical bounce. The 4-hour chart offers some preliminary signs, with the Stochastic showing a potential bullish crossover ($K=51.07 > D=48.29$) and the RSI at 30.4 nearing oversold territory. A bullish trigger would likely involve a decisive break above the immediate resistance on the 1-hour chart at $70.41, followed by a push above $71.38. If these levels are cleared with increasing volume, the next target would be the 4-hour resistance at $73.16, and potentially higher towards $74.64.
For a more sustained bullish move, XAGUSD would need to overcome the psychological barrier of the $70.00 mark and then consolidate above it. The daily chart's support at $66.58 is paramount. A failure to break decisively below this level, coupled with positive news flow or a shift in macroeconomic sentiment (e.g., a weaker DXY or a risk-on appetite in equities), could fuel a rally. Historically, silver has shown a tendency to rebound sharply from oversold conditions, especially after prolonged sell-offs. The daily RSI nearing 30 and Stochastic deeply oversold are classic indicators that often precede a reversal. However, for this scenario to gain traction, we need to see a clear shift in momentum, confirmed by higher highs and higher lows on at least the 4-hour timeframe, and a break of key resistance levels that have capped previous advances.
A sustained hold above $66.58, followed by a confirmed break of $70.41, could signal the start of a corrective rally targeting $73.16 and potentially $74.64. This would be a classic bounce from oversold conditions, favored by traders looking for short-term gains within a larger downtrend.
The Waiting Game: Consolidation and Uncertainty
A neutral scenario, where XAGUSD consolidates within a defined range, is also plausible, especially if conflicting signals from different timeframes continue to dominate. The daily chart's neutral trend strength (50%) and the weak ADX (19.43) lend credence to this possibility. In such a scenario, silver might oscillate between the immediate support at $68.44 and resistance at $70.41 on the 1-hour chart. This range-bound trading could persist until a significant macroeconomic event or a clear technical breakout provides a directional impetus. The market might be waiting for definitive cues from central banks, particularly the US Federal Reserve, regarding future monetary policy, or for clearer geopolitical developments that could sway safe-haven demand.
During a consolidation phase, volatility might decrease, but the underlying tension between buyers and sellers would remain. Price action could become choppy, with failed attempts to break key levels in either direction. This environment is often characterized by lower trading volumes and a lack of clear directional bias. For traders, this phase presents challenges as well as opportunities for range-bound strategies, but the risk of a sudden breakout from the consolidation zone remains. The key would be to identify the boundaries of this range and trade accordingly, while remaining prepared for a decisive move once the market decides on its next direction. The current data doesn't strongly favor a prolonged neutral phase, given the strong ADX readings on shorter timeframes, but it's a possibility if key levels fail to break decisively.
"The market always tells you where it wants to go; you just have to be patient enough to listen. Right now, the short-term whispers are bearish, but the daily chart is starting to hum a different tune."
- Hannah Müller, Financial AnalystThe Probable Path: Bearish Bias Remains Dominant
Assessing the confluence of technical indicators and market drivers, the bearish scenario appears to have the highest probability in the near term. The strong downward trend strength on the 1H (91%) and 4H (100%) charts, coupled with the majority of indicators signaling 'SELL', cannot be ignored. The ADX values of 31.74 and 57.1 on these timeframes indicate robust trending conditions, making a counter-trend move more challenging.
Furthermore, the macroeconomic backdrop currently favors a stronger US Dollar. The DXY is showing a clear upward trajectory, currently trading at 99.41, with a daily increase of 0.51%. A strengthening dollar typically exerts downward pressure on dollar-denominated commodities like silver. Additionally, the risk-off sentiment observed in the equity markets, with the S&P 500 down 0.84% and Nasdaq down 1.1%, suggests investors are seeking safer assets, which, paradoxically in this environment, might not be silver if the dollar is the primary safe haven. The recent news about gold testing $4,500 support amidst a liquidity squeeze also indicates broader weakness in precious metals. Therefore, the most likely scenario involves continued pressure on XAGUSD, with a potential retest of the $66.58 support level.
While the daily chart's oversold RSI and Stochastic suggest a potential for a bounce, this is more likely to be a corrective move within the larger downtrend rather than a full reversal, at least until stronger fundamental catalysts emerge or key daily supports hold firmly. The probability for the bearish scenario, targeting levels below $68.44 and potentially down to $66.58, is estimated at around 65%. The neutral scenario, involving consolidation between $68.44 and $70.41, holds about a 25% probability, primarily if upcoming data provides mixed signals or if the market enters a holding pattern ahead of major economic events. The bullish scenario, requiring a break above $70.41 and confirmation of a daily reversal, is currently assigned a lower probability of 10%, but remains a possibility if key support levels hold and market sentiment shifts dramatically.
Bearish Scenario: Downside Pressure Continues
65% ProbabilityNeutral Scenario: Range-Bound Trading
25% ProbabilityBullish Scenario: Oversold Bounce
10% ProbabilityWhat I'm Watching This Week
This week, the focus will be on a few key elements that could dictate the direction of XAGUSD. Firstly, the crucial daily support level at $66.58 is paramount. A decisive break below this level would confirm the continuation of the bearish trend and open up further downside targets. Conversely, if this level holds and we see a sustained push back above $70.41, it could signal the beginning of a corrective rally.
Secondly, the US Dollar Index (DXY) will remain a critical correlated factor. With the DXY currently at 99.41 and showing strength, any signs of weakness in the dollar could provide a reprieve for silver. Traders will be closely monitoring upcoming US economic data releases, particularly employment figures and inflation data, which will influence Fed policy expectations and, consequently, the DXY's trajectory. Any indication of a Fed pivot or a less hawkish stance could boost gold and silver prices.
Finally, broader market sentiment in equities will be important. A continued risk-off environment, with indices like the S&P 500 and Nasdaq under pressure, generally supports the dollar and can weigh on commodities. However, if the equity selloff intensifies dramatically, it could eventually lead to a flight to perceived safe havens, which might include silver, albeit with a lag. The interplay between these factors will be key to navigating XAGUSD's path forward.
Frequently Asked Questions: XAGUSD Analysis
What happens if XAGUSD breaks below the critical $66.58 support level?
A break below $66.58 would invalidate the potential for an immediate bounce and confirm the continuation of the strong bearish trend. This could lead to accelerated selling pressure, targeting further downside levels such as $60.41 and potentially $55.38 as indicated on the daily timeframe. The ADX reading would likely remain elevated, confirming strong momentum.
Should I buy XAGUSD at current levels around $69.78 given the oversold daily RSI?
Buying at current levels requires extreme caution. While the daily RSI at 31.42 suggests oversold conditions, the strong bearish trend on shorter timeframes (1H and 4H) indicates immediate downside risk. A more prudent approach would be to wait for confirmation of a bounce, such as holding above $66.58 and breaking key resistances like $70.41, before considering long positions.
Is the ADX at 57.1 on the 4H chart a sell signal for XAGUSD?
An ADX reading of 57.1 on the 4H chart signifies a very strong trending market, in this case, a strong downtrend. While it doesn't directly signal a 'sell', it indicates that the current downward move has significant momentum and conviction behind it. This reinforces the bearish outlook and suggests that attempting to trade against this strong trend without clear reversal confirmation is highly risky.
How will the DXY's current strength around 99.41 affect XAGUSD this week?
The current strength of the US Dollar Index (DXY) at 99.41 generally exerts downward pressure on dollar-denominated assets like silver (XAGUSD). A stronger dollar makes silver more expensive for holders of other currencies, potentially reducing demand. Unless the DXY shows signs of reversal, its strength will likely continue to be a headwind for XAGUSD, supporting the bearish scenario.
Technical Outlook Summary
| Indicator | Value | Signal | Interpretation |
|---|---|---|---|
| RSI (14) | 31.42 | Bearish | Deeply oversold on daily, but bearish on 1H/4H. |
| MACD Histogram | -15.20 | Bearish | Negative momentum, supporting downtrend. |
| Stochastic | 10.76 | Bearish | Oversold on daily, but K < D on 1H/4H. |
| ADX | 19.43 | Neutral | Weak trend on daily, but strong on 1H/4H. |
| Bollinger | Lower Band | Bearish | Price below lower band on daily, indicating oversold. |
Track markets in real-time
AI-powered analysis, technical indicators and real-time price data.
Join Our Telegram Channel
Breaking market news, AI analysis and trading signals instantly.
Join Channel