EURUSD Dips to $1.16; Key Support at 1.14768 Under Scrutiny
EURUSD tests critical support at $1.14768 as the DXY strengthens. What does the technical picture reveal for traders?
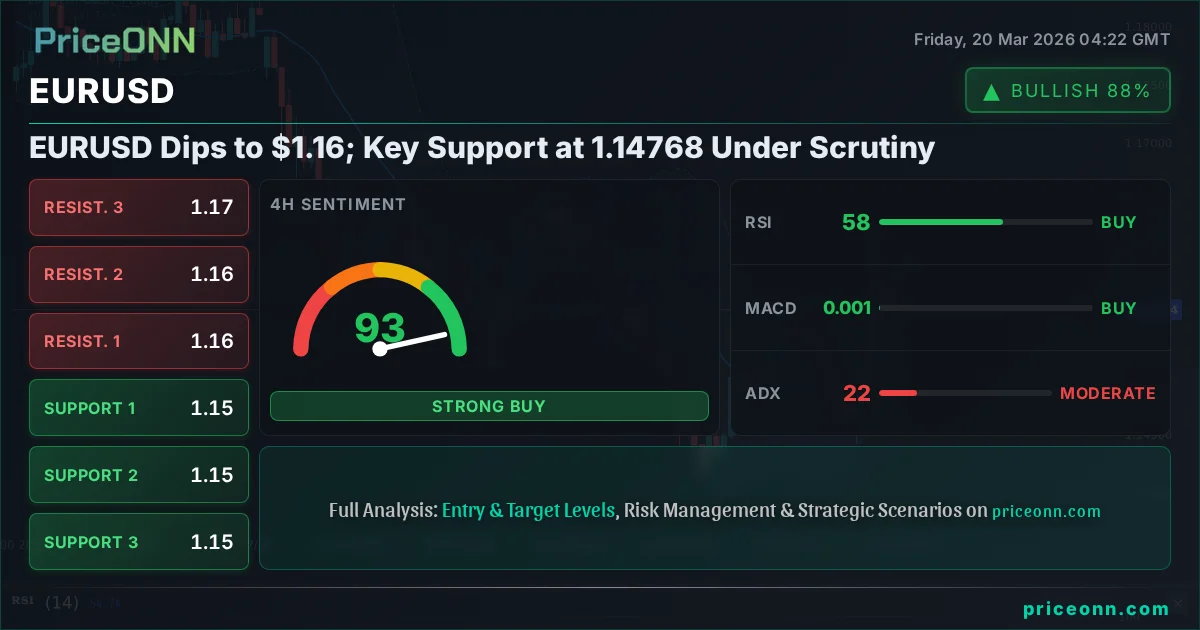
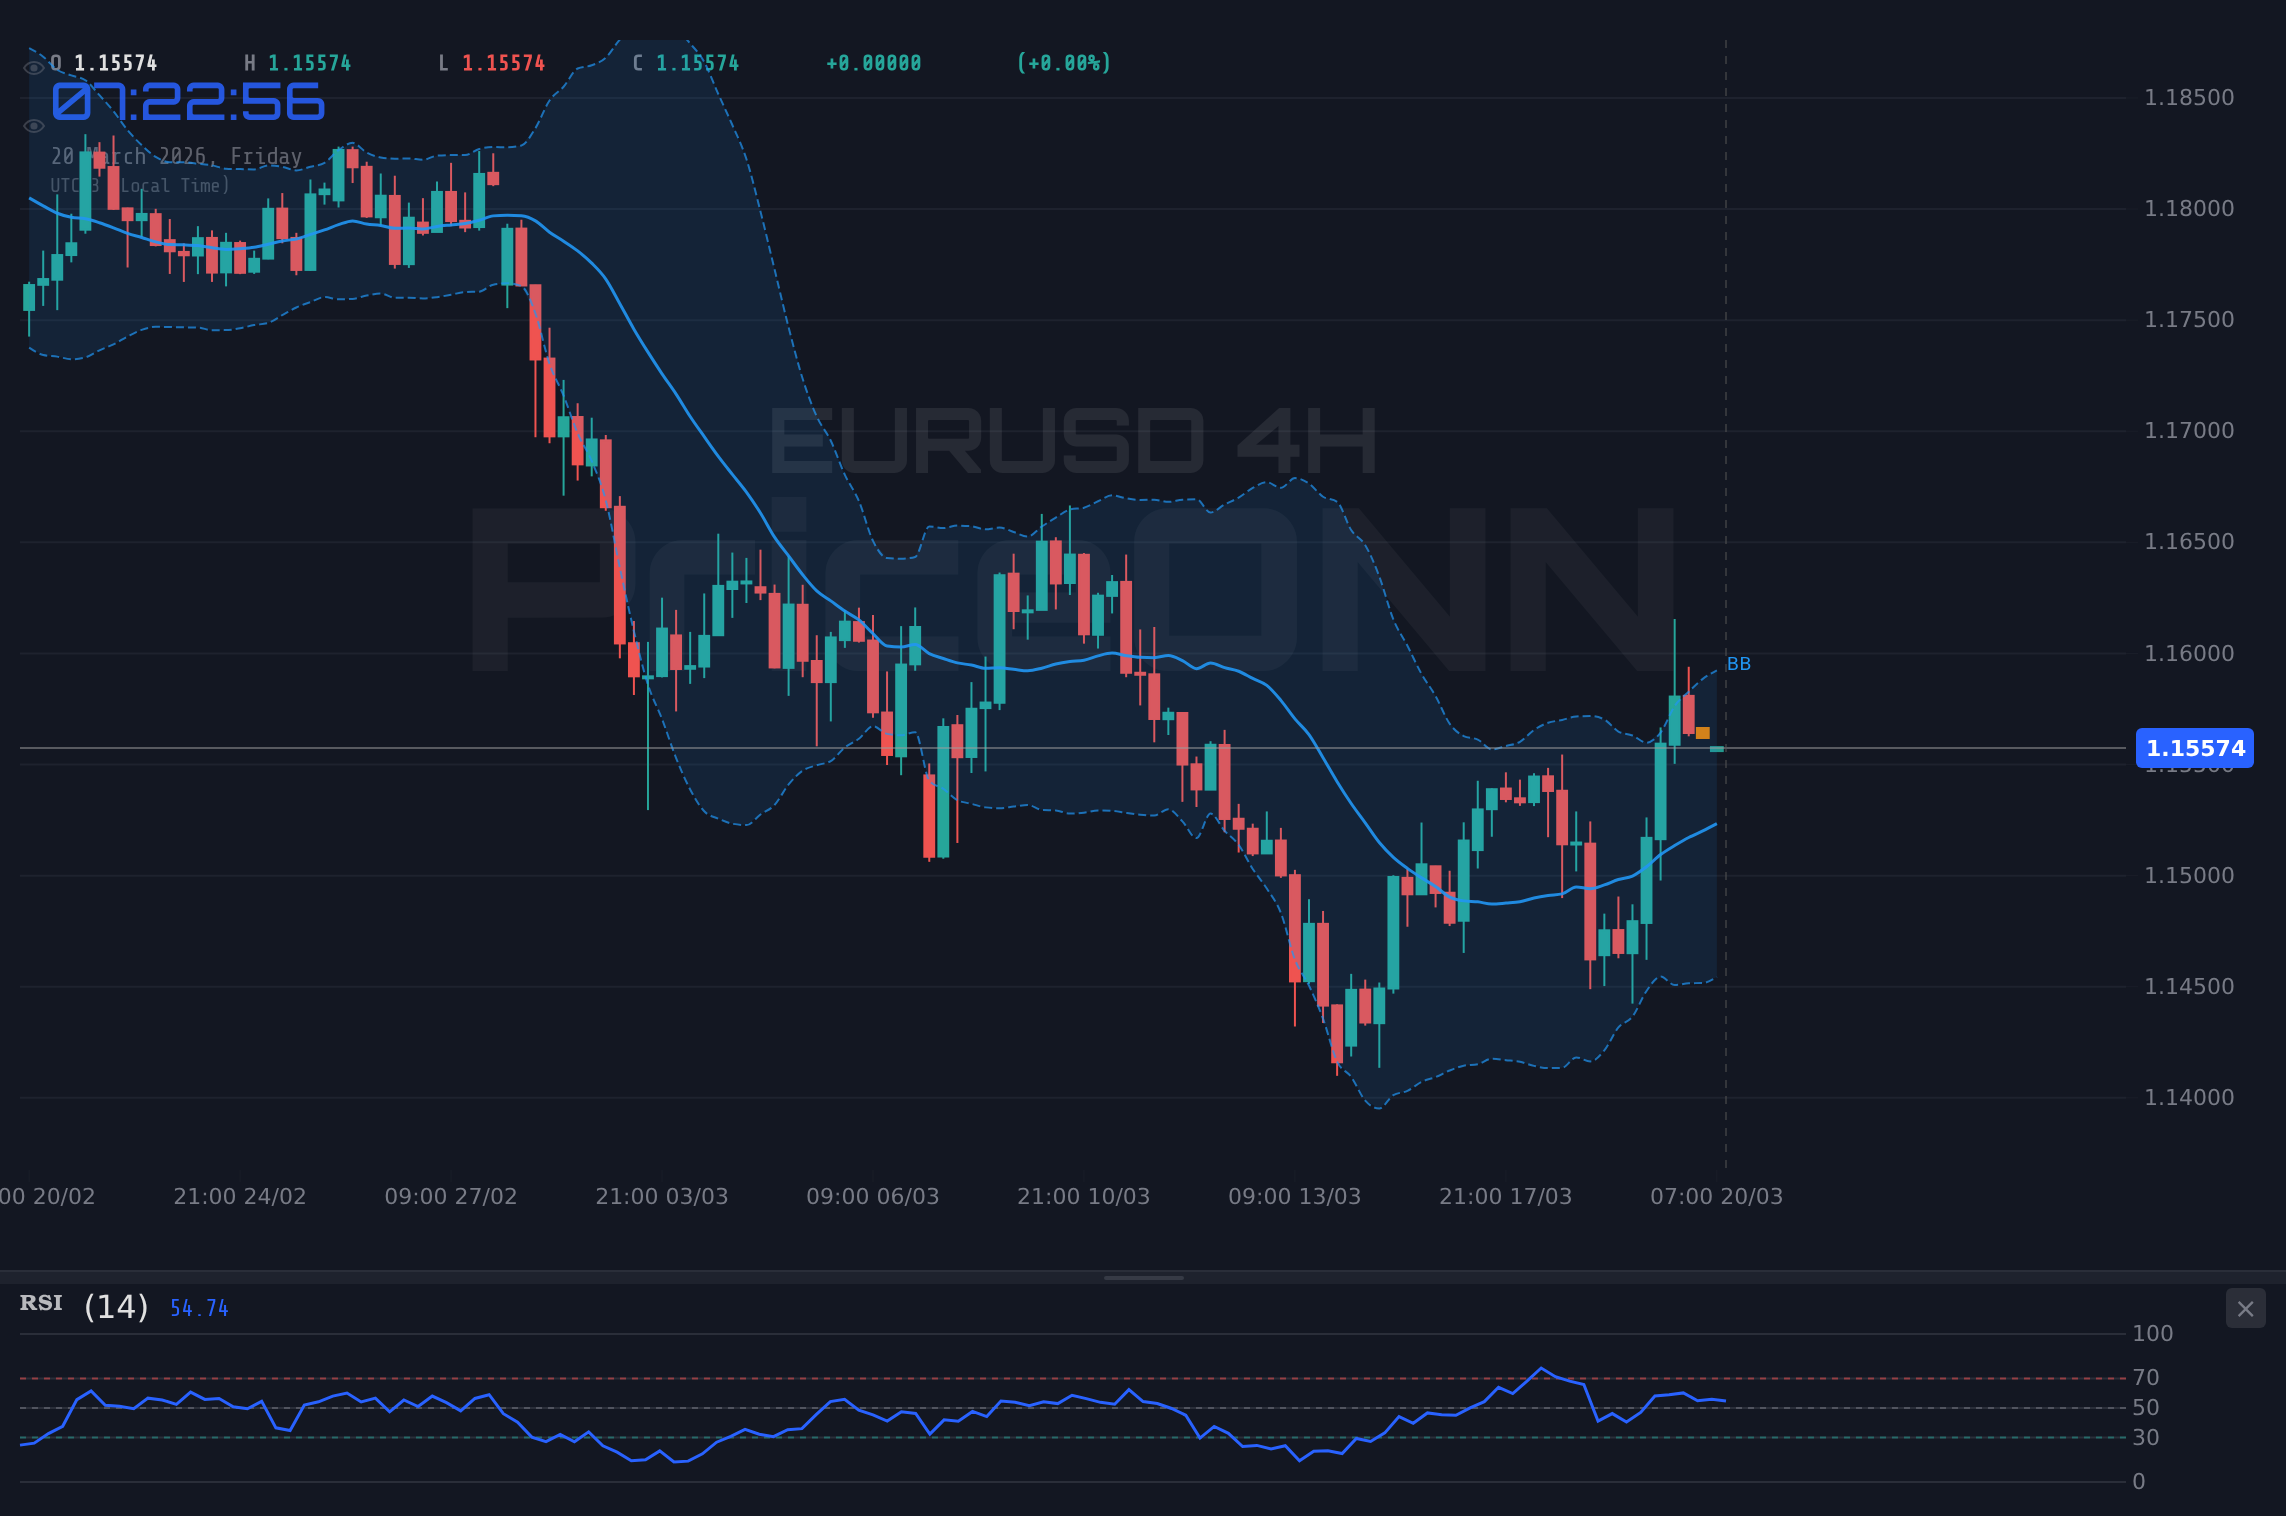
The EURUSD pair is currently navigating a crucial juncture, trading around the $1.16 mark. This level, while seemingly stable, masks underlying pressures that are bringing the critical support at 1.14768 into sharp focus. The recent strength in the US Dollar Index (DXY), coupled with mixed signals across global markets, creates a complex environment for the Euro. This isn't just a simple bounce or dip; it's a narrative woven from central bank policies, macroeconomic data divergences, and shifting risk sentiment that demands a closer look.
- EURUSD is trading near $1.16, with key support at 1.14768 under pressure.
- The US Dollar Index (DXY) is at 99.2, indicating strengthening dollar sentiment which typically weighs on EURUSD.
- RSI for EURUSD is at 59.28 on the 1H chart, suggesting some upward momentum, but the 1D RSI at 43.51 points to a bearish trend.
- Upcoming economic data releases from both the US and Eurozone will be critical in determining the next directional move.
Navigating the Dollar's Resurgence
The US Dollar Index (DXY) has been on a steady climb, currently positioned at 99.2. This upward trajectory is a significant factor influencing EURUSD. Historically, a stronger dollar often correlates with a weaker Euro, as it makes Euro-denominated assets less attractive to international investors. The DXY's current reading, supported by a strong 1D trend signal (Al: 7, Sat: 1, Nötr: 0), suggests that the greenback has underlying momentum. This isn't just a fleeting spike; it reflects a broader market sentiment that favors the dollar, likely driven by interest rate differentials or perceived economic stability compared to other major economies. For EURUSD traders, understanding the DXY's influence is paramount – a rising DXY often acts as a headwind, pushing the pair lower towards its support levels.
EURUSD Technicals: A Tale of Two Timeframes
Examining the EURUSD charts reveals a divergence in signals across different timeframes, a common characteristic of markets at critical junctures. On the 1-hour chart, the trend is neutral with a strength of 50%, and the RSI at 59.28 shows a slight upward bias, supported by positive MACD momentum and Bollinger bands sitting above the middle band. This might suggest short-term buying interest. However, casting our gaze to the daily (1D) chart paints a different picture. Here, the trend is decisively bearish, with a strength of 94%. The daily RSI is at 43.51, indicating a downward inclination, and the MACD is firmly in negative territory, below its signal line. The price action is below the middle Bollinger band, signaling a bearish inclination. This conflict between short-term upward signals and a longer-term bearish trend creates a 'wait-and-see' environment, where traders are looking for confirmation before committing to a direction.
The 1.14768 Support Level: A Critical Test
The immediate focus for EURUSD traders is the support level situated at 1.14768. This is not just an arbitrary number; it represents a price point where buying pressure has historically emerged. A break below this level on the daily chart, especially with the current bearish momentum indicated by the ADX at 37.37 (Güçlü düşüş trendi), could trigger a significant sell-off. The 4-hour chart also presents a bearish trend (Güç: 98%), with support at 1.14836, further reinforcing the significance of the 1.14768 area. If this key support fails to hold, the next logical target would be the subsequent support level at 1.13731. The market sentiment, as reflected by the overall signal on the 1D chart (Al: 1, Sat: 7, Nötr: 0), leans heavily towards selling pressure, making the defense of 1.14768 a pivotal moment for the Euro.
Macroeconomic Crosscurrents: Fed vs. ECB Expectations
The fundamental drivers behind EURUSD's current predicament are deeply rooted in the diverging monetary policy outlooks of the Federal Reserve and the European Central Bank (ECB). Recent market commentary, such as the news highlighting that traders have slashed expectations for any Federal Reserve interest rate cuts this year following the latest FOMC meeting, underscores a hawkish stance from the Fed. This is typically dollar-positive. Conversely, while the ECB has also maintained a cautious tone, any hint of a less aggressive policy path compared to the Fed can put pressure on the Euro. The market is constantly pricing in these expectations, and any data that reinforces the Fed's resolve to keep rates higher for longer will likely continue to support the DXY and weigh on EURUSD. We are watching closely to see if upcoming inflation or employment figures from the US further solidify this narrative, or if Eurozone data provides a surprising counterpoint.
The Role of Inflation and Growth Data
Inflation remains a key battleground for central banks, and the data emerging from both sides of the Atlantic is crucial. If US inflation proves more persistent than anticipated, it could embolden the Fed to maintain its tight monetary policy, thus supporting the dollar and pressuring EURUSD. On the other hand, if Eurozone inflation begins to cool more rapidly or growth indicators like PMI readings show significant weakness, it would amplify the bearish case for the Euro. The recent news hinting at potential stagflation concerns in the US, despite the Fed's optimism, adds another layer of complexity. Stagflation – a combination of stagnant economic growth and high inflation – presents a challenging scenario for policymakers and can lead to unpredictable market reactions. For EURUSD, this could translate into increased volatility as traders attempt to decipher the most probable economic path forward.
Geopolitical Ripples and Risk Sentiment
While the focus often remains on monetary policy, geopolitical events continue to cast a long shadow over currency markets. The recent news about disruptions at the Strait of Hormuz, sending oil prices soaring, highlights the ever-present risk of supply shocks. While this might initially seem like a USD-negative event due to potential inflation spikes, the interconnectedness of global markets means such shocks can also trigger a flight to safety, often benefiting the dollar as the world's primary reserve currency. Similarly, any escalation in global tensions or unexpected political developments can increase demand for safe-haven assets, including the US dollar. The market's risk appetite, often gauged by movements in indices like the S&P 500 (currently trading at 6616.6 with a 1D bearish trend), plays a vital role. A decline in risk appetite generally supports the DXY and puts downward pressure on riskier currencies or those sensitive to global growth, like the Euro.
Correlations: DXY, Equities, and Oil
The interplay between EURUSD, the DXY, major equity indices like the S&P 500, and oil prices (Brent crude at 107.16, showing a 1D bullish trend despite a 1H bearish signal) is essential for a comprehensive analysis. Currently, the DXY's strength at 99.2 is a primary driver. If the S&P 500 were to experience a significant downturn, this risk-off sentiment could further bolster the dollar, reinforcing the bearish outlook for EURUSD. Conversely, a strong rally in equities might coincide with a weaker dollar and support for EURUSD, although this relationship can sometimes break down under specific economic conditions. Oil prices, currently showing mixed signals across timeframes, can influence inflation expectations, which in turn affects central bank policy. A sustained surge in oil prices due to geopolitical events, like the Strait of Hormuz disruptions mentioned, could lead to renewed inflation concerns, potentially forcing central banks to adopt a more hawkish stance, thereby impacting the dollar and EURUSD.
Trading Scenarios: What Lies Ahead for EURUSD?
Given the current technical and fundamental landscape, several scenarios are plausible for EURUSD. The prevailing bearish sentiment on the daily timeframe, coupled with the dollar's strength, suggests that downside risks are elevated. However, short-term technicals offer glimmers of potential bounces, making the 1.14768 support level a critical pivot.
Bearish Scenario: Breakdown Below Support
65% ProbabilityNeutral Scenario: Consolidation Around Support
25% ProbabilityBullish Scenario: Bounce from Support
10% ProbabilityThe Path Forward: Data Dependency and Risk Management
The outlook for EURUSD remains heavily data-dependent. Traders will be dissecting upcoming economic releases from both the US and the Eurozone with a fine-tooth comb. Any signs of cooling inflation or a significant slowdown in US economic growth could provide a reprieve for the Euro, potentially triggering a bounce from the 1.14768 support. Conversely, stronger-than-expected US data or hawkish commentary from Fed officials could accelerate the bearish trend, pushing EURUSD lower. The ADX on the daily chart at 19.43 indicates a weak trend, suggesting that while the overall direction might be bearish, significant volatility could emerge, offering opportunities for both the bears and potentially a short-covering rally for the bulls. Prudent risk management remains paramount; ensuring positions are sized appropriately and stop-losses are strategically placed will be crucial in navigating these choppy waters.
Frequently Asked Questions: EURUSD Analysis
What happens if EURUSD breaks below the 1.14768 support level?
A break below 1.14768 on a daily close basis would likely confirm the bearish trend, potentially triggering further downside towards the next support at 1.13731. This scenario is supported by the strong bearish signals on the 1D chart and the persistent strength of the DXY.
Should I consider buying EURUSD at current levels around $1.16 given the mixed signals?
Buying at current levels around $1.16 carries significant risk due to the prevailing bearish trend on the daily chart and the dollar's strength. A more prudent approach might be to wait for a clear rejection of the 1.14768 support level or a confirmed breakout above near-term resistance at 1.15602.
Is the RSI at 43.51 on the daily chart a bearish signal for EURUSD?
Yes, an RSI reading of 43.51 on the daily chart is generally considered bearish, as it falls below the 50-neutral level and indicates a downward momentum. While the 1-hour RSI shows some strength, the longer-term daily indicator suggests caution for bullish positions.
How will upcoming US Non-Farm Payroll (NFP) data potentially affect EURUSD this week?
Stronger-than-expected US NFP data would likely reinforce the Fed's hawkish stance, boosting the DXY and pushing EURUSD lower towards its support levels. Conversely, weaker NFP figures could spark a Euro rally, potentially leading to a bounce from the critical 1.14768 support.
The Road Ahead: Vigilance and Strategy
The currency markets are rarely straightforward, and EURUSD is currently a prime example of this complexity. While the short-term indicators might offer fleeting hope for a bounce, the overarching bearish trend on the daily timeframe, amplified by a strengthening dollar and a cautious global risk sentiment, cannot be ignored. The 1.14768 support level represents a critical test; its outcome will likely dictate the pair's trajectory in the immediate future. For traders, patience and disciplined risk management are not just advisable - they are essential. Waiting for clear confirmation signals, whether it's a breakdown below support or a convincing bounce, will be key to navigating this uncertain environment. Remember, the market always offers opportunities, but they come to those who are prepared and disciplined.
Technical Outlook Summary
| Indicator | Value | Signal | Interpretation |
|---|---|---|---|
| RSI (14) | 43.51 | Bearish | Downward momentum on daily chart. |
| MACD Histogram | -0.00224 | Bearish | Negative momentum below signal line. |
| Stochastic | K:48.06, D:29.9 | Bullish Signal | %K > %D, potential for short-term bounce. |
| ADX | 37.37 | Strong Downtrend | Confirms strong bearish trend on daily. |
| Bollinger Bands | Below Middle Band | Bearish | Price trending below the mean. |
Key Levels
Track markets in real-time
AI-powered analysis, technical indicators and real-time price data.
Join Our Telegram Channel
Breaking market news, AI analysis and trading signals instantly.
Join Channel