DowJones30 Tests Key Support at $46,057.50: RSI Dives to 28.54
DowJones30 hovers near $46,057.50 as RSI hits 28.54. Bears are in control with a strong downtrend, but oversold conditions hint at a potential bounce.
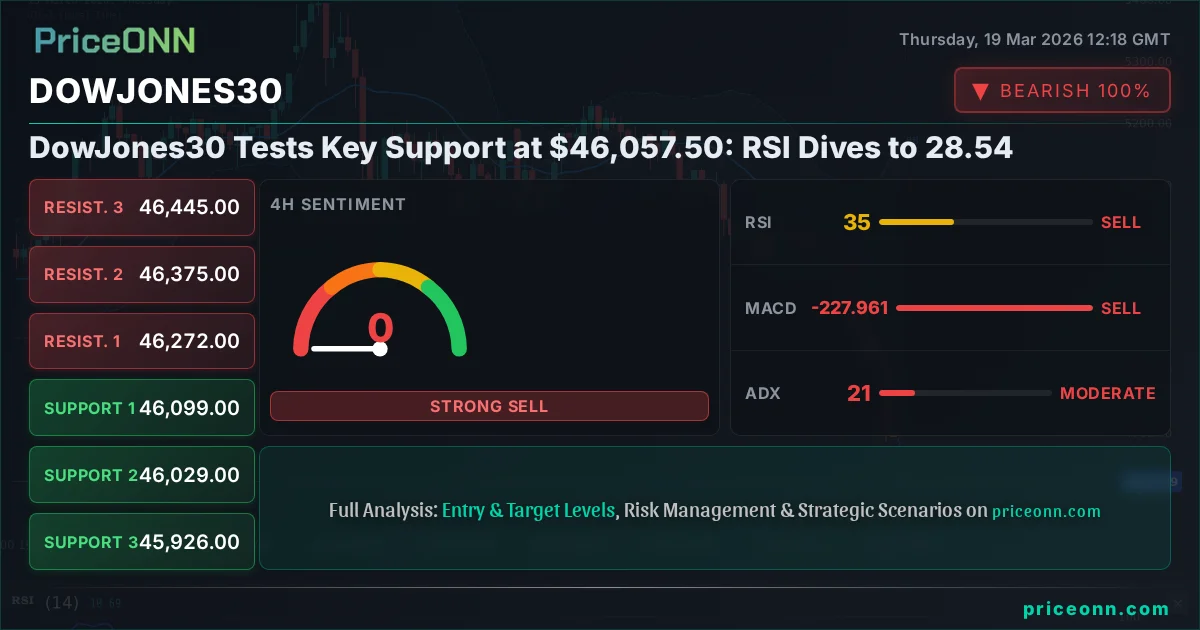
The Dow Jones Industrial Average (DJIA) is currently navigating a critical juncture, trading at precisely $46,057.50. This level is under intense scrutiny as the Relative Strength Index (RSI) on the daily chart plummets to 28.54, signaling deeply oversold conditions. While bears have firmly gripped the reins, pushing the index into a strong downtrend across shorter timeframes, this pronounced dip in momentum indicators suggests that the market may be approaching a potential inflection point. The coming sessions will be crucial in determining whether this support level holds, leading to a much-needed consolidation or reversal, or if the downward pressure intensifies, paving the way for further declines.
- The Dow Jones Industrial Average is currently trading at $46,057.50, a critical psychological and technical level.
- Daily RSI is at 28.54, deep in oversold territory, suggesting a potential for a short-term bounce or consolidation.
- Strong bearish signals dominate 1H and 4H charts (ADX > 40), indicating persistent selling pressure.
- The DXY is strong at 99.87, adding headwinds for risk assets like the Dow Jones.
The Bears' Grip Tightens: Analyzing the Downtrend
The technical picture for the Dow Jones Industrial Average is undeniably bearish across the shorter to medium-term timeframes. On the 1-hour chart, the trend is classified as a strong downtrend with 100% conviction, further reinforced by an ADX reading of 47.36. This signifies a robust trend that is unlikely to reverse without significant catalyst. The MACD is showing negative momentum, consistently trading below its signal line, a classic sign of selling pressure. Similarly, the Stochastic Oscillator is deep in oversold territory, with %K at 46.76 and %D at 43.3, indicating a potential for a brief upward correction, but not a trend reversal. The Bollinger Bands are also showing price action below the middle band, confirming the bearish sentiment. Even on the 4-hour timeframe, the trend remains bearish with 85% conviction and an ADX of 20.74, suggesting a moderately strong trend is still in play. The daily chart, while showing a stronger downtrend with 100% conviction, also presents an RSI of 28.54, a level historically associated with significant buying opportunities, though not immediately signaling a reversal. This divergence between the persistent downtrend on shorter frames and the deeply oversold condition on the daily chart creates a complex environment for traders.
The current price of $46,057.50 is being tested against the first support level of $46,060.67 on the 1-hour chart. This immediate test highlights the intraday pressure. However, the broader daily support levels offer more significant zones: $45,645.67, $45,217.33, and $45,389.67. For the bears to maintain control, breaking below the $46,000 psychological mark and subsequently challenging these lower support zones will be paramount. The resistance levels loom above, starting with $46,214.33 on the 1-hour chart, then $46,272 on the 4-hour, and extending to $46,901.67, $47,729.33, and $48,157.67 on the daily. These levels represent significant hurdles that would need to be overcome for any sustained bullish argument to gain traction.
The Bull's Gambit: A Bounce from Oversold Extremes?
The most compelling argument for a near-term bullish move stems from the deeply oversold daily RSI reading of 28.54. Historically, when the RSI on the daily Dow Jones chart dips below 30, it often precedes a period of consolidation or a short-covering rally. This is not a guarantee of a trend reversal, but it does indicate that selling momentum may be exhausted at these current levels around $46,057.50. For a bullish scenario to materialize, the index would need to find immediate buying interest around the current price, ideally holding above the $46,000 psychological level and the immediate 1-hour support at $46,060.67. A sustained close above the 1-hour resistance at $46,214.33 would be the first confirmation signal, suggesting that intraday sellers are faltering. Following this, a break and hold above the 4-hour resistance of $46,272 would strengthen the bullish case, potentially paving the way for a move towards the daily resistance cluster starting at $46,901.67. This scenario hinges on external factors potentially shifting market sentiment, such as a sudden dovish turn from the Federal Reserve or a significant easing of geopolitical tensions, which are currently adding pressure through a strong dollar.
The strength of the dollar, as indicated by the DXY at 99.87, presents a significant headwind for this bullish thesis. A stronger dollar typically correlates with weaker equity markets, especially for US indices. Therefore, for the Dow Jones to rally, we would likely need to see either a pullback in the DXY or a clear decoupling from this inverse correlation. The market's reaction to upcoming economic data will be key. If inflation figures come in softer than expected, or if employment data shows signs of cooling, it could fuel speculation of a Fed pivot or pause, which would support a risk-on rally. The probability of this scenario playing out in the short term (intraday to this week) is moderate, perhaps around 30-35%, given the overwhelming bearish technical signals on shorter timeframes. However, the potential for a technical bounce from such oversold levels cannot be entirely dismissed.
Trader's Edge: Look for Confirmation
Don't chase the oversold bounce. Wait for price action to confirm. A close above $46,214.33 on the 1-hour chart would be the initial sign, followed by a decisive break above $46,272 on the 4-hour chart. Until then, the path of least resistance remains downwards.
Where Bears Aim Next: Targeting Lower Support Zones
The prevailing bearish trend across multiple timeframes paints a clear picture for the bears' immediate objectives. With the Dow Jones trading at $46,057.50 and facing resistance just above this level, the primary goal for sellers is to break through the psychological $46,000 barrier and then decisively breach the first daily support at $45,645.67. A successful breakdown below this level would invalidate any immediate hopes for a bounce and open the door to further downside. The ADX readings of 47.36 (1H) and 40.02 (1D) suggest that the current trend has strong momentum, making a sharp reversal less likely without a significant shock to the system. The negative MACD momentum on all observed timeframes reinforces this outlook. If the $45,645.67 support gives way, the next logical targets would be the subsequent daily support levels at $45,217.33 and then $45,389.67. These levels represent significant historical price points where buyers might step in, but a sustained break below them would indicate a deeper correction.
The fundamental backdrop currently favors the bears. The strong US Dollar Index (DXY) at 99.87 acts as a persistent headwind, making US equities less attractive, especially when coupled with higher interest rate expectations or persistent inflation concerns. Geopolitical risks, such as the ongoing tensions in the Middle East which have driven Brent crude prices past $112, can also fuel a flight to safety, further benefiting the dollar at the expense of riskier assets like stocks. Upcoming economic data releases, particularly inflation and employment figures, will be critical. Stronger-than-expected data could reinforce the Fed's hawkish stance, leading to higher yields and increased pressure on the Dow Jones. Conversely, weaker data might trigger a short-term relief rally, but the overall trend bias remains downwards given the current technical setup. The probability of the bearish scenario playing out, targeting levels below $45,645.67 within the next week, is estimated at 55-60%, reflecting the dominant trend and supportive macro environment for dollar strength.
Risk Alert: Avoid Catching a Falling Knife
While the daily RSI is oversold, shorting into immediate bounces can be perilous. Focus on confirming breakdowns below key support levels before considering bearish positions. The trend is your friend until it reverses.
The Waiting Game: Consolidation Around $46,000?
A neutral scenario, characterized by consolidation or range-bound trading, is also a possibility, especially if the market attempts to digest the recent sharp decline and the deeply oversold daily RSI. This scenario would likely see the Dow Jones fluctuating around the $46,057.50 mark, perhaps oscillating between the immediate intraday support at $46,060.67 and resistance at $46,214.33, or even testing the 4-hour support at $46,029 and resistance at $46,272. Such a period of indecision typically occurs when conflicting signals emerge or when the market awaits a significant catalyst, such as major economic data or central bank commentary. In this case, the conflicting signals are evident: the strong bearish momentum on shorter timeframes versus the oversold daily RSI.
For consolidation to set in, neither the bulls nor the bears would be able to establish firm control. This would likely involve choppy price action, potentially with some 'stop hunting' as liquidity is tested on both sides of the range. Volume might dry up during these periods, indicating a lack of conviction from market participants. The ADX readings, particularly the lower values on the daily chart (16.66), can sometimes indicate a lack of directional trend, which could support a ranging market. However, the high ADX values on the 1-hour and 4-hour charts (47.36 and 40.02 respectively) contradict this, suggesting a strong trend is indeed present, making a prolonged neutral phase less probable unless a significant external factor forces a pause in the current trend. If this neutral scenario were to play out, it would likely be a temporary state, a prelude to a more decisive move once the market digests new information or the oversold conditions are resolved.
The probability of a sustained neutral range is relatively low in the current environment of strong trend signals on shorter timeframes and significant macroeconomic drivers at play. However, a brief period of consolidation before the next leg of a move is always possible. This would likely be confined between the immediate intraday support of $46,060.67 and resistance of $46,214.33, or perhaps extending to the 4-hour levels of $46,029 and $46,272. Any break decisively out of these tight ranges would signal a return to trending behavior, either bullish or bearish.
The Neutral Zone Dilemma
A neutral stance here is precarious. It implies market participants are waiting for clarity. The question is, what catalyst will break the stalemate? Upcoming inflation data or Fed speak could be the spark.
The Most Probable Path: Bearish Trend Continuation with a Caveat
Considering the confluence of technical indicators and the prevailing macroeconomic environment, the most probable scenario for the Dow Jones Industrial Average in the near to medium term (this week) is a continuation of the bearish trend, albeit with a caveat for a potential short-term technical bounce. The strong downtrend signals on the 1-hour and 4-hour charts, coupled with the persistent strength of the US Dollar (DXY at 99.87), create a challenging backdrop for any sustained bullish move. The bears have demonstrated control, and the immediate price action at $46,057.50 is testing key intraday support. The probability assigned to the bearish scenario, targeting lower support levels like $45,645.67 and potentially $45,217.33, is estimated at 55-60%.
However, the deeply oversold daily RSI at 28.54 cannot be ignored. This suggests that while the trend is down, the market is technically 'stretched' to the downside. Therefore, a short-term technical bounce or a period of consolidation is a plausible development within this broader bearish outlook. This bounce could see the index retest resistance levels around $46,214.33 or $46,272 before resuming its downward trajectory. The caveat is that any such bounce needs to be treated with caution, as it may simply be a pause before further declines, rather than the start of a significant recovery. The bullish scenario, requiring a clear break above key resistance levels and a shift in macro sentiment, currently holds a lower probability, estimated at 30-35%, primarily driven by the potential for a technical oversold bounce.
The neutral scenario, while possible as a temporary pause, seems less likely to persist given the strong trend momentum indicated by the ADX on shorter timeframes. If the market were to enter a prolonged range, it would likely be driven by a significant shift in fundamental drivers or a period of extreme indecision awaiting major news. For now, the path of least resistance appears to be downwards, but traders should remain vigilant for signs of a potential technical correction, especially as the daily RSI remains deeply oversold.
Opportunity Amidst the Downturn
While the overall trend is bearish, extreme oversold conditions can present tactical opportunities for short-term gains. The key is risk management and waiting for clear signals, not anticipating the bottom.
What I'm Watching This Week
The coming days will be pivotal for the Dow Jones Industrial Average, with several key catalysts likely to influence its direction. Firstly, I'll be closely monitoring the upcoming US inflation data. Readings on CPI and potentially PCE will provide crucial insights into the Fed's future policy path. If inflation remains stubbornly high, it could reinforce the higher-for-longer interest rate narrative, adding further pressure on risk assets and supporting the bearish outlook for the Dow. Conversely, any signs of cooling inflation could trigger a relief rally, offering a temporary reprieve from the selling pressure.
Secondly, the commentary from Federal Reserve officials will be under the spotlight. Any hints about the timing of potential interest rate cuts or shifts in their stance on inflation will be closely analyzed. Given the current strong dollar environment (DXY at 99.87), any dovish signals from the Fed could lead to a dollar pullback and a corresponding boost for equities. Conversely, hawkish remarks would likely exacerbate the downward pressure. Finally, I am watching the price action around the $46,057.50 level and the immediate support at $46,060.67. A decisive break below this zone could accelerate declines towards $45,645.67, confirming the bearish thesis. Conversely, holding this level and seeing a confirmed break above intraday resistance at $46,214.33 would be the first sign that a technical bounce is underway.
📊 Indicator Dashboard
| Indicator | Value | Signal | Interpretation |
|---|---|---|---|
| RSI (14) Daily | 28.54 | Oversold | Deeply oversold, potential for bounce, but trend is down. |
| MACD Daily | Negative | Bearish Momentum | Below signal line, confirming selling pressure. |
| Stochastic Daily | %K: 5.64, %D: 16.58 | Oversold | Deeply oversold, potential for short-term reversal. |
| ADX Daily | 16.66 | Weak Trend | Suggests range-bound potential, contradicting shorter frames. |
| ADX 1H | 47.36 | Strong Trend | Confirms strong downward momentum. |
Key Levels
▲ Support Levels
▼ Resistance Levels
Bearish Scenario: Continued Decline
55% ProbabilityNeutral Scenario: Consolidation Phase
35% ProbabilityBullish Scenario: Oversold Bounce
10% ProbabilityFrequently Asked Questions: DowJones30 Analysis
What happens if the DowJones30 breaks below $46,000 support?
A break below the $46,000 psychological level, confirmed by a close below the 1H support at $46,060.67, would likely trigger further selling pressure. The primary target would then shift to the daily support at $45,645.67, with subsequent risk towards $45,217.33.
Should I consider buying DowJones30 at current levels of $46,057.50 given RSI at 28.54?
While the daily RSI at 28.54 is deeply oversold, suggesting a potential bounce, chasing a falling knife is risky. The trend on shorter timeframes remains strongly bearish. A more prudent approach would be to wait for confirmation, such as a break above intraday resistance at $46,214.33, before considering any long positions.
Is the daily RSI at 28.54 a sell signal for DowJones30 right now?
An RSI of 28.54 is technically an oversold condition, which typically signals a potential pause or reversal in a downtrend, rather than a direct sell signal. However, in strongly trending markets, RSI can remain oversold for extended periods. The overwhelming bearish momentum on 1H and 4H charts suggests caution, with the probability of further downside outweighing an immediate buy signal.
How will the upcoming US inflation data affect DowJones30 this week?
Higher-than-expected inflation data could reinforce the Fed's hawkish stance, potentially leading to higher yields and increased pressure on the Dow Jones, supporting the bearish outlook. Conversely, softer inflation could trigger a relief rally by fueling rate cut expectations, offering a temporary reprieve.
Track markets in real-time
AI-powered analysis, technical indicators and real-time price data.
Join Our Telegram Channel
Breaking market news, AI analysis and trading signals instantly.
Join Channel