AUDUSD Tests Resistance Near $0.7096 Amid Mixed Signals
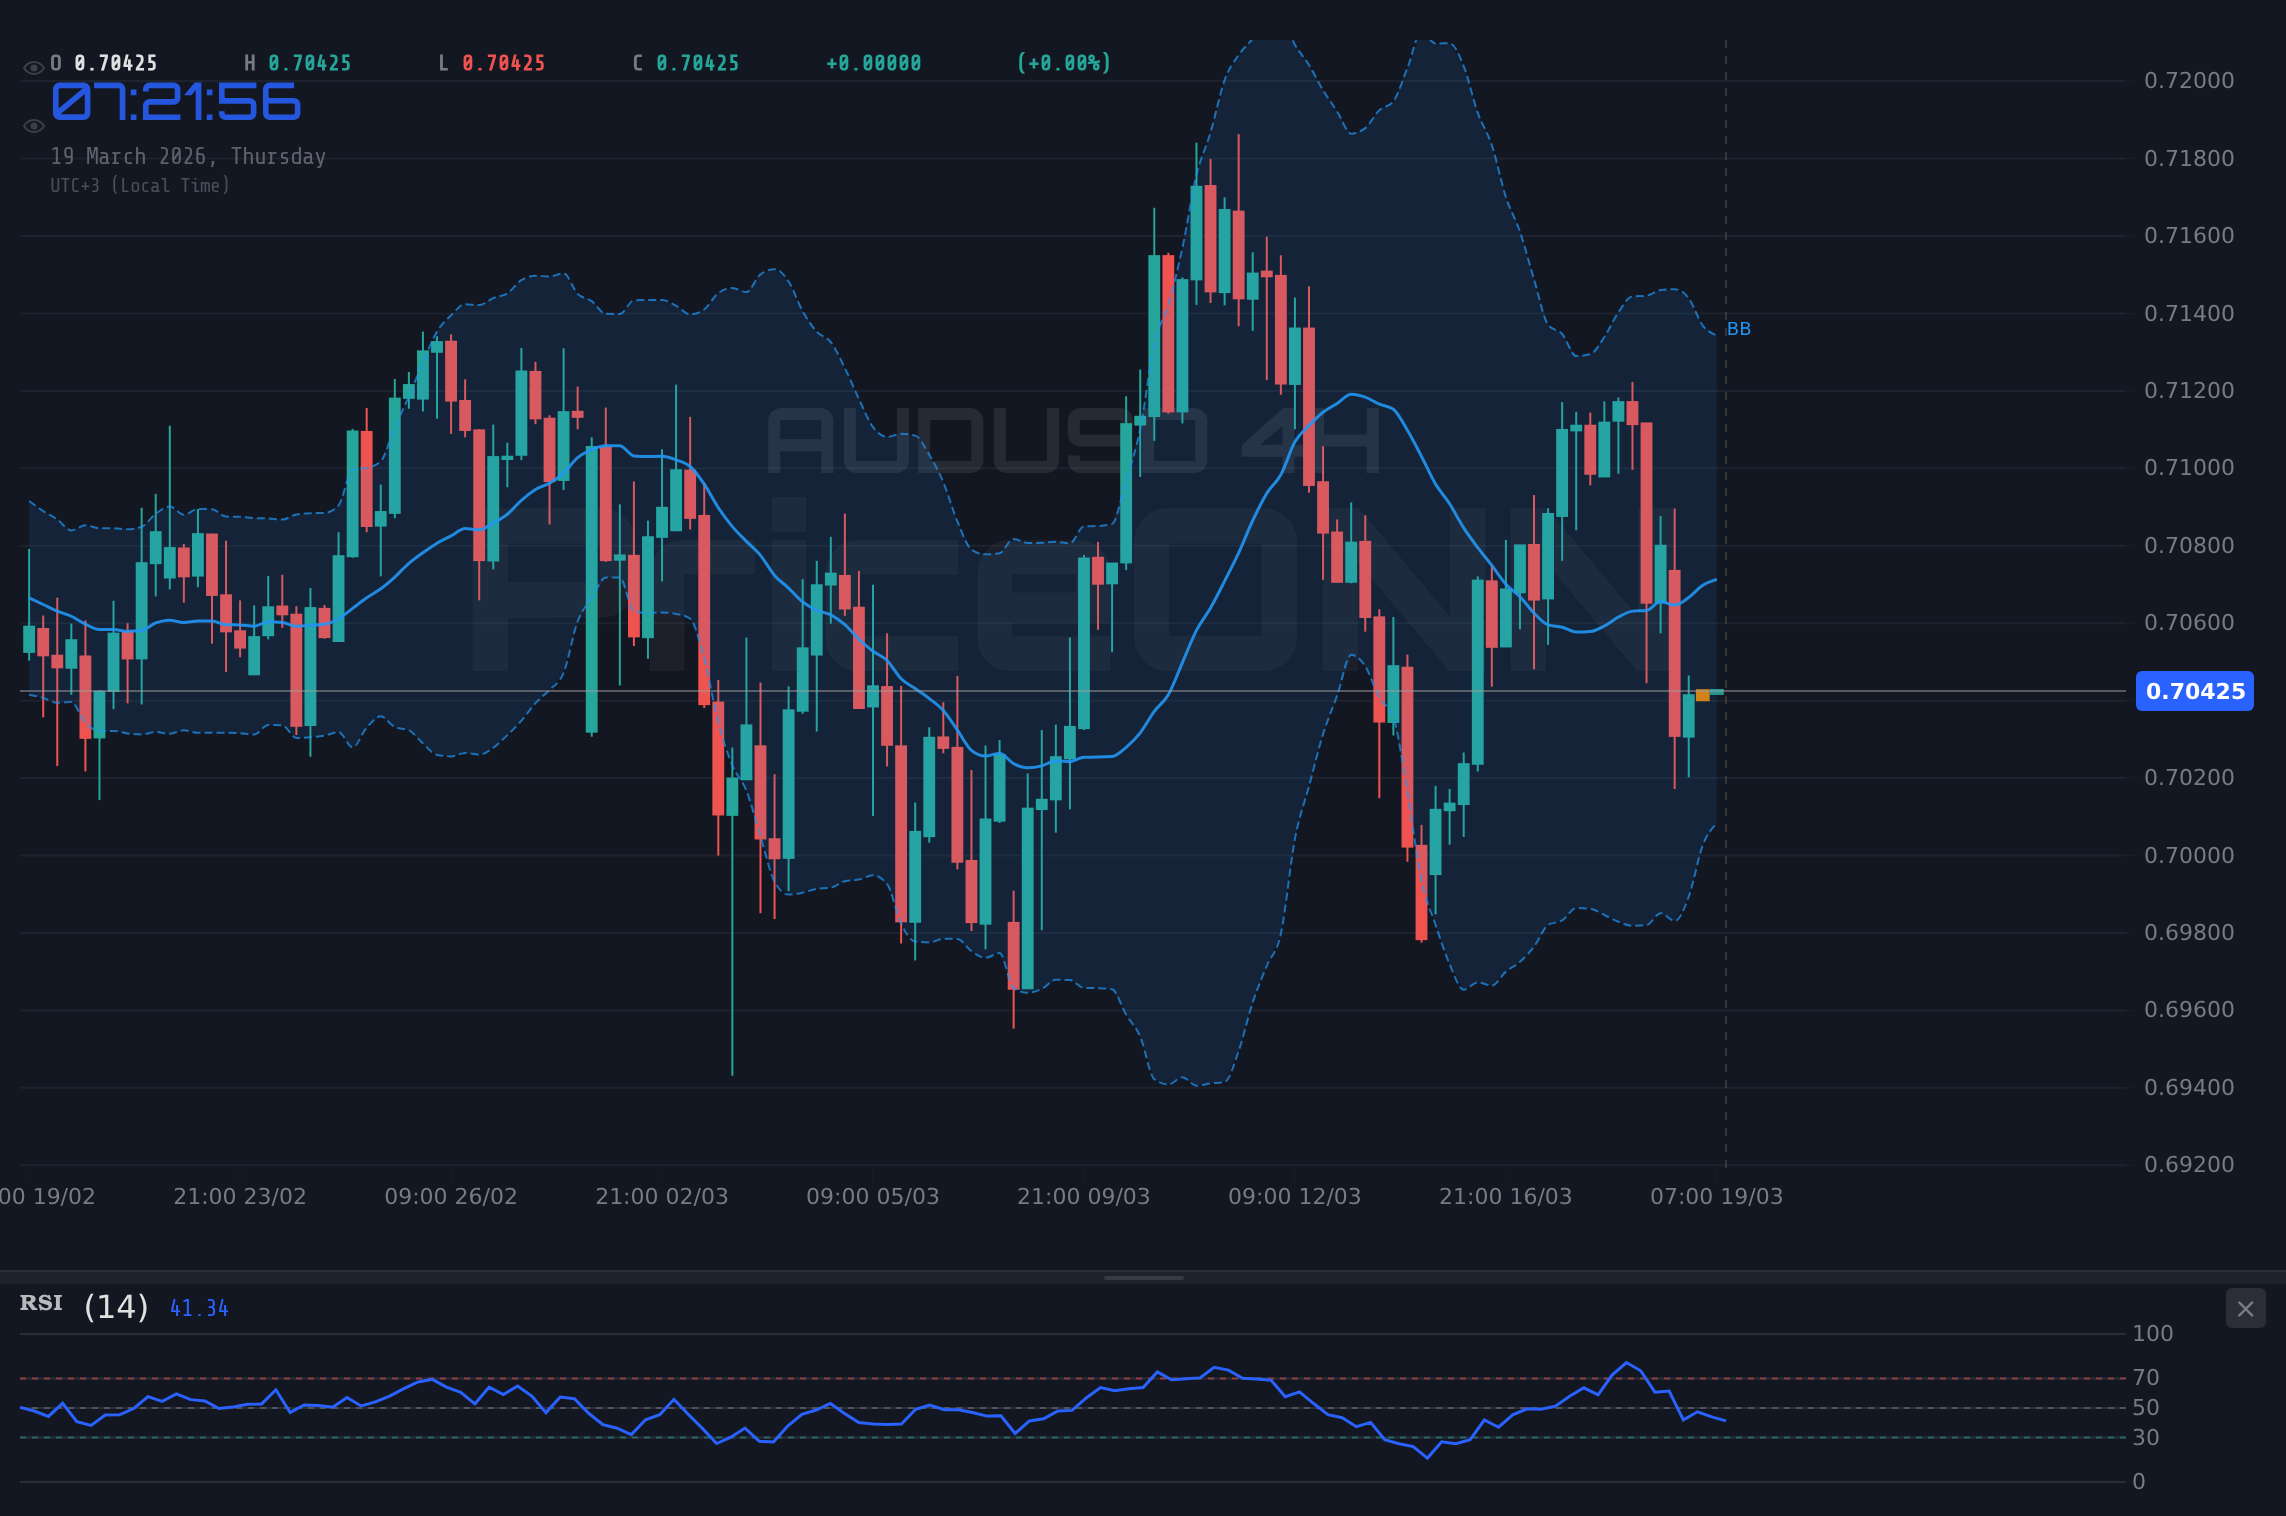
AUDUSD hovers around $0.70436. With RSI at 41.82 and a strong downtrend on 1H, the Aussie faces headwinds. Key levels to watch are $0.7096 resistance and $0.7012 support.
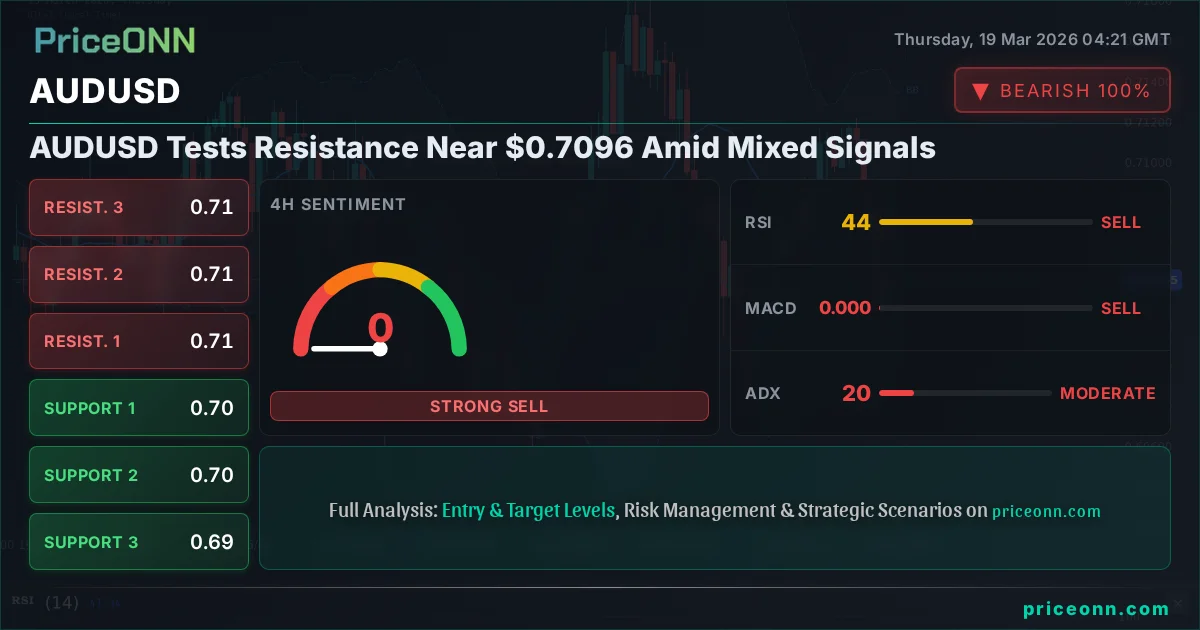
The Australian Dollar (AUDUSD) is currently navigating a critical juncture, trading around the $0.70436 mark. While the daily chart hints at a potential bullish reversal, the immediate technical signals on shorter timeframes paint a more cautious picture. This divergence creates a complex environment for traders, demanding a close examination of both fundamental drivers and technical underpinnings to decipher the likely direction of AUDUSD in the coming days. The market is currently caught between the lingering effects of a strong US Dollar Index (DXY) and a cautious global risk sentiment, with upcoming economic data poised to be the key catalyst.
- AUDUSD RSI at 41.82 on the 1H chart signals weakening bullish momentum.
- Critical support for AUDUSD sits at $0.7012, tested multiple times this week.
- The ADX at 30.87 on the 1H chart indicates a strong downtrend, despite some daily chart bullish signals.
- Federal Reserve rate expectations and commodity price movements are key drivers for AUDUSD correlation with DXY.
Navigating the AUDUSD Landscape: A Tale of Two Timeframes
The daily chart for AUDUSD presents a somewhat hopeful outlook, with the price action suggesting a potential bottoming formation. However, this optimism is tempered significantly when we zoom into the shorter timeframes. On the 1-hour chart, the trend is decidedly bearish, with the ADX reading at a robust 30.87, indicating a strong existing downtrend. This technical conflict is precisely where market opportunities and risks lie. The current price of $0.70436 finds itself precariously balanced, with immediate resistance looming at $0.7096 and immediate support at $0.7012. A decisive break above resistance could signal a shift in sentiment, while a fall below support would reinforce the bearish narrative.
The DXY, currently trading around 99.94, remains a significant factor. A strengthening dollar typically exerts downward pressure on commodity-linked currencies like the Australian Dollar. While the DXY is showing signs of upward momentum on the daily chart, its 1-hour trend is also bullish, suggesting continued dollar strength could act as a headwind for AUDUSD. This correlation is not always perfect, but it's a crucial piece of the puzzle for any trader looking to understand the broader forces at play. The interplay between the Fed's monetary policy stance, reflected in DXY movements, and the RBA's position will be pivotal.
The Weight of the Dollar and Global Risk Appetite
The Federal Reserve's recent policy signals, as interpreted from market reactions and news flow, are undeniably influencing the greenback. With the Fed potentially maintaining a hawkish stance or signaling a slower pace of rate cuts than anticipated, the US Dollar Index (DXY) has found support. The DXY's daily trend is bullish with a strength of 93%, and its 1-hour trend is also bullish at 94%. This sustained dollar strength naturally puts pressure on pairs like AUDUSD. Traders are closely watching for any deviation from the expected Fed path, as this could trigger significant volatility.
Furthermore, global risk sentiment plays a crucial role. When risk appetite is high, currencies like AUD and NZD tend to perform well, while safe-haven assets like the USD and JPY strengthen during periods of uncertainty. The S&P 500 and Nasdaq indices, currently showing bearish trends on the daily and 1-hour charts respectively, suggest a risk-off environment. This overall market mood is likely contributing to the bearish technical signals observed in AUDUSD on shorter timeframes, despite any potential daily chart consolidation or reversal patterns.
AUDUSD Fundamentals: Beyond the Charts
From a fundamental perspective, the Australian Dollar is heavily influenced by commodity prices, particularly iron ore and coal, as well as China's economic performance, given its status as Australia's largest trading partner. Recent news indicates a surge in Brent crude prices past $108, while WTI lagged, potentially signaling geopolitical tensions impacting energy markets. While this is not directly tied to AUDUSD, it reflects a broader risk environment that could affect commodity demand and, by extension, the Aussie. The hot US Producer Price Index (PPI) data, coming in significantly higher than expected, has also rattled markets and reinforced hawkish Fed expectations, further bolstering the US Dollar.
The RBA's monetary policy stance is also a key consideration. While the Fed leans hawkish, any hint of a more dovish approach from the Reserve Bank of Australia could weigh on AUD. Conversely, if the RBA signals a willingness to maintain higher rates for longer, or even considers further hikes amidst persistent inflation, it could provide a floor for AUDUSD. The market is keenly awaiting upcoming economic data releases from both Australia and the US, including inflation figures and employment reports, which will be crucial in shaping the near-term trajectory of AUDUSD.
Technical Breakdown: A Deeper Dive into AUDUSD Indicators
Delving deeper into the technical indicators for AUDUSD reveals a mixed bag, but with a clear bearish bias on the most immediate timeframes. On the 1-hour chart, the RSI(14) is sitting at 41.82, well within the neutral zone but exhibiting a downward trend, suggesting a lack of buying conviction. The MACD, while showing positive momentum, is below its signal line, indicating a potential for further downside. The Bollinger Bands are also positioned below the middle band, reinforcing the bearish inclination.
However, the Stochastic oscillator on the 1-hour chart presents a conflicting 'buy' signal, with %K at 48.84 and %D at 26.34, indicating a potential for a short-term bounce. This kind of divergence is common in choppy markets and highlights the need for confirmation. The ADX at 30.87 on this timeframe is concerning for bulls, pointing to a strong existing downtrend that is unlikely to reverse on a whim. This suggests that any upward moves might be met with selling pressure as traders look to re-enter short positions.
Shifting to the 4-hour chart, the picture becomes even more bearish. The RSI(14) is at 43.58, still in neutral territory but showing a downward trajectory. The MACD is firmly in negative momentum territory, and the Stochastic oscillator is giving a bearish signal (%K: 27.23, %D: 60.15). The ADX at 20.32 indicates a moderate downtrend. Both the 1-hour and 4-hour charts strongly suggest that the path of least resistance for AUDUSD is currently downwards, despite the daily chart's appearance.
The daily chart, while showing a lower RSI of 50.04 and a MACD that is negative but potentially showing positive momentum, offers a glimmer of hope for the bulls. The Stochastic oscillator here is also giving a bearish signal (%K: 44.13, %D: 49.13), but the overall trend strength indicated by ADX at 20.9 is weak, suggesting a potential for range-bound trading or a shift in trend. This is where the concept of 'audusd fundamentals' becomes critical; without a clear fundamental catalyst, the technicals on shorter timeframes often dominate.
The $0.7096 Resistance and $0.7012 Support Battle
The immediate price action is centered around two key levels: resistance at $0.7096 and support at $0.7012. A break above $0.7096, especially on increased volume and with confirmation from oscillators, could invalidate the short-term bearish outlook and open the door for a move towards higher resistance levels like $0.7147 and potentially $0.7200, a level that has seen some speculative interest in the past according to emerging queries. Such a move would likely require a significant shift in market sentiment or a dovish surprise from the Fed, or perhaps strong Australian economic data.
Conversely, a failure to break above $0.7096 and a subsequent move below the $0.7012 support would solidify the bearish trend. The next significant support level to watch would be $0.69913, followed by $0.69735 on the 4-hour chart. A sustained break below these levels would signal a deeper correction, potentially targeting the $0.69 psychological level. Given the strong downtrend signals on the 1-hour and 4-hour charts, this downside scenario appears more probable in the immediate term unless a clear catalyst emerges to shift the balance.
Forecasting AUDUSD: What Lies Ahead?
The outlook for AUDUSD remains cautiously bearish in the short term, primarily due to the confluence of a strong US Dollar, a risk-off global sentiment, and bearish technical signals on shorter timeframes. The $0.7096 resistance level is a significant hurdle for any potential bullish resurgence. For bulls to regain control, they would need to decisively break through this level, ideally accompanied by a shift in Fed policy expectations or a significant improvement in global risk appetite. The 'aud usd 0.7200 target' queries, while reflecting a potential long-term aspiration for some, seem distant given the current technical setup.
Traders should pay close attention to upcoming economic data. Any surprises in US inflation or employment figures could significantly impact Fed rate expectations and, consequently, the DXY and AUDUSD. Similarly, Australian economic releases, particularly those related to inflation or interest rate policy, will be crucial. The current market environment suggests that volatility is likely to persist. Patience and a disciplined approach to risk management will be paramount. Waiting for clear confirmation of a trend reversal or a decisive break of key levels is advisable, rather than attempting to catch a falling knife or betting against a strong dollar without sufficient evidence.
Bearish Scenario: Downside Pressure Mounts
65% ProbabilityNeutral Scenario: Range-Bound Consolidation
25% ProbabilityBullish Scenario: Reversal Attempt
10% ProbabilityFrequently Asked Questions: AUDUSD Analysis
What happens if AUDUSD breaks below the $0.7012 support level?
A break below $0.7012 would reinforce the bearish short-term trend, likely triggering further selling pressure. The next key support levels to watch would be $0.69913 on the daily chart and $0.69735 on the 4-hour chart, indicating a potential move towards the $0.69 handle.
Should I consider buying AUDUSD at current levels near $0.70436 given the daily chart's potential?
Buying at current levels carries significant risk due to the strong bearish signals on 1-hour and 4-hour charts. A more prudent approach would be to wait for a confirmed break above the $0.7096 resistance, or a clear bounce from a significant support level like $0.69735, accompanied by bullish divergence on shorter timeframes.
Is the RSI at 41.82 on the 1-hour chart a sell signal for AUDUSD?
An RSI of 41.82 is not inherently a sell signal; it sits in neutral territory. However, its downward trend on the 1-hour chart suggests weakening momentum that aligns with the prevailing bearish sentiment. A confirmed bearish signal would require further confirmation, such as MACD crossing below its signal line or a break of support.
How will upcoming US PPI data impact AUDUSD this week?
Hotter-than-expected US PPI data, as reported, reinforces hawkish Fed expectations and strengthens the US Dollar (DXY). This typically puts downward pressure on AUDUSD. If future data continues this trend, it could solidify the bearish outlook for AUDUSD, potentially pushing it towards key support levels.
Track markets in real-time
AI-powered analysis, technical indicators and real-time price data.
Join Our Telegram Channel
Breaking market news, AI analysis and trading signals instantly.
Join Channel