DXY Eyes $100.06 as Bulls Target Resistance at $99.95
The US Dollar Index (DXY) is trading at $99.95, with bulls aiming for the $100.06 resistance level amidst mixed market signals. Key economic data and Fed expectations are in focus.
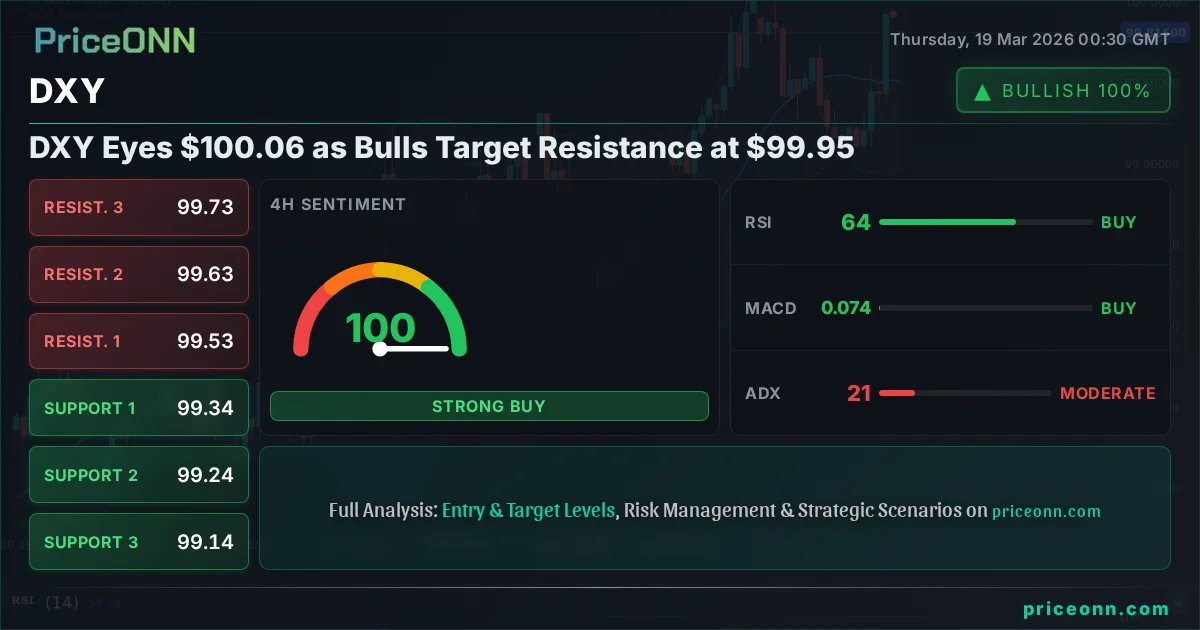
The battleground is set for the US Dollar Index (DXY) as it hovers precariously near the 100.00 mark, currently trading at $99.95. This critical juncture sees bulls pushing towards the psychological $100.06 resistance, while bears eye potential pullbacks below $99.74. The DXY's trajectory is increasingly influenced by a complex interplay of upcoming economic data, shifting Federal Reserve policy expectations, and a volatile global risk landscape, making its next move a focal point for currency traders worldwide.
- The DXY is trading at $99.95, with bulls targeting resistance near $100.06.
- Critical support sits at $99.74, a level tested multiple times this week.
- RSI at 76.26 signals overbought pressure, suggesting caution for further upside momentum.
- Fed rate hike expectations are a key driver, influencing the DXY's correlation with risk assets.
The current market sentiment surrounding the DXY is a tug-of-war between forces eager to push the dollar higher and those anticipating a correction. On the 1-hour chart, the trend is neutral with a 50% strength, yet the ADX at 25.89 indicates a strong upward trend is in play, creating a dichotomy that demands careful interpretation. While the Stochastic oscillator shows a bullish signal with %K above %D at 98.96/77.88, suggesting upward momentum, the RSI at 76.26 firmly flags overbought conditions. This divergence in signals is precisely where seasoned traders look for confirmation before committing to a direction.
The 4-hour timeframe offers a slightly clearer, though still nuanced, picture. Here, the trend is also neutral, but the ADX at 20.68 points to a medium-strength upward trend. The RSI at 64.13 remains in neutral territory, indicating room for further upward movement without immediate overbought pressure, contrasting with the 1-hour chart. The Stochastic indicator, with K at 69.24 and D at 28.28, strongly favors further gains. This timeframe suggests that while short-term overbought conditions exist on the hourly, the intermediate-term outlook might still lean bullish, provided key support levels are maintained.
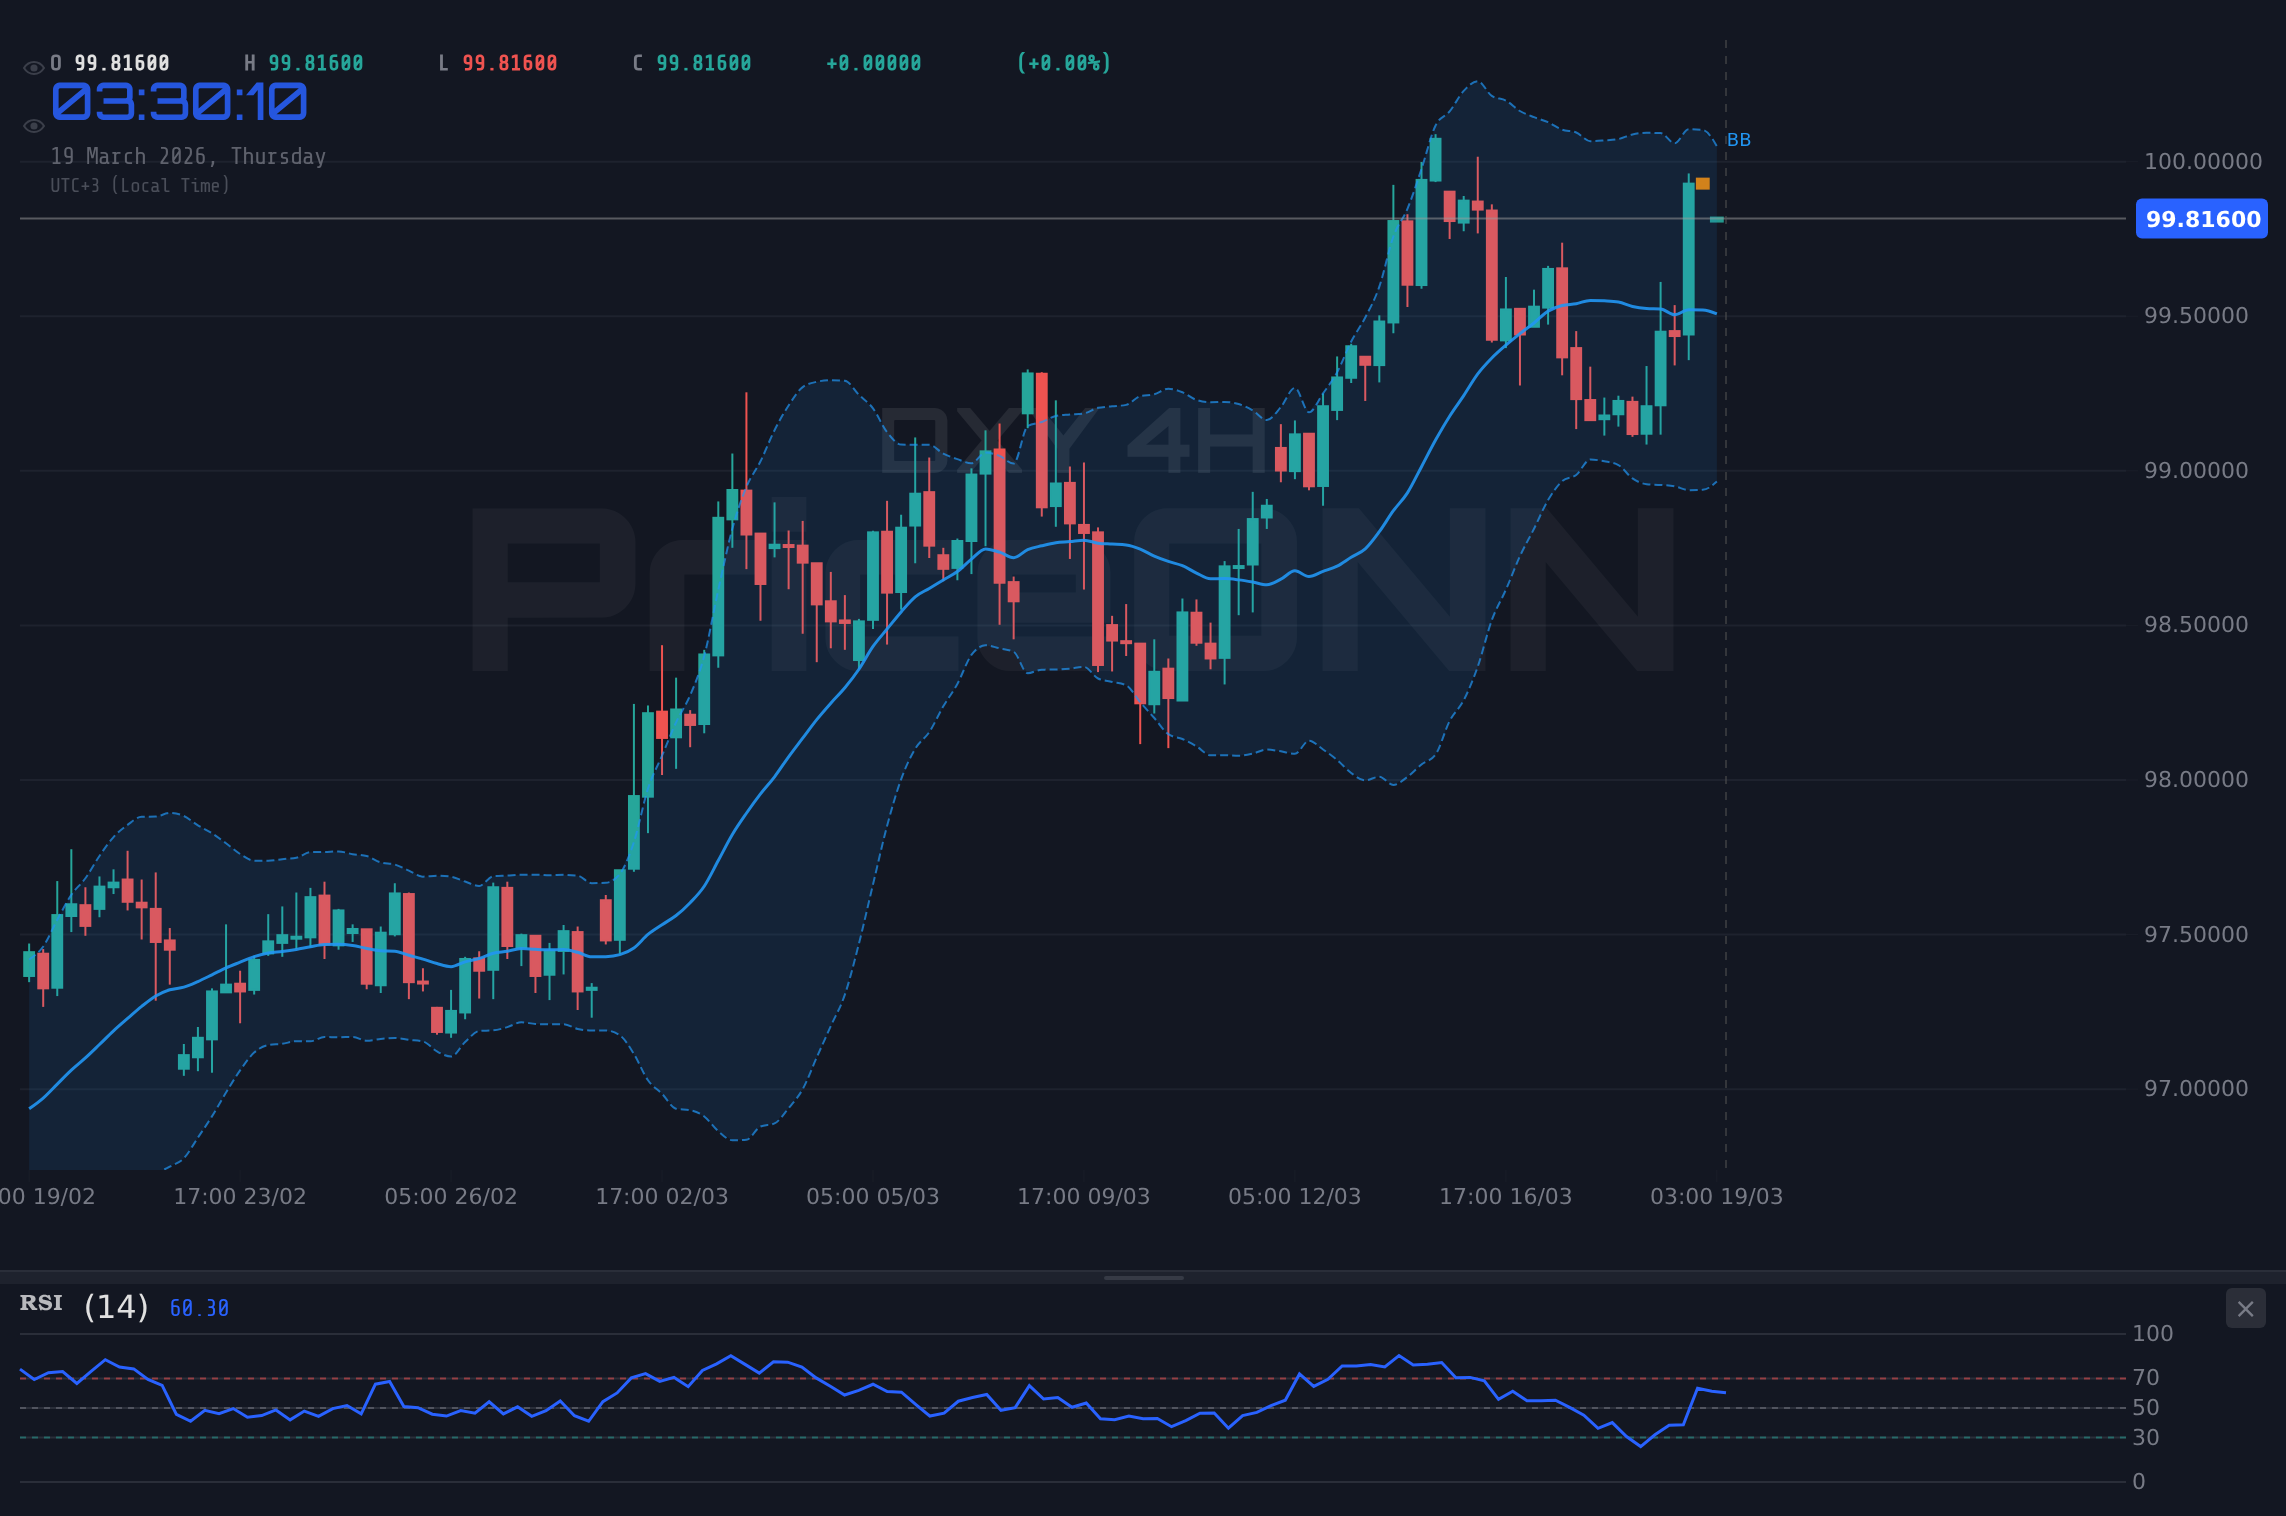
The divergence between the 1-hour and 4-hour RSI is a classic sign of potential consolidation or a short-term pullback before a continued move. Traders are watching to see if the bulls can overcome the overbought signal on the hourly, or if the bears will capitalize on this to initiate a deeper correction.
On the daily chart, the DXY trend is firmly bullish with 97% strength, reaching $99.95. The ADX at 34.51 confirms a strong upward trend. However, the daily Stochastic at 71.43/78.87 is now showing a bearish signal with %K below %D, and the RSI at 66.34 is nearing overbought territory. This daily perspective introduces a note of caution. While the prevailing trend is upward, the longer-term indicators are flashing warning signs that a significant pullback or consolidation phase could be on the horizon. The market is clearly at a critical juncture where both bullish and bearish narratives have valid supporting data.
The recent surge in the US Producer Price Index (PPI) data to significantly higher-than-expected levels, as reported on March 18th, has undeniably bolstered the bullish case for the dollar. Hotter PPI figures often signal rising inflationary pressures, which in turn can prompt the Federal Reserve to adopt a more hawkish stance on monetary policy. This expectation of sustained higher interest rates makes the dollar more attractive to investors seeking yield. The DXY's ability to hold above the 99.50 level, as noted in market commentary, further reinforces this narrative. The correlation with rising Treasury yields, which typically follow hawkish Fed expectations, also supports dollar strength.
Furthermore, geopolitical tensions, particularly in the Middle East, are playing a significant role. Reports of escalating conflicts and energy supply fears, including an attack on Iran's energy infrastructure and a surge in Brent crude prices past $108, tend to drive safe-haven flows towards the US dollar. When global uncertainty rises, the DXY often acts as a beneficiary as investors seek perceived stability. This safe-haven demand adds another layer of support to the dollar's current upward momentum, complicating the bearish argument.
However, the bullish narrative is not without its counterarguments. The RSI readings across multiple timeframes, especially the 1-hour at 76.26 and the daily at 66.34, are signaling overbought conditions. This suggests that the recent rally may be overextended in the short to medium term, increasing the likelihood of profit-taking or a technical pullback. The Stochastic on the daily chart is also showing a bearish cross, hinting that the upward momentum might be starting to wane. A sustained break below the immediate support at $99.74 would be the first technical indication that the bears are gaining control.
The strong ADX readings, particularly the 46.39 on the 1-hour and 41.46 on the daily for SP500 and Nasdaq respectively, indicate significant downward pressure on risk assets. When major indices like the S&P 500 (currently at 6616.9) and Nasdaq (at 24393.38) are experiencing sharp declines, it typically correlates with a strengthening dollar as investors flee to safety. This inverse relationship is a crucial factor to monitor. If equity markets continue to slide, it could provide additional impetus for the DXY to push higher, even in the face of its own overbought technical signals.
Traders should be aware that the strong bullish trend on the DXY, combined with overbought RSI readings on shorter timeframes, creates a scenario ripe for sharp pullbacks. A sudden shift in Fed sentiment or a de-escalation of geopolitical tensions could trigger a rapid unwinding of dollar longs.
The technical indicators present a conflicting picture, a common scenario at key psychological levels like 100.00. The 1-hour chart shows bearish divergence with RSI overbought, while the 4-hour and daily charts suggest the underlying trend remains bullish, albeit with caution flags raised. The ADX values are particularly noteworthy; on the 1-hour, it's 25.89, indicating a strong trend, yet on the daily, it drops to 14.48 for XAUUSD, signaling a weak trend there. This suggests that while the dollar might be in a strong trend, its correlated assets like gold are not confirming that strength. The current price of gold at $4839.77, down 3.31%, further highlights this divergence.
Looking ahead, the Federal Reserve's upcoming policy decision and statement will be paramount. Market participants are closely watching Fed fund futures and OIS pricing for clues on interest rate expectations. Any indication from the Fed that inflation remains a persistent concern, or that rates will stay higher for longer, will likely solidify the bullish case for the DXY, potentially propelling it towards and beyond the $100.06 target. Conversely, any dovish signals or hints of rate cuts could trigger a significant dollar sell-off.
The immediate price action around $99.95 will dictate the short-term direction. A sustained push above the $99.92 resistance, and crucially, a clean break above $100.01, would likely validate the bullish scenario, targeting higher levels. However, failure to overcome these immediate hurdles, coupled with the overbought RSI on the hourly, could see a retracement towards the support levels. The $99.74 level is particularly crucial; a break below it could signal a deeper correction, potentially invalidating the current bullish trend and opening the door for a move towards $99.65 and $99.60.
If the DXY can decisively break and hold above the $99.92 resistance, with strong confirmation from bullish MACD momentum and sustained demand, it could target the psychological $100.06 level. This scenario is supported by strong PPI data and ongoing geopolitical risk aversion.
Conversely, the bearish argument hinges on the overbought technical indicators and the potential for a Fed pivot or de-escalation of global tensions. If the DXY fails to break higher from current levels, a move back towards $99.74 and potentially $99.65 becomes likely. Such a move would be exacerbated if risk appetite returns to markets, leading to a sell-off in the dollar as investors rotate back into riskier assets like equities. The current weakness in SP500 at 6616.9 and Nasdaq at 24393.38 offers a counter-argument, suggesting risk-off sentiment is already present.
The correlation between the DXY and major currency pairs like EUR/USD (currently at 1.14688) and GBP/USD (at 1.32727) is critical. A strong DXY typically exerts downward pressure on these pairs, as seen in their current declining trends. A reversal in DXY would likely coincide with a rebound in EUR/USD and GBP/USD.
The market is at a crossroads. The fundamental drivers, particularly inflation data and Fed policy expectations, lean bullish for the dollar. Geopolitical risks further bolster this view by increasing safe-haven demand. However, the technical indicators, especially the RSI and Stochastic on shorter timeframes, are flashing warning signs of overextension. This creates a 'bull vs bear' debate where conviction is challenged by conflicting signals. The ultimate direction will likely be determined by the confluence of upcoming economic data releases and the Federal Reserve's forward guidance.
Frequently Asked Questions: DXY Analysis
What happens if DXY breaks above the $100.01 resistance level?
If the DXY decisively breaks above $100.01, it would likely trigger further buying interest, potentially targeting the $100.06 level and beyond. This scenario is supported by strong PPI data and ongoing geopolitical tensions driving safe-haven flows.
Is the DXY at $99.95 a buy signal given the RSI at 76.26?
While the DXY is in a strong uptrend, an RSI of 76.26 on the 1-hour chart signals overbought conditions. Buying at current levels carries risk; a more prudent approach might be to wait for a pullback to support or confirmation of continued momentum above resistance.
What does the ADX at 34.51 on the daily chart tell us about the DXY trend?
An ADX reading of 34.51 on the daily chart indicates a strong upward trend for the DXY. This suggests that the current price movement has significant momentum behind it, making trend-following strategies potentially more viable, though overbought conditions warrant caution.
How will upcoming Fed policy decisions affect the DXY near $99.95?
Upcoming Fed decisions are critical. If the Fed signals a hawkish stance (higher rates for longer) due to inflation, it will likely support the DXY's move towards $100.06. Dovish signals could trigger a sharp reversal, sending the DXY back towards $99.74.
Ultimately, the DXY's current position at $99.95 represents a critical battle between bullish fundamentals and cautionary technical signals. While the path of least resistance appears to be upwards, driven by inflation concerns and geopolitical risks, the overbought indicators suggest that a period of consolidation or a sharp pullback is a distinct possibility. Traders must remain vigilant, monitor key support and resistance levels, and await clearer signals from economic data and central bank policy before making significant commitments. Patience and disciplined risk management will be the cornerstones of navigating this volatile environment.
Track markets in real-time
AI-powered analysis, technical indicators and real-time price data.
Join Our Telegram Channel
Breaking market news, AI analysis and trading signals instantly.
Join Channel