BRENT Crude Tests $101.35 Support Amidst Shifting Market Sentiment
BRENT Crude hovers near $101.44, testing critical support at $101.35. Traders eye inflation data and geopolitical tensions for direction.
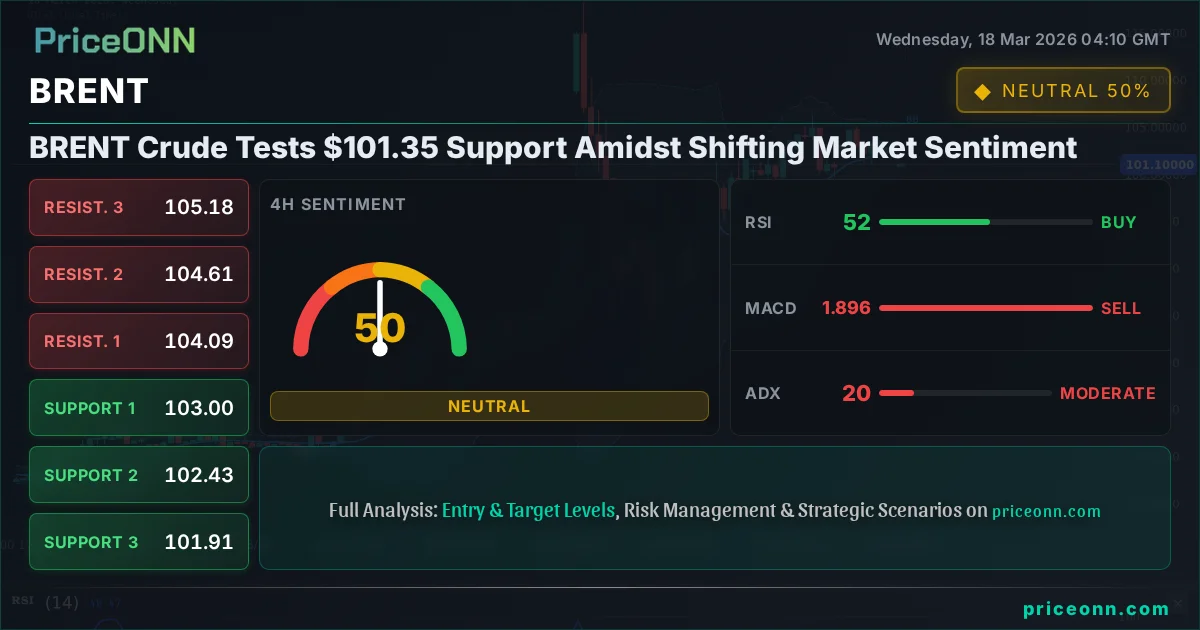
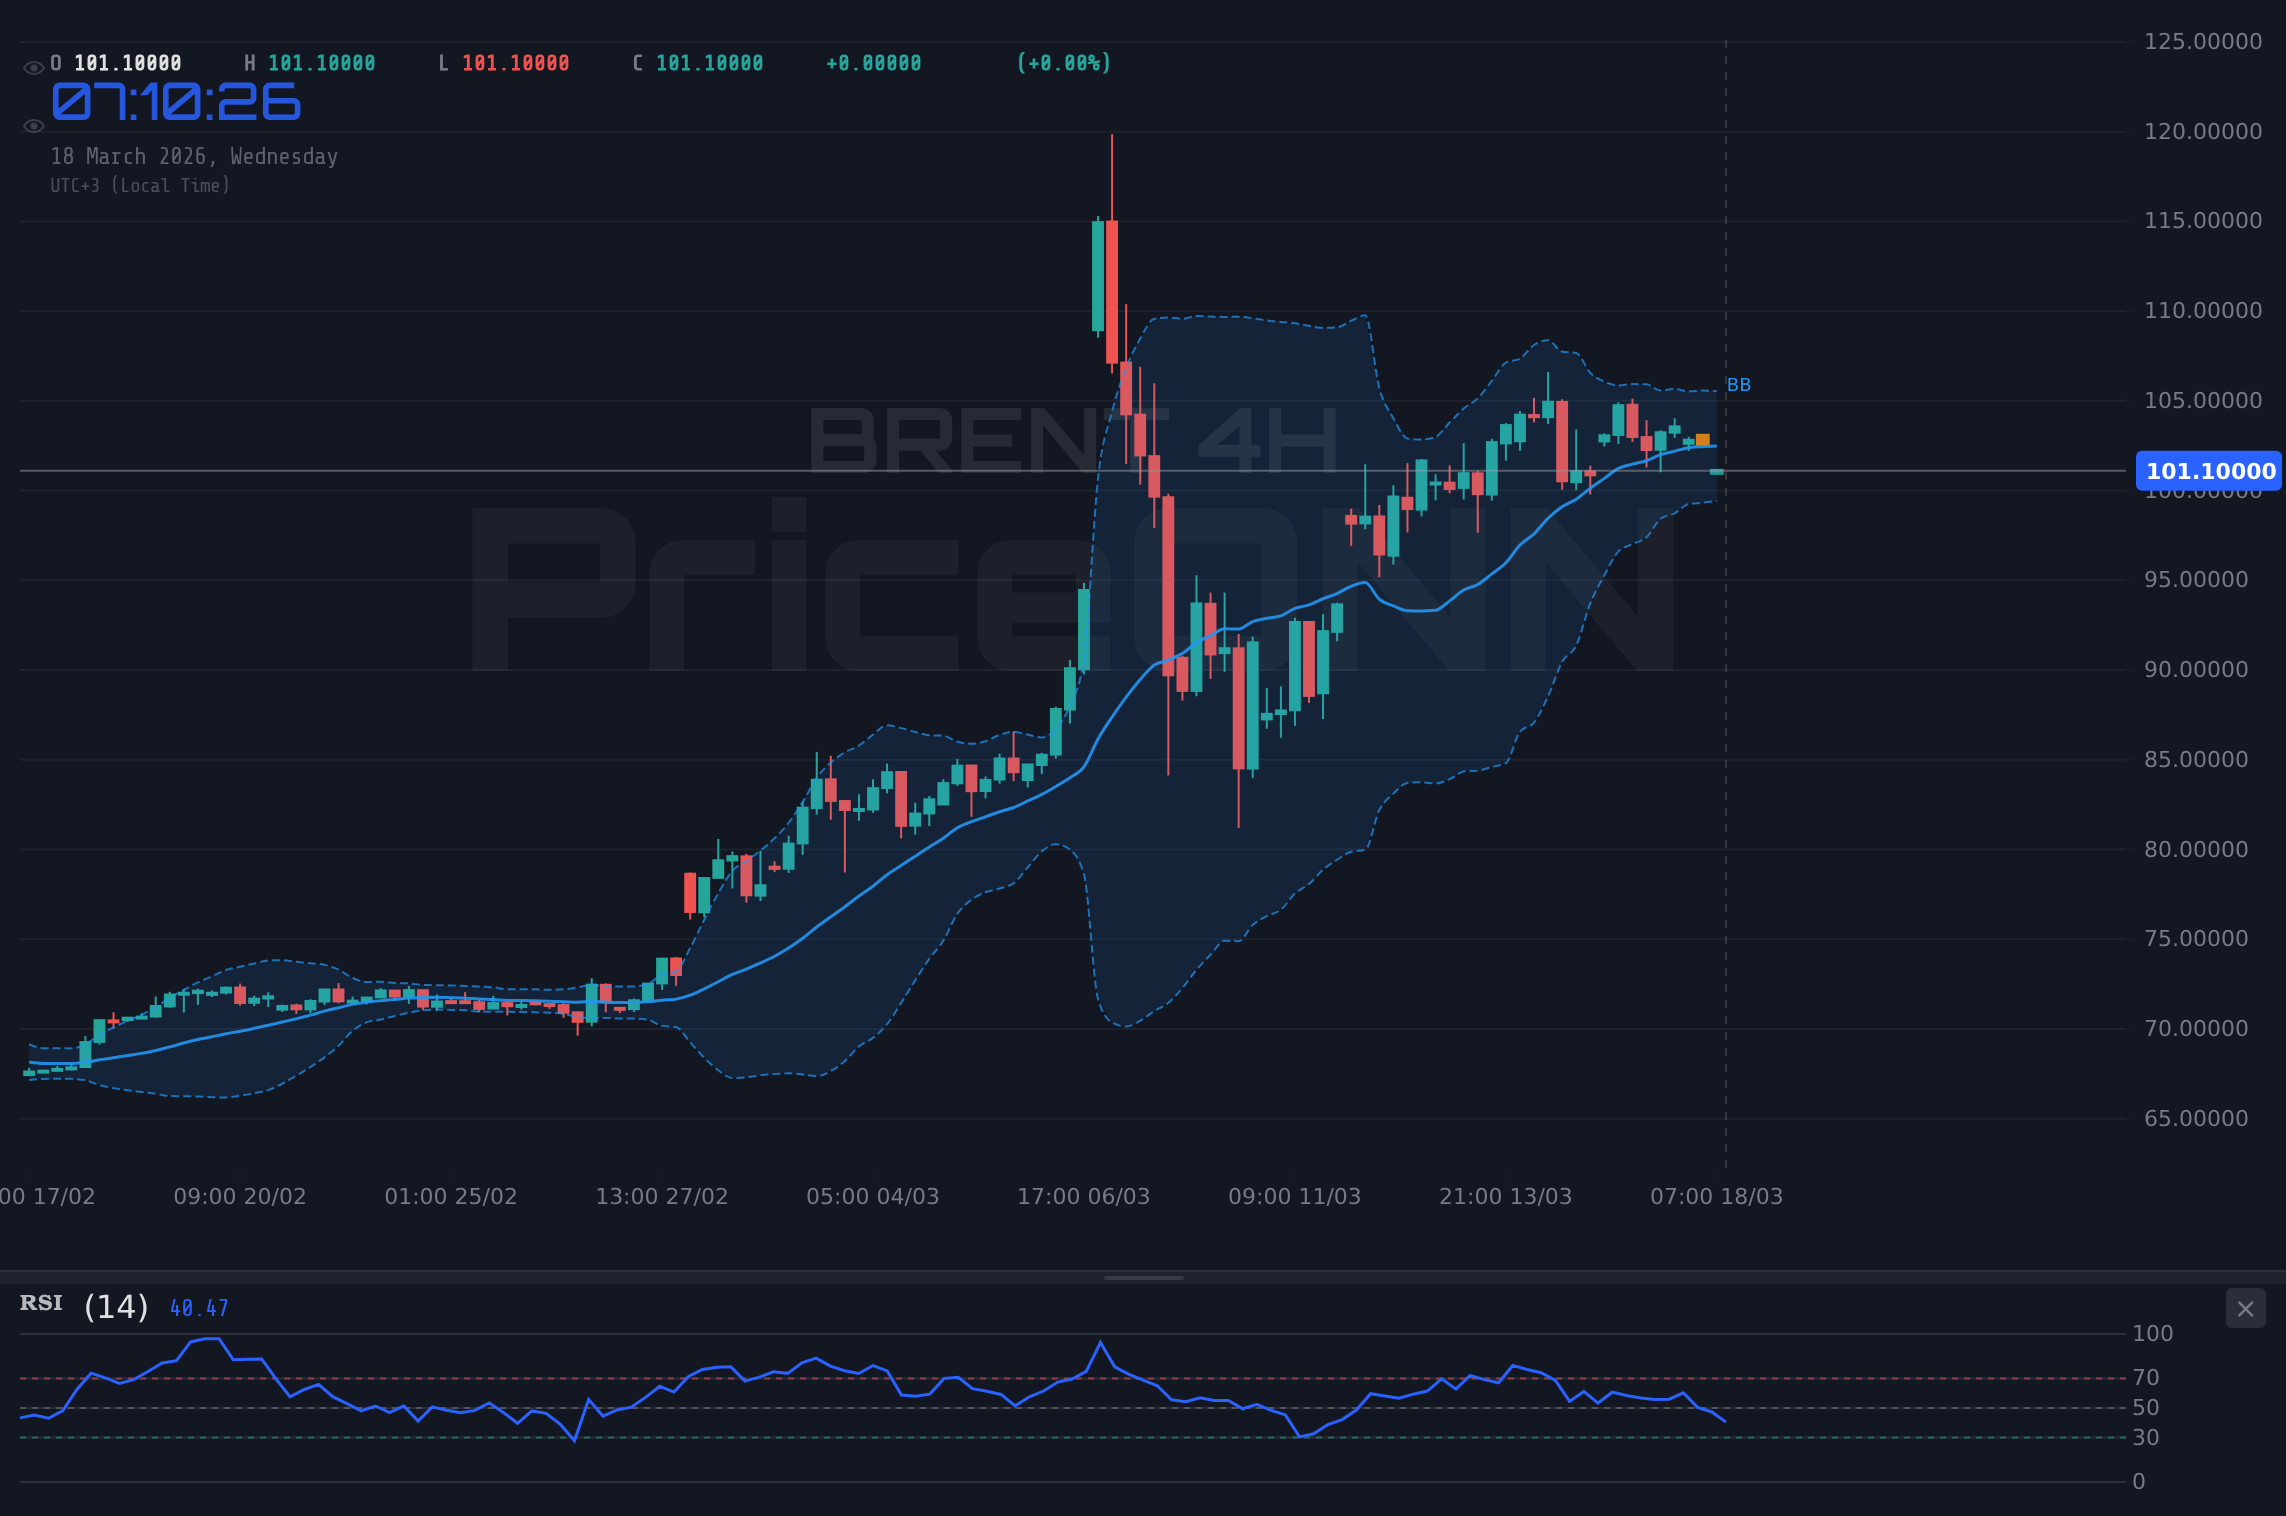
Brent Crude is currently trading at $101.44, showing a notable pullback from recent highs and testing key support levels. This move comes as market participants digest a complex interplay of geopolitical tensions, shifting central bank expectations, and crucial economic data. The $101.35 mark has emerged as a critical line in the sand; a sustained hold here could reinforce the bullish narrative, while a decisive break below it might signal a deeper correction. Understanding the forces at play is paramount for navigating this volatile energy landscape.
- RSI at 42.26 on the 1H chart signals bearish momentum, suggesting sellers are gaining traction.
- Critical support sits at $101.35, a level that has acted as a pivot point in recent trading sessions.
- The ADX at 14.11 indicates a weak trend on the 1H chart, implying potential for range-bound trading or a forthcoming breakout.
- Geopolitical risks and upcoming inflation data are key drivers influencing BRENT's correlation with broader market sentiment.
Navigating the $101.44 Crossroads: A Look at BRENT's Technical Landscape
Why BRENT Volatility Analysis Points to a Breakout
The recent price action in BRENT Crude presents a classic case of market indecision, currently finding itself at a crucial juncture around the $101.44 mark. On the 1-hour timeframe, the Relative Strength Index (RSI) at 42.26 suggests that momentum is leaning bearish, indicating that sellers are exerting pressure. However, the Average Directional Index (ADX) reading of 14.11 on the same timeframe paints a different picture; it signifies a weak trend, which often precedes a significant price move. This divergence between momentum indicators and trend strength suggests that while short-term pressure might be downwards, the market hasn't committed to a sustained direction. Traders are keenly watching whether this consolidation will lead to a breakout above resistance or a breakdown below the established support.
The interplay between these indicators highlights the current market's sensitivity. A weak ADX means that the existing trend, whatever its direction, lacks conviction. This environment can trap unwary traders caught in short-term fluctuations. The BRENT price has been oscillating, making the $101.35 support level a focal point. A failure to hold this level, particularly on increased volume, could trigger stop-loss orders, accelerating a move lower towards the next significant support at $100.67. Conversely, a strong rebound from $101.35, coupled with rising RSI on higher timeframes, could signal a resumption of the upward trend.
The MACD and Stochastic Signals: Mixed Messages
Delving deeper into the technical indicators, the MACD (Moving Average Convergence Divergence) on the 1-hour chart shows negative momentum, with the MACD line below its signal line. This reinforces the bearish short-term sentiment. However, the Stochastic Oscillator presents a more complex picture. On the 1-hour chart, the %K line at 38.09 is below the %D line at 73.67, indicating a bearish signal, but both are in oversold territory. This is where careful interpretation is needed; oversold conditions don't automatically mean a buy signal, especially if the broader trend remains down. On the 4-hour timeframe, the MACD is also showing negative momentum, but the Stochastic is more balanced, with %K at 50.92 and %D at 51.74. This suggests a potential pause or reversal in the immediate downward pressure.
The daily chart offers a longer-term perspective. Here, the MACD exhibits positive momentum, with the MACD line above its signal line. This contradicts the shorter-term bearish signals and points to underlying strength. The daily RSI at 76.36, however, is firmly in overbought territory. This is a critical reading. While it indicates strong upward momentum leading to this point, it also raises the probability of a pullback or consolidation phase. The ADX on the daily chart at 61.42 is exceptionally high, confirming a very strong uptrend. This indicates that the current pullback might be a healthy correction within a dominant bullish trend, rather than the start of a significant reversal.
The conflicting signals between the 1-hour/4-hour charts (bearish momentum, weak trends) and the daily chart (strong uptrend, overbought RSI) highlight the current market's choppiness. Traders should exercise caution and wait for clearer confirmation before committing to large positions.
Key Levels and the Battle for Control
Support at $101.35: The First Line of Defense
The immediate focus for BRENT traders is the support level at $101.35. This price point has served as a crucial psychological and technical level in recent trading sessions. A break below this mark on the 1-hour chart could accelerate selling pressure, potentially leading to a test of the next support at $100.67. The 4-hour chart reinforces this, with support identified at $100.91. If sellers manage to push BRENT below $101.35, it would signal a significant shift in short-term sentiment, potentially invalidating the immediate bullish outlook and opening the door for further downside.
However, a hold above $101.35 could be interpreted as a sign of resilience. If buyers step in at this level, we could see a bounce back towards the intraday resistance at $102.28. The ability of BRENT to reclaim the middle band of the Bollinger Bands on the 1-hour chart, currently just above $101.82, would be a preliminary sign of renewed strength. The overall market sentiment, influenced by factors like the DXY and equity market performance, will play a significant role in determining whether this support level holds.
Resistance Above $101.44: The Path to Recovery
On the upside, resistance levels are critical for BRENT to regain bullish momentum. The immediate resistance lies around $102.28 on the 1-hour chart, followed by $102.97. A decisive move above $102.28 would suggest that the short-term pullback is complete and that buyers are regaining control. This would align better with the strong uptrend indicated by the daily technicals. The resistance levels on the 4-hour chart are slightly higher, at $103.00 and $104.09, suggesting that a broader recovery would require overcoming these more significant hurdles.
The daily resistance levels are far more substantial, with $105.47, $107.35, and $109.58 marking potential targets if a sustained bullish trend resumes. For BRENT to reach these levels, several conditions need to be met. Firstly, the overbought RSI on the daily chart needs to cool off, perhaps through consolidation rather than a sharp decline. Secondly, the MACD needs to maintain its positive momentum above the signal line. Finally, broader market factors, such as easing geopolitical tensions and a stable DXY, would be necessary catalysts.
Macroeconomic Currents Influencing BRENT's Trajectory
The Dollar's Dance and Its Impact on Oil
The US Dollar Index (DXY) is currently trading around 99.31, showing a slight upward bias. Historically, a strengthening dollar tends to put downward pressure on oil prices, as commodities priced in dollars become more expensive for holders of other currencies. The DXY's current position, above the 99.19 support on the 1-hour chart but facing resistance near 99.30, indicates a tug-of-war. If the dollar continues to strengthen, driven by factors such as hawkish Fed sentiment or global risk aversion, it could exacerbate the downward pressure on BRENT. Conversely, a weakening dollar, perhaps due to dovish signals from the Fed or improved global risk appetite, would likely provide a tailwind for oil prices.
The correlation between the DXY and BRENT is not always direct, but it's a significant factor to monitor. With the DXY showing mixed signals across different timeframes - neutral on 1H, bearish on 4H, and bullish on 1D - its immediate impact on BRENT remains somewhat ambiguous. However, the long-term bullish trend of the DXY on the daily chart suggests that underlying dollar strength could be a persistent headwind for commodities like BRENT, especially if it starts to break through key resistance levels. Traders are watching the Fed's upcoming policy meetings closely, as any hint of further tightening could bolster the dollar and weigh on oil.
Inflation Expectations and Geopolitical Undercurrents
The price of BRENT Crude is intrinsically linked to inflation expectations and global geopolitical stability. Rising oil prices are a significant driver of inflation, and conversely, high inflation can sometimes be a consequence of supply disruptions or strong demand, which also boosts oil prices. Currently, the market is grappling with uncertainty surrounding future inflation trajectories. Upcoming economic data releases, particularly CPI and PMI figures from major economies, will be crucial in shaping these expectations. If inflation proves more persistent than anticipated, central banks might maintain or even increase interest rates, potentially dampening economic growth and oil demand.
Geopolitical risks remain a constant factor influencing oil markets. While no single major conflict dominates headlines right now, regional tensions, particularly in the Middle East, can quickly disrupt supply chains and send prices soaring. The recent news highlighting Germany's move to cap fuel prices amidst rising oil costs, as reported by energy news outlets, underscores the sensitivity of national economies to oil price volatility. Furthermore, discussions around North America's potential resurgence in rare earth metal processing, while not directly impacting oil, signal broader shifts in global resource dynamics and energy security considerations. Any escalation of existing geopolitical flashpoints or the emergence of new ones could lead to sharp upward spikes in BRENT prices, overriding purely technical considerations.
The current macroeconomic environment is characterized by persistent inflation concerns and geopolitical instability. This combination typically supports commodity prices like BRENT, but the tightening monetary policies by major central banks introduce a counterbalancing force by potentially slowing global growth and demand.
The Path Forward: Scenarios for BRENT Crude
Scenario A: Bullish Continuation
Should BRENT hold firm above the $101.35 support level, the bullish thesis remains intact. The primary trigger for this scenario would be a decisive close above the $102.28 resistance on the 1-hour chart, followed by confirmation on the 4-hour timeframe. This would suggest that the recent pullback was merely a healthy correction within the established uptrend, as indicated by the daily indicators. Key confirmation signals would include the RSI moving back above 50, ideally towards 60, and the MACD histogram showing renewed positive momentum. If these conditions are met, the next target would be the $103.00 resistance on the 4-hour chart, with a potential extension towards the daily resistance at $105.47 if momentum continues to build. This scenario assumes that geopolitical risks remain contained and that upcoming economic data does not signal a significant global slowdown.
Scenario B: Bearish Breakdown
Conversely, a breakdown below the $101.35 support level would invalidate the near-term bullish outlook. The trigger for this scenario would be a clear break and sustained close below $101.35 on increased volume, particularly on the 1-hour and 4-hour charts. This would likely be accompanied by a drop in the RSI below 40 and negative MACD crossovers across multiple timeframes. If this occurs, the immediate downside target would be the $100.91 support on the 4-hour chart, followed by the $100.67 level on the 1-hour chart. A further slide could test the daily support at $101.36. This bearish scenario gains probability if geopolitical tensions escalate, the US Dollar strengthens significantly, or upcoming inflation data comes in much weaker than expected, signaling a potential demand shock.
The current market presents a 'watch and wait' scenario. A confirmed break above $102.28 targets $103.00, while a close below $101.35 opens the door to $100.91. Patience is key until a clear directional signal emerges.
The Road Ahead: What to Watch in BRENT Crude
Upcoming Economic Data and Central Bank Watch
The trajectory of BRENT Crude in the coming days will largely depend on key macroeconomic releases and central bank communications. Traders will be scrutinizing upcoming inflation data, such as Consumer Price Index (CPI) reports from major economies, and Purchasing Managers' Index (PMI) surveys. Stronger-than-expected inflation figures could reignite concerns about persistent price pressures, potentially leading central banks to adopt a more hawkish stance on interest rates. This, in turn, could strengthen the US Dollar and dampen oil demand, creating headwinds for BRENT. Conversely, signs of cooling inflation might give central banks room to ease monetary policy or pause rate hikes, which could support economic growth and oil consumption.
The Federal Reserve's upcoming policy decisions and statements will be particularly influential. While the Fed may not be actively changing rates at every meeting, their forward guidance on inflation and economic outlook shapes market expectations. Any indication of a more aggressive approach to inflation control could weigh on BRENT. Similarly, the European Central Bank (ECB) and Bank of Japan (BoJ) policy stances will impact global currency dynamics and risk appetite, indirectly affecting oil prices. The market's reaction to these central bank communications, often priced into interest rate futures, will be a critical determinant of BRENT's short-to-medium term direction.
Geopolitical Developments: The Wildcard Factor
Geopolitical events remain the ultimate wildcard for oil markets. Any significant escalation or de-escalation in regions prone to conflict, particularly the Middle East, can cause rapid and substantial price swings. Traders must remain vigilant for news related to OPEC+ production decisions, supply disruptions, or political instability in oil-producing nations. The ongoing energy security discussions, even those seemingly unrelated like Germany's fuel price caps, reflect the broader global sensitivity to energy costs. While current news flow doesn't point to an immediate major supply shock, the potential for such events cannot be discounted and remains a key risk factor.
The ongoing narrative around energy transition and diversification also plays a subtle but important role. While the focus remains on immediate supply and demand fundamentals, long-term investments in renewable energy and shifts in global energy policies could influence future oil demand patterns. However, in the short to medium term, geopolitical events and macroeconomic data releases are likely to remain the dominant drivers of BRENT Crude prices. The market's ability to price in these complex factors will determine its path forward.
“The market is a giant washing machine. You put in the money, you pull out the clothes. Sometimes you get a good wash, sometimes it’s just a spin cycle.”
Frequently Asked Questions: BRENT Analysis
What happens if BRENT breaks below $101.35 support?
A break below $101.35 on the 1-hour chart, especially with increased volume, would signal a bearish short-term trend. This could lead to a retest of the $100.91 support level on the 4-hour chart, and potentially further downside towards $100.67.
Should I buy BRENT at current levels of $101.44 given the RSI at 42.26?
Buying at current levels with an RSI of 42.26 on the 1H chart carries risk, as momentum is leaning bearish. A more prudent approach would be to wait for confirmation, such as a hold above $101.35 and a move back above the 1-hour middle Bollinger Band near $101.82, or a clear break above $102.28 resistance.
Is the MACD negative momentum a sell signal for BRENT right now?
The negative MACD momentum on the 1-hour and 4-hour charts does suggest short-term selling pressure. However, the daily MACD shows positive momentum, indicating underlying strength. Traders should look for confirmation from other indicators or price action before acting solely on the short-term MACD signal.
How will upcoming inflation data affect BRENT this week?
Higher-than-expected inflation data could signal persistent price pressures, potentially leading to more hawkish central bank policies, a stronger dollar, and reduced oil demand, thus pressuring BRENT prices. Conversely, softer inflation might ease these concerns, supporting oil prices.
Track markets in real-time
AI-powered analysis, technical indicators and real-time price data.
Join Our Telegram Channel
Breaking market news, AI analysis and trading signals instantly.
Join Channel